Twenty years ago a coal or gas plant ran flat out for months at a time and shut down maybe twice a year for planned maintenance. Today the same unit might ramp up at dawn, throttle back at noon as solar floods the grid, climb again in the evening peak, and drop to minimum load overnight — sometimes shutting down completely if the price signal says so. Every one of those ramps and starts sends a fresh wave of thermal stress through headers, rotors, drums, and piping that the original design curve never accounted for at this frequency. The damage does not show up as a tripped alarm; it shows up years later as a cracked weld, a leaking tube, or a rotor bore that fails inspection sooner than the OEM ever predicted. iFactory tracks the actual stress and cycle count your fleet accumulates so you can see that damage building long before a component tells you the hard way, and you can book a demo to see it against your own unit's start history.
Every Ramp, Every Start, Every Shutdown Is Quietly Spending Your Equipment's Fatigue Life
Flexible operation keeps plants competitive on the grid, but every temperature swing a boiler, turbine, or steam line absorbs consumes a measurable slice of its remaining service life. iFactory turns your actual start and ramp history into a running fatigue-life balance, so cycling decisions get made with the damage cost on the table, not after a component fails.
A Start-Up Is Not a Switch Flipping On — It Is a Thermal Shock Wave Moving Through Metal
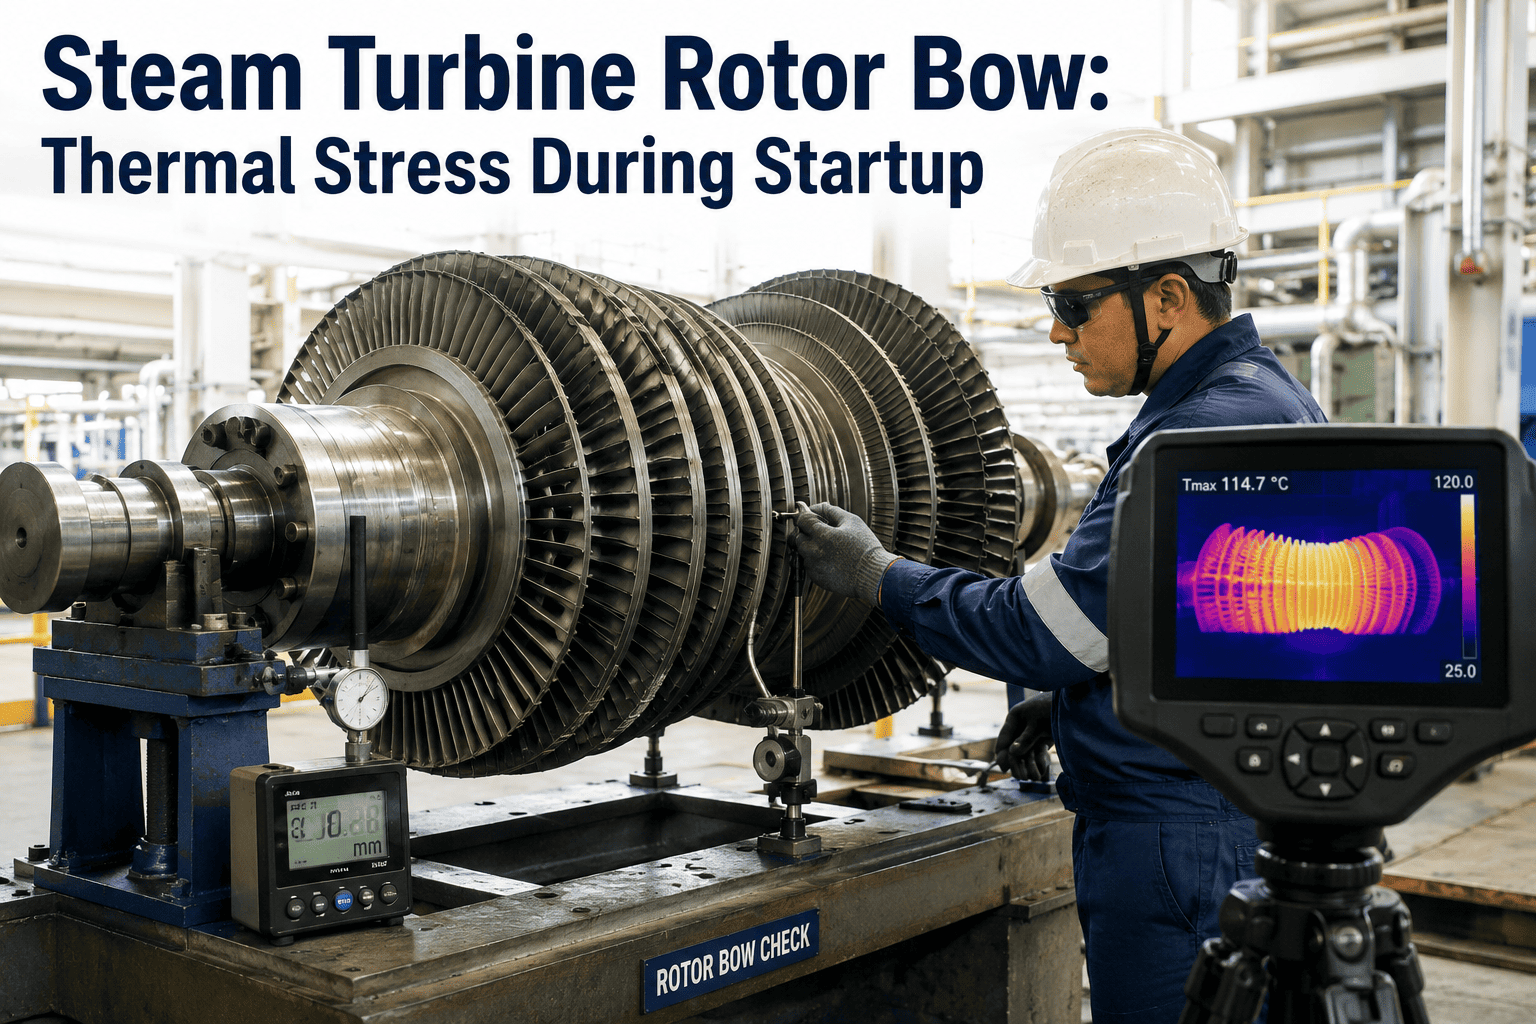
When a boiler or HRSG comes off a cold shutdown, thick-walled components like drums, headers, and turbine rotors heat up on the surface long before the core catches up. That temperature difference creates internal stress the same way a glass cracks under hot water poured into a cold cup. Every start, load swing, and shutdown repeats this cycle, and the resulting strain accumulates in the metal even though nothing about it is visible during normal operation or a routine walkdown.
Not All Starts Cost the Same — And Most Plants Don't Track the Difference
Utility cycling-cost studies consistently rank cold starts as the most damaging event a unit can experience, with warm and hot starts consuming progressively less fatigue life per occurrence but happening far more often under a two-shifting schedule. The table below reflects the general pattern reported across industry cycling-cost research.
| Start / Event Type | Typical Offline Duration | Relative Thermal Stress | Fatigue Life Consumed Per Event |
|---|---|---|---|
| Cold Start | 48+ hours | Highest | Largest single-event consumption |
| Warm Start | 8-48 hours | Moderate-High | Meaningful, moderated by residual heat |
| Hot Start | Under 8 hours | Lower per event | Small per event, large in aggregate over a year |
| Rapid Load Ramp | No shutdown | Localized, header and casing focused | Adds up independently of start-related damage |
| Low-Load Dwell | Hours to days | Creep-dominant, not fatigue-dominant | Consumes creep life rather than fatigue cycles |
The operational reality most plants miss is that a schedule built around minimizing fuel cost or chasing every price spread can unintentionally maximize cold and warm starts, which are exactly the events doing the most fatigue damage per occurrence. A unit that shuts down every weekend and restarts every Monday, for example, is logging a warm or cold start roughly fifty times a year, and each of those events is drawing down fatigue life at a rate the original design curve likely never modeled for that frequency.
Ramp rate compounds the picture further. Two units can log an identical count of cold starts in a year and still accumulate very different fatigue damage, because the rate at which each one climbs from cold metal to full temperature and pressure has a direct effect on how much thermal stress the thick-walled sections absorb during that climb. A start that takes an extra thirty to sixty minutes longer can meaningfully reduce the stress range a header or rotor experiences, which is precisely the kind of trade-off that only becomes obvious once fatigue consumption is being tracked component by component rather than assumed away.
Stop Guessing How Much Fatigue Life Your Schedule Is Spending
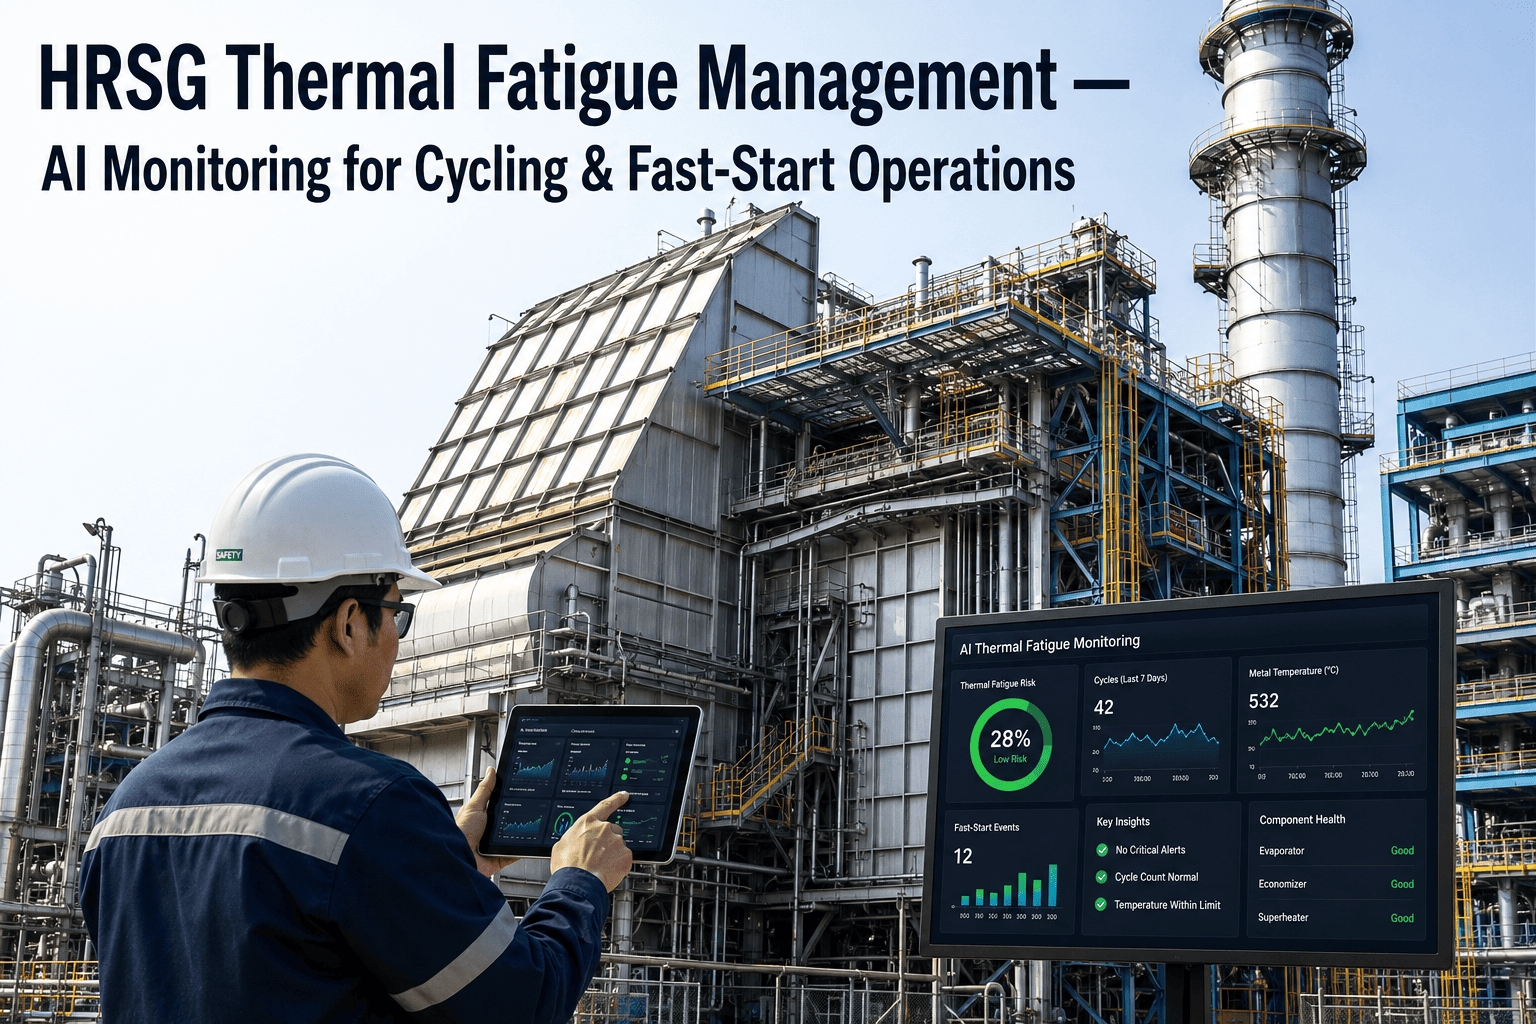
iFactory converts your actual start log and ramp-rate history into a running fatigue and creep consumption balance for every major component, so operations and reliability can finally see the same number.
Creep and Fatigue Don't Just Add Up — They Make Each Other Worse
Two separate damage mechanisms are at work in every high-temperature component that gets cycled, and treating them as one problem is where most simplified maintenance plans go wrong.
Fatigue Damage
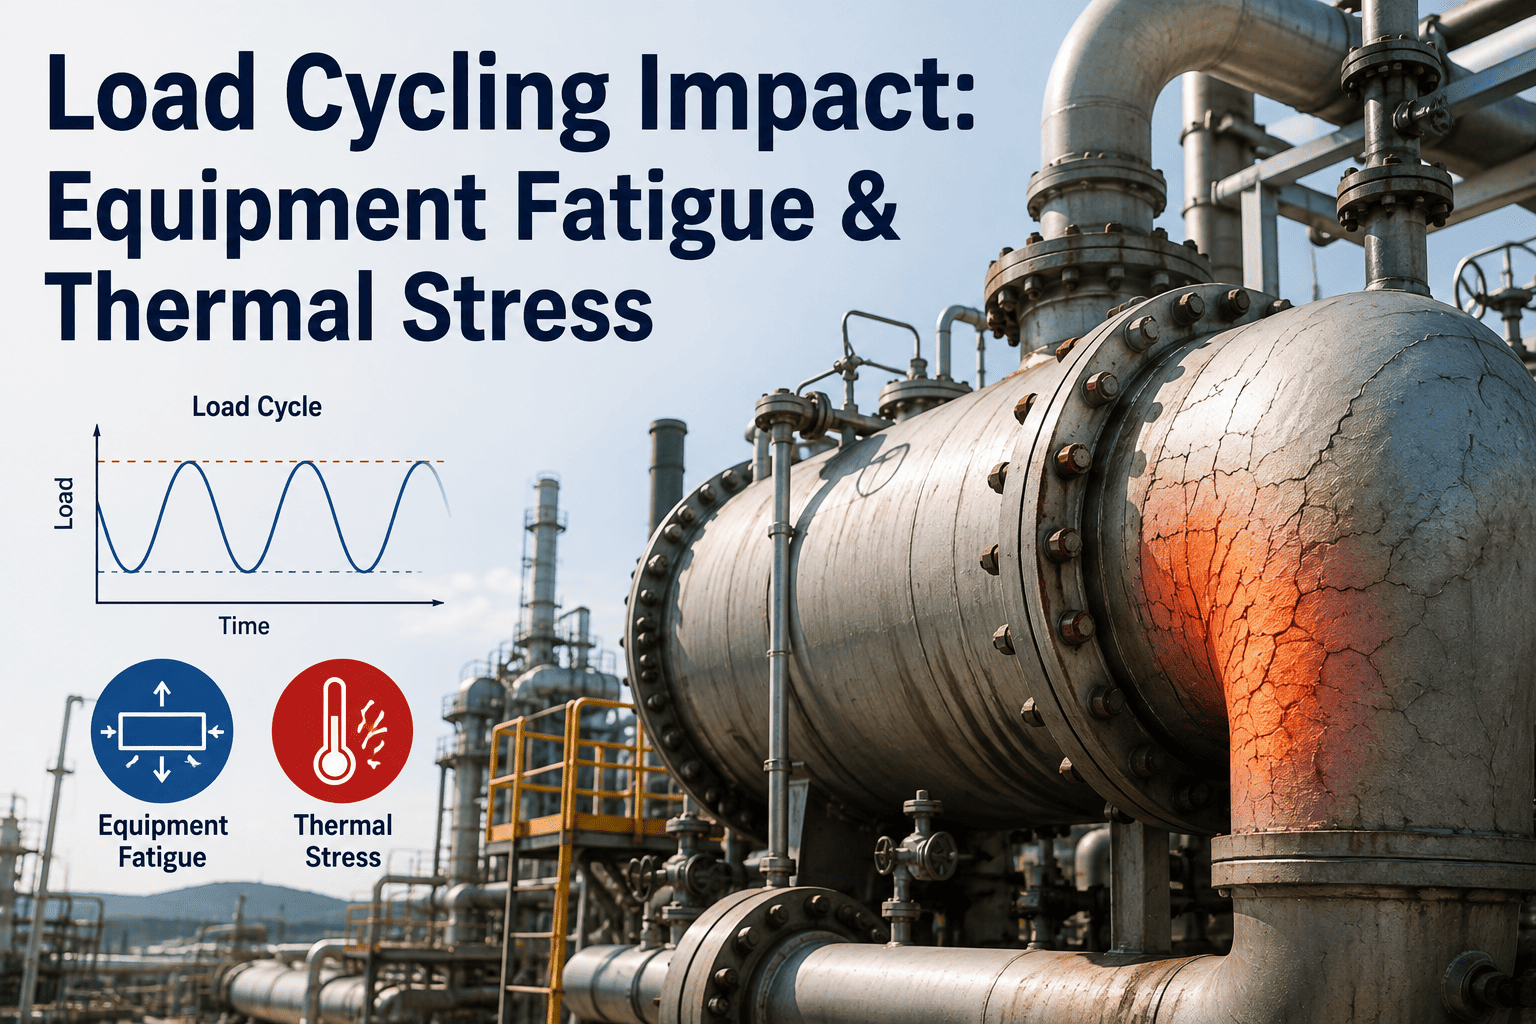
Fatigue accumulates from the repeated expansion and contraction of metal as temperature and pressure swing with every start, stop, and ramp. Each cycle creates microscopic strain, and enough cycles eventually initiate a crack, regardless of how slowly or gently any single cycle happened.
Creep Damage
Creep is different: it accumulates from sustained exposure to high stress at high temperature over time, even with no cycling at all. A component sitting at design temperature for years is still spending creep life, and localized overheating during low-load operation can quietly accelerate it.
Research into creep-fatigue interaction consistently shows the two mechanisms are synergistic rather than additive: creep strain reduces the remaining fatigue life of a component, and fatigue strain reduces its remaining creep life, which is why components exposed to both cycling and sustained high temperature can fail well ahead of a life estimate built on either mechanism alone.
Five Components That Absorb the Brunt of a Cycling Schedule
Thermal and creep-fatigue damage is not distributed evenly across a plant. A handful of thick-walled, high-temperature, geometrically complex components consistently show up first in cycling-related failure data.
Six Questions Worth Asking Before Your Plant Commits to a Heavier Cycling Duty
Dispatch decisions are usually made on fuel cost and market price, without a matching conversation about the fatigue and creep cost being spent on the equipment. These questions help bring that second cost into the room.
Turning an Invisible Cost Into a Number Operations Can Actually Manage
Plants that start tracking cycling damage as a running number, rather than an assumption baked into a maintenance calendar, consistently make different and better decisions about starts, ramp rates, and outage planning.
Fatigue Life Is a Hidden Line Item Until It Shows Up as a Forced Outage
Utility cycling-cost research has consistently found that units exposed to frequent starts and load following carry meaningfully higher equivalent forced outage rates than the same design operated at steady baseload, and that gap widens the longer an aggressive cycling pattern continues without a matching change to inspection or maintenance planning. The mechanism behind that gap is straightforward even though the accounting rarely captures it well: a component's design life was calculated against an assumed number of start and stop cycles, and every cycle beyond a gentler baseload assumption pulls forward the calendar date on which cracking, leakage, or a full replacement becomes likely.
Three cost categories tend to grow together once a fleet shifts toward heavier cycling duty, and each one is traceable back to the same underlying fatigue and creep accumulation described above.
None of these costs are visible on a day-to-day dispatch decision, which is exactly why they get underweighted against the fuel savings or market revenue a more aggressive cycling schedule appears to generate in the short term. Putting a live fatigue-life number next to the dispatch decision is what closes that gap.
What Plant Teams Ask About Load Cycling, Fatigue, and Equipment Life
Give Every Cycling Decision a Real Fatigue Cost, Not a Guess
iFactory turns start logs, ramp rates, and temperature trends into a live fatigue and creep-life balance for your critical components, so operations and reliability finally work from the same number.