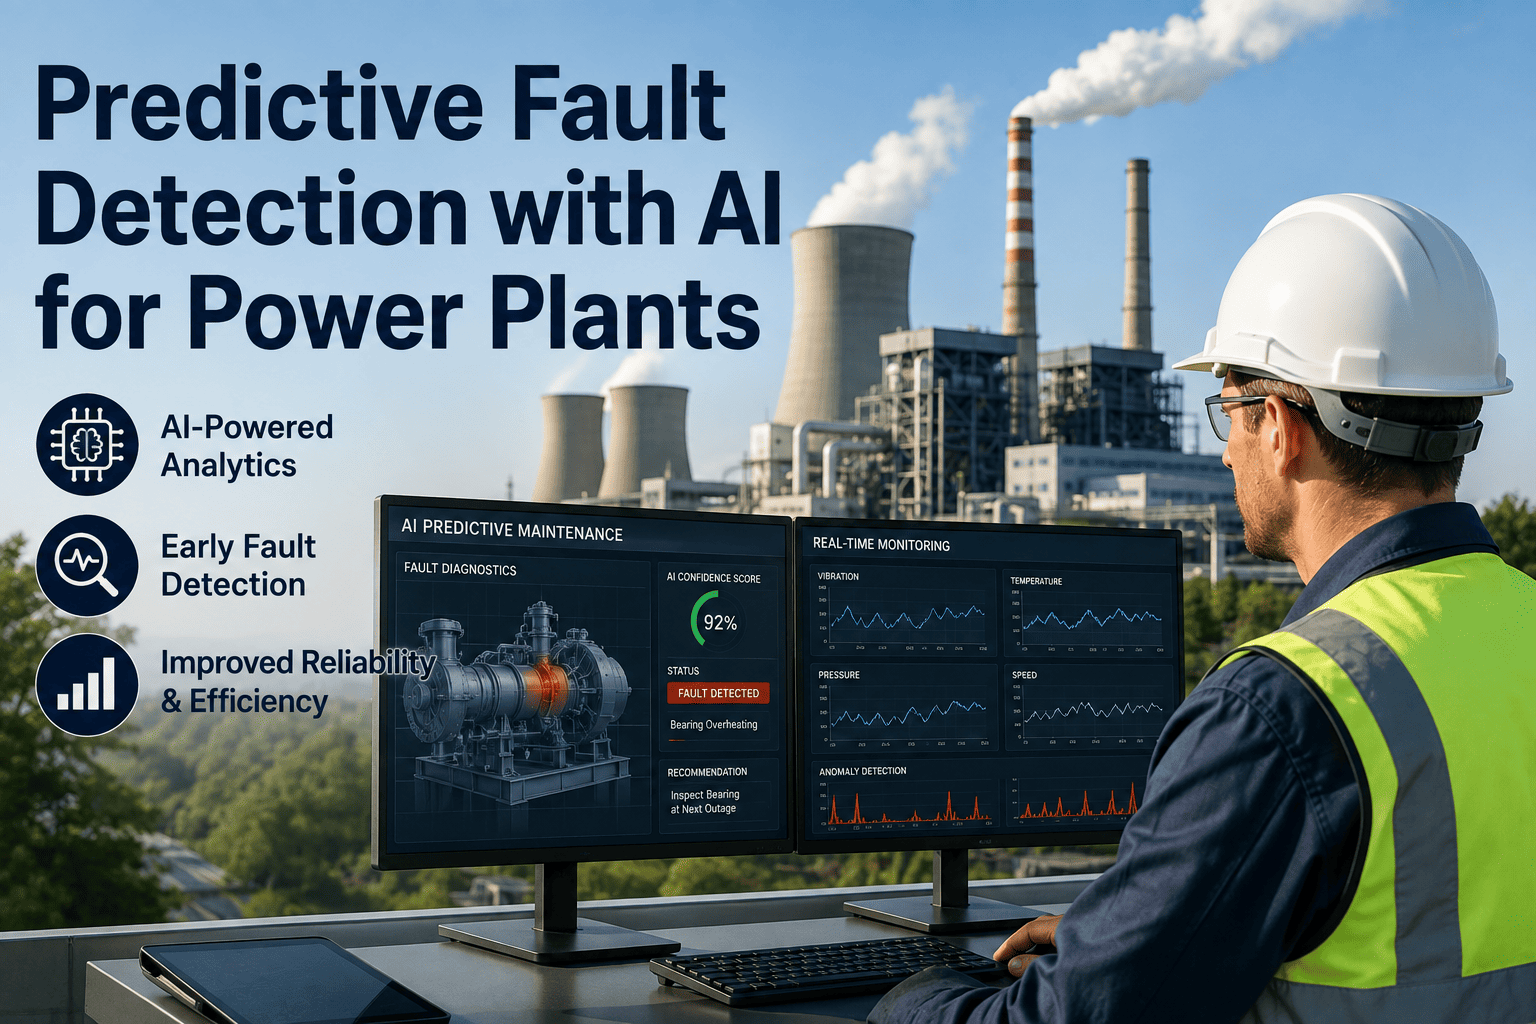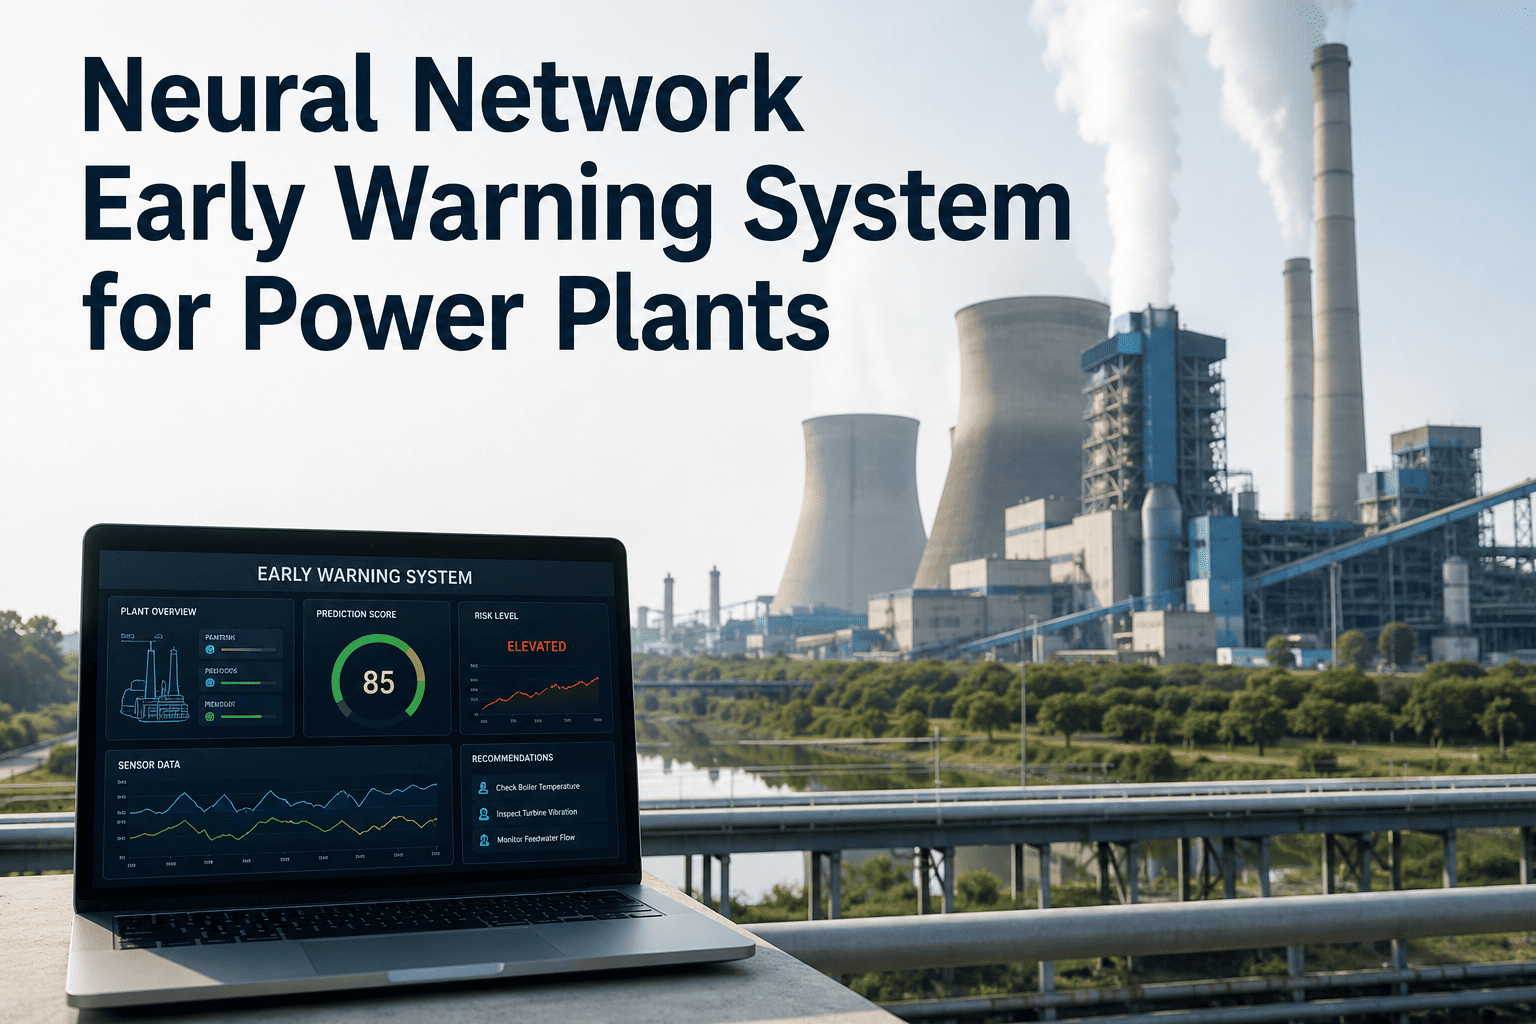
Power plant reliability teams have spent decades tuning threshold alarms on vibration, temperature, and pressure sensors, yet turbines, boilers, and rotating equipment still trip without warning during a routine shift. A threshold alarm only fires once a reading crosses a fixed line that engineers set years ago under a specific load condition, so it catches a failure only after the damage is already underway. A neural network trained on your plant's own historian data learns what normal actually looks like across every load, ambient temperature, and startup cycle, then flags the subtle pattern shift that shows up weeks before a bearing seizes or a tube wall thins past its limit. That shift from a fixed line to a learned pattern is the difference between an alarm that fires during the failure and a warning that gives your maintenance team time to plan the repair. iFactory builds and deploys these neural network early warning models directly against your plant historian, and you can book a demo to see the detection window mapped against your own equipment history.
Give Your Reliability Team a 2 to 8 Week Warning Before Equipment Fails
iFactory trains a dedicated neural network model on your plant's own historian tags, so the system learns the specific vibration, temperature, and pressure signatures that precede a failure on your turbines, boilers, pumps, and generators, instead of relying on a generic threshold that was set once and never revisited since commissioning.
Why a Threshold Alarm Only Tells You After the Damage Has Started
Most plant control systems still rely on a single high or high-high setpoint per tag, configured once during commissioning and rarely revisited as equipment ages or duty cycles change. That single number cannot represent the many different versions of normal that a piece of rotating equipment moves through across a start, a load ramp, a hot day, and a cold night, so it either sits too loose to catch early degradation or too tight to avoid nuisance trips. A neural network replaces that single line with a learned model of normal behavior that adapts to load and condition, closing four specific blind spots that fixed thresholds cannot cover on their own.
None of these four gaps are a flaw in how your instrumentation was configured. They are structural limits of a single-line, single-condition alarm strategy, and closing them requires a model that can hold hundreds of interacting variables in mind at once rather than one tag compared against one number, which is exactly the kind of pattern recognition a neural network is built for.
How Much Warning You Actually Get, By Equipment and Fault Type
The value of an early warning system is measured in one number: how many weeks of lead time does it buy your maintenance planner before the asset actually fails. That number depends heavily on which sensors are available and how gradually the specific failure mode develops, so the table below breaks out documented detection windows across the fault types that drive the most forced outages in thermal and combined-cycle plants.
| Fault Type | Sensors Monitored | Neural Network Lead Time | Typical Legacy Alarm Response |
|---|---|---|---|
| Turbine Bearing Wear | Vibration spectra, bearing temperature, lube oil particle count | 3 to 6 weeks | Fires only after vibration RMS crosses the fixed alarm limit |
| Boiler Tube Thinning and Erosion | Tube metal temperature, flue gas chemistry, wall thickness trend | 4 to 8 weeks | Discovered at the next scheduled ultrasonic thickness survey |
| Generator Winding Insulation Degradation | Partial discharge activity, winding temperature, load current | 6 to 12 weeks | Flagged only after an insulation resistance test fails outright |
| Pump Cavitation and Impeller Wear | Suction pressure, discharge flow, motor current draw | 2 to 4 weeks | Noticed once flow output has already visibly dropped |
| Feedwater Valve Sticking | Valve position feedback, actuator current, response time | 1 to 3 weeks | Caught during a manual control loop tuning check |
| Transformer Partial Discharge | Dissolved gas trend, partial discharge sensors, load temperature rise | 8 to 16 weeks | Found only at the next scheduled dissolved gas oil sample |
Every row in that table represents the same underlying pattern: a slow signal drift that a fixed threshold is structurally unable to see, but that a model trained on months of healthy operating history can flag the moment the pattern starts to diverge from baseline. The exact lead time for your plant will depend on sensor coverage and data history, which is why backtesting against your own past failures during model training matters more than any published industry average.
From Raw Sensor Tags to a Confidence-Scored Alert
Building an early warning model is not a one-time export of data into a generic algorithm. It is a five-stage process that connects to your control system, learns the specific behavior of your own assets, and ends with an alert that your maintenance team can act on with confidence rather than guesswork about whether the reading is real.
Historian Connection and Data Ingestion
iFactory connects to your existing DCS or historian over a standard read-only interface and pulls years of tag history for the target assets, without adding load to the live control network or requiring any change to how operators interact with the system.
Baseline Pattern Learning
The neural network studies the labeled periods of healthy operation across every load band, ambient condition, and startup or shutdown cycle, building a model of what normal actually looks like for that specific asset rather than for a generic class of equipment.
Adaptive Threshold Calibration
Instead of one fixed number, the alert boundary moves with operating condition, so a reading that would be alarming at low load but normal at full load is judged correctly, cutting the false positive rate that drives alarm fatigue on the floor.
Anomaly Scoring and Confidence Rating
Every incoming reading is converted into a live health score, and the model attaches a confidence percentage to each anomaly rather than a flat pass or fail flag, so your team can immediately see how certain the system is before dispatching a crew.
Alert Routing Into the Work Order System
Once a scored anomaly crosses your agreed confidence threshold, the system automatically opens a work order, attaches the supporting trend data, and routes it to the correct maintenance crew instead of leaving the finding buried in a dashboard nobody checks.
Every stage in that pipeline is validated against your own historical failure record before the model is trusted with live alerts, which is why the backtesting step during training and the shadow mode step during deployment both exist as hard gates rather than optional checks.
A 10 to 12 Week Path From Historical Data to Live Early Warning
Plants cannot afford to wait a year for a data science project to prove itself, and they should not have to. iFactory runs a structured deployment that moves from an initial historian connection to a live, trusted alert stream inside a single quarter, validating every prediction against your own past failure events before the model is allowed to page anyone.
Data Collection and Historian Integration
The engineering team maps every relevant tag across your target assets, confirms sampling rates and data quality, and pulls a multi-year window of history that includes both healthy operation and any documented past failures for those units.
Model Training and Backtesting
The neural network is trained on the healthy baseline and then backtested against every known past failure event in the dataset, so the team can measure exactly how many weeks of lead time the model would have provided before each real outage.
Shadow Mode Validation
The model runs live alongside your existing threshold alarms without triggering any action, and every anomaly it raises is compared against operator judgment and maintenance findings to confirm accuracy before the system is trusted to drive work orders.
Live Cutover and Operator Training
Once shadow mode accuracy meets the agreed threshold, alerts go live and start creating work orders automatically, operators are trained on reading the confidence scores, and the reliability team receives a documented validation report for the handoff.
Because the model keeps running through every stage of this timeline rather than pausing between phases, your reliability team gets visibility into detection accuracy well before go-live, which makes the eventual cutover a formality rather than a leap of faith.
Measured Outcomes From Neural Network Early Warning Deployments
The figures below are aggregated from iFactory early warning deployments across turbine, boiler, and balance-of-plant equipment, measured over multiple operating seasons following live cutover and validated against documented maintenance and outage records.