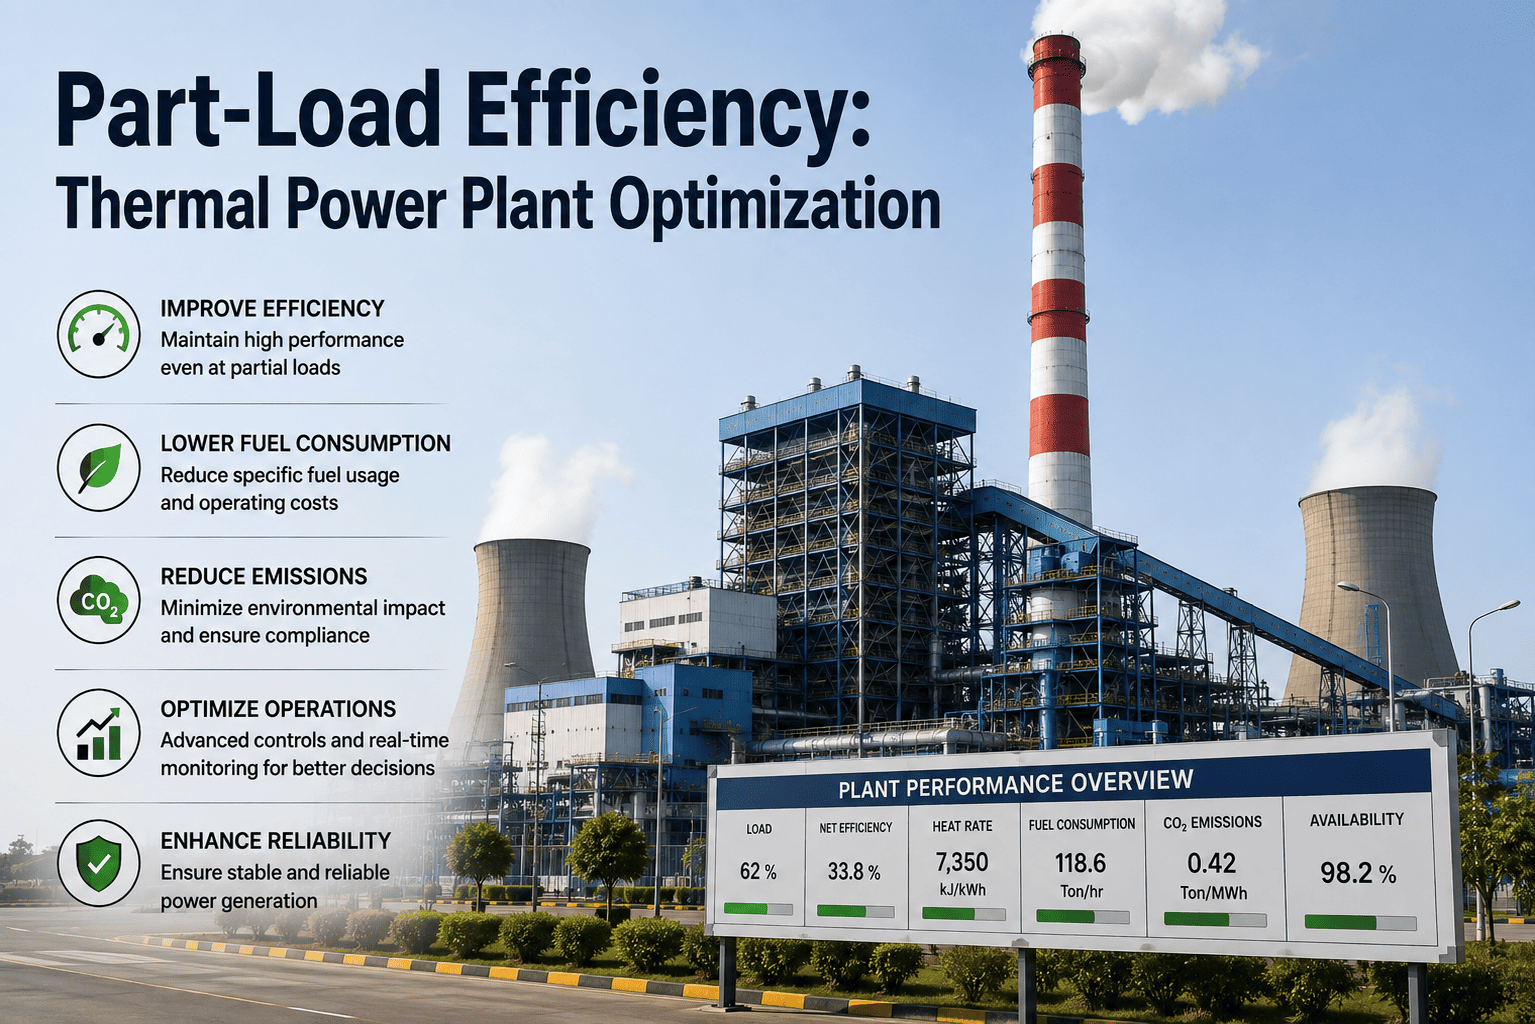
A thermal power plant's efficiency figure on its design specification sheet describes exactly one operating point: full load, at design ambient conditions, on a clean unit. Almost none of a plant's actual operating hours happen there anymore. Renewables have pushed thermal units into a supporting role, cycling between 40% and 100% load multiple times a day, and every one of those part-load hours burns more fuel per megawatt than the nameplate number promises. Plant performance teams working to close that gap can Book a Demo to see how iFactory tracks heat rate against load in real time.
Why Part-Load Operation Has Become the Normal Case, Not the Exception
Grid operators used to dispatch thermal plants near their design point and treat cycling as a rare, disruptive event reserved for maintenance outages or unusual demand swings. That assumption no longer holds. As wind and solar penetration grows, thermal units increasingly exist to fill the gap those sources leave behind, which means ramping down at midday, ramping back up in the evening, and holding intermediate loads for hours at a time. A plant's efficiency at 100% load might still look respectable on paper while its actual fleet-average heat rate quietly degrades because so many operating hours now happen well below that point.
The financial consequence compounds quietly. A few percentage points of heat rate penalty at a single load point rarely triggers the kind of attention a forced outage does, but multiplied across thousands of part-load hours a year, it can represent a larger annual fuel cost impact than an unplanned outage, simply because it never shows up as a single dramatic event that demands a root cause investigation.
Where Efficiency Actually Leaks Out at Reduced Load
Part-load losses do not come from a single source — they accumulate across several mechanisms simultaneously, and understanding each one separately is what makes a targeted improvement program possible instead of a vague push to "run more efficiently." Some of these mechanisms interact, which is part of what makes part-load diagnosis harder than full-load performance testing: a combustion tuning issue can mask itself as a heat exchanger effectiveness problem if the two are only observed through a single blended heat rate number rather than measured independently.
Throttling Losses
Reducing load by throttling steam flow through partially closed control valves creates a pressure drop that destroys exergy before the steam ever reaches the turbine, converting useful energy into heat with no corresponding work output.
Fixed Auxiliary Load
Fans, pumps, and control systems draw power that does not scale down proportionally with output, so auxiliary consumption becomes a larger percentage of gross generation as load falls, dragging net plant efficiency down further than the turbine cycle alone would suggest.
Combustion Efficiency Drift
Burners and combustion air systems are tuned for a design-point air-to-fuel ratio, and at reduced firing rates that tuning drifts away from optimal, increasing excess air and unburned carbon losses unless the control system actively compensates.
Heat Exchanger Effectiveness Loss
Feedwater heaters, condensers, and economizers are sized around design-point flow rates, and at reduced flow their heat transfer effectiveness changes in ways that are not always favorable, sometimes increasing terminal temperature differences and reducing regenerative cycle benefit.
Condenser Backpressure Sensitivity
At part load, condenser vacuum performance can shift due to reduced cooling water flow demand or ambient variation, and any resulting backpressure increase erodes the turbine's available enthalpy drop independent of everything happening upstream.
Variable Pressure Operation: The Single Biggest Lever Against Throttling Loss
The most direct fix for throttling losses is to stop throttling in the first place. Under constant (fixed) pressure operation, load is reduced by closing the governing valve while boiler pressure stays at its design value, which is exactly the mechanism that destroys exergy across the valve. Sliding, or variable, pressure operation instead reduces boiler pressure to match the lower load, keeping the governing valve closer to fully open and letting the turbine's own expansion path do the work reduction instead of a throttled valve. The trade-off is that variable pressure operation places different thermal stress and response-time demands on the boiler and turbine, particularly during rapid load changes, so the choice between fixed, sliding, and hybrid modified-sliding pressure strategies has to weigh efficiency gains against cycling durability and response speed requirements.
In practice, few plants run a pure version of either extreme. Most operate somewhere on a spectrum, holding fixed pressure down to a certain load threshold and transitioning to sliding pressure below it, or using a modified sliding pressure curve that retains partial throttling as a safety margin for fast-response events like frequency regulation. Where that transition point sits, and how the pressure setpoint curve is shaped below it, is rarely revisited after initial commissioning even though the unit's actual cycling pattern often looks very different years later than what the original curve was tuned against. Reviewing and re-tuning that curve against several years of actual operating data, rather than the original design assumptions, is frequently where meaningful additional efficiency is still sitting unclaimed on units that already technically operate in sliding pressure mode.
| Control Strategy | Efficiency at Part Load | Load Response Speed | Thermal Stress Impact |
|---|---|---|---|
| Fixed (constant) pressure | Lower — throttling loss dominates | Fast | Low — pressure stays constant |
| Sliding pressure | Higher — throttling loss minimized | Slower | Higher — pressure and temperature both shift |
| Modified sliding pressure | Balanced — partial throttling retained | Moderate | Moderate |
Auxiliary Power: The Overhead That Grows as a Percentage When Load Falls
Auxiliary systems — boiler feed pumps, forced and induced draft fans, cooling water pumps, and pulverizers — are typically sized for full-load flow requirements, and while their power draw does fall as load reduces, it rarely falls proportionally. A feed pump running at 60% load might still consume 75% of its full-load power if it is not equipped with variable-speed drive control, because throttling flow through a control valve on a constant-speed pump wastes energy in exactly the same way that throttling steam through a governing valve does. This is why auxiliary power reduction has become one of the more reliably profitable part-load efficiency investments: converting fixed-speed auxiliary drives to variable-frequency drives lets pump and fan power scale down much closer to proportionally with reduced flow demand, directly improving net plant heat rate at every load point below 100%.
Why a Single Fleet-Average Heat Rate Number Hides the Real Problem
Most plants still report heat rate as a single monthly or quarterly average, and that number is almost useless for diagnosing part-load losses because it blends hours spent near design load with hours spent well below it into one figure that trends slowly and reveals little about mechanism. A unit could be losing several percentage points of efficiency specifically in the 55%–70% load band while its full-load performance stays essentially unchanged, and a fleet-average number would show only a modest overall drift that gets attributed to general aging rather than a specific, fixable control issue.
Breaking heat rate down by load band, and further by control mode, auxiliary configuration, and ambient condition, turns a vague trend into an actionable diagnosis. A unit that shows a sharp efficiency cliff specifically when transitioning from fixed to sliding pressure control, for instance, is telling a very different story than one with a smooth, gradual decline across the whole load range — and each story points to a different fix, one toward a control setpoint problem and the other toward a broader mechanical or fouling issue that needs a different diagnostic path entirely. This level of granularity is difficult to sustain with manual performance testing alone, since scheduled tests happen at a handful of fixed points rather than continuously across however the unit actually operates day to day, which is exactly the gap that continuous, automated load-band tracking is built to close, turning a lagging quarterly average into an operating signal the performance team can act on the same week a deviation appears rather than months after the fact.
Building a Part-Load Efficiency Program That Actually Moves the Needle
Chasing part-load efficiency without first understanding where a specific unit loses the most heat rate is how plants end up spending capital on the wrong retrofit. A structured program starts with measurement across the full operating range, not just the design point, and prioritizes fixes by the load bands where the unit actually spends the most operating hours.