Every power generation fleet operates along a maturity curve that determines how effectively its operational data translates into plant reliability and financial performance. This guide provides a complete strategy framework for evolving your power plant analytics from reactive to predictive, with practical steps, ROI benchmarks, and a technology roadmap aligned with proven deployment methodology. Book a demo to assess your current analytics maturity level and build your transition roadmap.
The Reactive-to-Predictive Analytics Divide in Power Generation
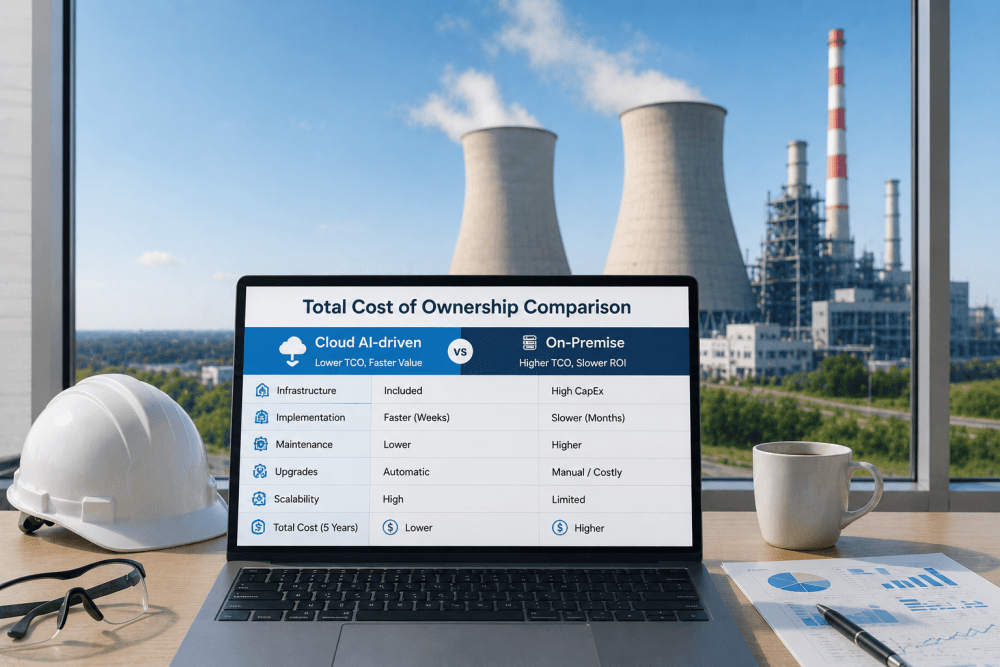
The gap between reactive and predictive analytics in power generation is not a gap in data availability, it is a gap in data integration and intelligence. The predictive plant connects those same data streams to a causal AI engine that continuously evaluates equipment condition, correlates cross-system signals, and generates actionable warnings before the failure mode advances to a forced outage. The difference is not the equipment, it is the analytics architecture connecting it. Book a demo to see how iFactory connects your existing data streams into a unified predictive intelligence layer.
- Maintenance triggered by equipment failure, not by leading indicators
- Performance data siloed across separate SCADA, CMMS, and compliance systems
- Unplanned downtime costs absorbed as unavoidable operational reality
- Manual data aggregation across sites creates weeks-long reporting latency
- PM intervals based on calendar schedules, not actual asset condition
- Compliance documentation assembled manually ahead of each audit cycle
- AI failure prediction 180 days in advance with specific intervention guidance
- Unified platform ingesting IoT, SCADA, emissions, and maintenance data
- Unplanned downtime reduced by 47% through early degradation detection
- Real-time fleet-wide dashboard with cross-site benchmarking
- Condition-based maintenance triggered by AI-identified wear patterns
- Automated compliance reporting with audit-ready documentation
Analytics Maturity Model: Benchmarks from iFactory Power Generation Deployments
Power generation clients that have completed the transition from reactive to predictive analytics through iFactory's deployment methodology consistently report improvement across four core operational metrics. These benchmarks represent the minimum improvement observed across a fleet of twelve combined-cycle and simple-cycle power stations deploying iFactory's AI analytics platform over an 18-month period.
Four Pillars of Power Plant Analytics Capability
A comprehensive power plant analytics strategy rests on four interdependent capability pillars. Each pillar addresses a distinct operational domain, and together they form the complete intelligence layer required to transition from reactive fleet management to predictive stewardship. Organizations that book a demo receive a detailed capability assessment across all four pillars mapped against their current plant configuration.
Implementation Roadmap: Five Phases to Predictive Analytics Maturity
Transitioning from reactive to predictive analytics does not happen overnight, and it does not require replacing your existing control systems or CMMS platform. The most successful power generation analytics deployments follow a structured five-phase methodology that builds capability incrementally while delivering measurable value at each stage.
Predictive Maintenance Application Matrix for Power Generation Assets
The predictive maintenance value in power generation varies by asset class, failure mode, and the warning lead time achievable through AI analytics. The matrix below summarizes iFactory's monitored parameters, detectable failure modes, warning lead times, and estimated avoided cost per event across the primary generation asset classes. Each row reflects actual deployment data aggregated across iFactory's power generation client base. Book a demo
| Generation Asset | iFactory Monitoring Parameters | Failure Mode Detected | Warning Lead Time | Estimated Avoided Cost / Event |
|---|---|---|---|---|
| Gas Turbine | Vibration, exhaust gas temperature spread, combustion dynamics, blade path temperature | Blade degradation, combustion instability, bearing wear, hot gas path corrosion | 14-30 days | $500K-$2.0M |
| Steam Turbine | Bearing vibration, steam seal leakage, thermal expansion, rotor position | Bearing wear, seal degradation, rotor bow, blade fouling | 10-25 days | $400K-$1.5M |
| HRSG | Drum level, tube skin temperature, feedwater flow, pressure differential | Tube rupture, thermal stress cracking, corrosion fatigue, feedwater heater fouling | 7-21 days | $200K-$800K |
| Generator | Stator temperature, hydrogen purity, excitation current, winding vibration | Winding degradation, brush wear, cooling system loss, rotor ground fault | 5-14 days | $300K-$1.2M |
| Cooling Tower | Fan vibration, water flow rate, basin temperature, motor current | Bearing failure, fan imbalance, fill degradation, motor winding overheating | 7-21 days | $100K-$400K |
| Balance of Plant | Pump vibration, valve position feedback, compressor discharge temperature | Pump seal failure, valve stiction, compressor valve degradation | 5-14 days | $50K-$200K |
Expert Perspective: What Predictive Analytics Changes in Power Plant Operations
We spent three years trying to build predictive models on top of our existing SCADA historian. We had fifteen years of operational data, but we did not have the causal AI engine to make sense of it. iFactory came in, connected to the same data historian we had been using, and within 60 days identified a compressor blade degradation pattern in our gas turbine fleet that our engineering team had been missing for two years. That single finding prevented a forced outage that would have cost us over one million dollars in replacement power alone. The difference between having data and having intelligence is the difference between a passive historian and an AI that knows exactly what to look for, and that difference is the entire ROI case for making the transition. Book a demo
Frequently Asked Questions: Power Plant Analytics Strategy
The first step is a data readiness assessment that maps your existing instrumentation, historian infrastructure, and data quality against the requirements for AI-driven predictive analytics. Most power plants already have sufficient DCS, SCADA, and vibration data to begin predictive modeling. The assessment identifies which data streams are immediately usable, which require cleaning or normalization, and where additional sensor coverage would deliver the highest ROI. iFactory offers this assessment at no cost and typically completes it within two weeks of site access.
At minimum, iFactory requires access to the plant's process data historian or DCS archive containing key operating parameters such as temperatures, pressures, vibration levels, and equipment status signals. This is sufficient to begin training predictive models on most generation assets. For full capability deployment, integration with the CMMS for maintenance history, LIMS for oil analysis data, and emissions monitoring system for compliance data provides the richest analytics environment.
iFactory's power generation clients typically achieve full payback within 9 to 14 months of deployment. The fastest ROI cases occur in the first 90 days when the AI identifies a high-frequency failure mode that was previously undetected, enabling corrective action before a major forced outage.
Yes, and that is the recommended deployment approach. iFactory complements existing CMMS and EAM platforms by providing the predictive intelligence layer that those systems lack. Predictive alerts generated by iFactory can create work orders in your existing CMMS, and maintenance completion data flows back to iFactory for continuous model improvement. This coexistence approach allows organizations to preserve their investment in existing maintenance management systems while adding AI-powered predictive capability without disruption to established workflows.
iFactory's compliance analytics module continuously monitors emissions against regulatory limits and automatically generates audit-ready compliance reports in the format required by EPA, NERC, and regional regulatory bodies. The platform maintains an immutable record of all emissions data, equipment operating conditions, and compliance actions, providing the documentation trail required for regulatory audits without manual data assembly. This automated compliance capability typically reduces the labor hours required for quarterly and annual reporting by 60 to 80 percent Book a demo.
Conclusion: The Analytics Strategy Your Power Generation Fleet Deserves
The gap between a reactive power plant and a predictive one is not a gap in equipment quality, workforce capability, or data availability. It is a gap in analytics strategy. The sensors, historians, and control systems that most power plants already have in place generate the data needed for AI-driven predictive analytics.