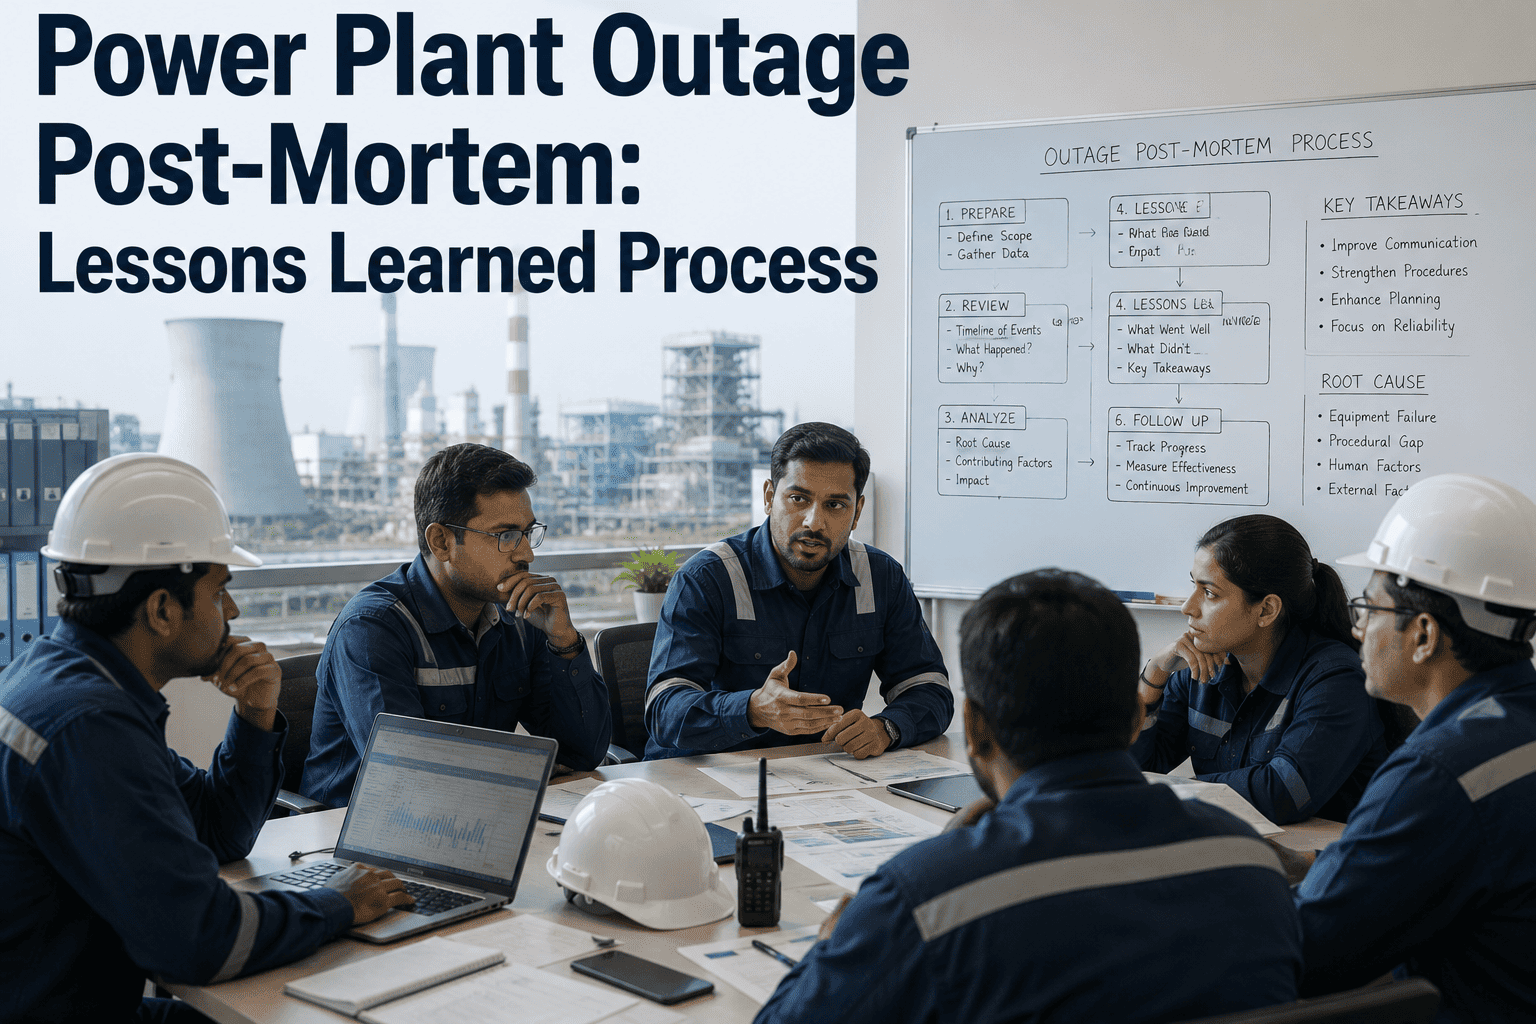
Every planned outage generates thousands of data points: schedule variances against the critical path, scope additions discovered once components are opened, cost overruns against contingency budgets, and near-miss or incident reports from the field. In most power plants this information disappears into scattered outage reports, individual engineers' notebooks, and closeout meetings that few people attend. The next outage planning cycle starts from a blank page instead of building on what was learned, and the same root causes resurface cycle after cycle. Operations directors know the pattern repeats because nobody systematically mines the data their own outages already produced. See how AI-driven post-outage analysis changes that by requesting a Book a Demo with the iFactory AI team.
Turn Every Outage Into a Data Asset the Next One Can Build On
iFactory AI mines schedule adherence data, scope addition records, cost overruns, and safety incident reports from every outage, converting scattered closeout paperwork into a searchable, benchmarked lessons-learned database that reduces repeat problems in every subsequent cycle.
Where Outage Intelligence Gets Lost
Outage closeout is usually the least resourced phase of the entire shutdown. Crews are demobilizing, the unit is ramping back to load, and the reliability team has already shifted attention to the next planning window. Whatever gets written down tends to be brief, inconsistent between outages, and stored in a location nobody revisits until the same problem happens again. The cost of that gap shows up directly in the next cycle's schedule, budget, and safety performance.
Scope discovered mid-shutdown is frequently a repeat of an issue found in a prior outage that was never logged in a form the next planning team could search or reference.
Without a structured root cause history, contingency funds absorb the same category of cost overrun outage after outage instead of shrinking as institutional knowledge grows.
Engineers spend critical path days re-investigating failure modes that a previous outage team already root-caused, simply because the finding was never captured searchably.
Action items generated in closeout meetings routinely lose ownership and tracking well before the next outage begins, so recommendations never reach implementation.
The Four Data Streams Every Outage Generates
Regardless of unit type, every planned outage produces the same four categories of raw data. Individually each stream tells a partial story. Correlated together across many outage cycles, they reveal the patterns that separate a well-run shutdown program from one stuck repeating its own mistakes.
Schedule Adherence Data
Planned versus actual duration for every work order, critical path slippage points, and the specific activities that consistently run long across multiple outages on the same unit or fleet.
Scope Addition Records
Emergent work discovered once equipment is opened, including which components, systems, and inspection findings most frequently generate unplanned scope beyond the original work list.
Cost and Contingency Data
Budget-to-actual variance by work category, contingency drawdown timing, and whether overruns trace back to labor, materials, contractor rates, or scope growth already flagged elsewhere.
Safety and Incident Reports
Near-misses, first aid cases, LOTO violations, and confined space entry deviations, tracked against the work activity, contractor crew, and shift during which they occurred.
From Raw Outage Data to Institutional Knowledge
Turning four disconnected data streams into usable institutional knowledge requires a structured analysis sequence, not a single dashboard refresh. Each stage below adds interpretation, moving the output from raw records toward a recommendation an operations director can act on before the next outage is even scoped.
Multi-Source Data Ingestion
Schedule software exports, cost tracking systems, CMMS work orders, and safety incident logs are pulled into a common outage record, normalized against unit, outage number, and date regardless of which system originally captured them.
Root Cause Tagging and Classification
Natural language processing scans closeout notes, inspection reports, and incident narratives to tag each entry with a standardized root cause category, replacing free-text notes that were previously unsearchable across outages.
Cross-Outage Pattern Correlation
The system compares tagged findings against every prior outage on the same unit and across the fleet, surfacing recurring failure modes, chronic schedule offenders, and contractor crews associated with repeat cost or safety issues.
Benchmark and Variance Scoring
Each outage is scored against fleet benchmarks for duration, cost, and scope growth, isolating which variances are unit-specific anomalies and which reflect a systemic issue worth addressing at the program level.
Actionable Recommendation Generation
Findings are converted into ranked recommendations for the next outage plan, each linked to the historical evidence that supports it, so planning teams start from documented precedent rather than memory. Engineers can Book a Demo to see this applied to a recent outage record.
Outage Performance Issue Reference Matrix
The table below maps the issue categories most operations directors encounter in post-outage reviews to their typical root cause, the data signal that reveals them, and how AI-driven analysis surfaces each one early enough to act on for the next cycle.
| Issue Category | Typical Root Cause | Data Signal | Business Impact | AI Detection Method |
|---|---|---|---|---|
| Schedule Slippage | Underestimated activity duration | Planned vs actual variance by task | Extended outage, lost generation | Cross-outage duration benchmarking |
| Scope Growth | Inspection finding not pre-scoped | Emergent work order volume | Schedule and cost overrun | Component-level scope pattern mining |
| Cost Overrun | Contingency absorbed by repeat issue | Budget variance by work category | Reduced program funding headroom | Root cause to cost-category correlation |
| Safety Near-Miss | Procedure deviation under time pressure | Incident report narrative tags | Elevated injury risk | NLP classification of incident text |
| Repeat Failure Mode | Finding not tracked to closure | Matching root cause across cycles | Recurring downtime exposure | Fleet-wide pattern correlation engine |
| Contractor Performance Gap | Crew-specific rework or delay pattern | Work order duration by crew | Vendor selection risk | Crew-level benchmark scoring |
Before AI vs After AI: The Outage Closeout Cycle
The difference between a closeout meeting that produces a filed report and one that produces usable institutional knowledge comes down to whether the data is structured and searchable. The comparison below reflects a typical closeout cycle for a mid-size unit.
Without AI Analysis
Closeout MeetingFindings are discussed verbally, captured in a slide deck, and filed in a shared drive folder that the next planning team rarely opens.
Report FilingRoot causes are written in free text with no standardized categories, making them impossible to search or compare against prior outages.
Next Outage PlanningPlanners rely on individual memory and whoever happens to still be on staff from the last cycle to recall what went wrong.
Institutional MemoryKnowledge walks out the door with staff turnover, and each new operations director effectively restarts the learning curve.
With AI Analysis
Closeout ReviewFindings are automatically tagged, categorized, and added to a searchable outage history the moment closeout data is entered.
Structured RecordRoot causes are standardized against a common taxonomy, letting any outage be compared against any other in seconds.
Next Outage PlanningPlanners open a ranked list of prior findings relevant to the upcoming scope before the planning meeting even starts.
Institutional MemoryKnowledge persists in the system regardless of staff turnover, compounding in value with every additional outage cycle.
Quantified Impact on Outage Performance
The metrics below reflect aggregated results from power plants that have deployed AI-driven post-outage analysis, measured against their own historical baselines across multiple outage cycles.
Implementation Checklist for Post-Outage AI Analysis
Standing up a post-outage analysis program requires consolidating historical records, building a shared taxonomy, and integrating findings into the planning process for the next cycle. The checklist below outlines the core steps.
Audit Existing Outage Documentation
Inventory closeout reports, schedule exports, cost variance sheets, and incident logs from the last several outage cycles to establish what historical data already exists.
Consolidate Historical Records
Migrate scattered outage records from shared drives and individual spreadsheets into a single structured system that supports search across all past cycles.
Build a Root Cause Taxonomy
Define a standardized set of root cause categories for schedule, scope, cost, and safety findings so future entries are comparable across outages and units.
Train Classification Models
Use tagged historical data to train models that automatically classify new closeout narratives against the established taxonomy with minimal manual review.
Integrate With Outage Planning Software
Connect the lessons-learned database directly to the tools used for scoping the next outage so relevant findings surface automatically during planning.
Establish a Review Cadence
Set a recurring cross-functional review of fleet-wide patterns so recommendations are assigned owners and tracked to closure before the next outage begins.
Post-Outage AI Analysis — FAQs for Operations Directors
How is this different from the closeout report we already produce after every outage?
A closeout report is a static document written for a single audience at a single point in time, and it typically stops being referenced once it is filed. AI-driven analysis treats the same underlying data as a living, searchable record that gets compared against every other outage in the fleet automatically. Instead of a planner having to remember which report covered a similar finding, the system surfaces relevant history the moment a new outage is being scoped. For a walkthrough against your existing closeout process, Book a Demo with our team.
Can this work with the historical outage data we already have in spreadsheets and PDFs?
Yes, most plants have several outage cycles of historical data sitting in spreadsheets, scanned PDFs, and shared drive folders, and this is typically the starting point rather than a barrier. The ingestion process extracts schedule, cost, and narrative data from these existing formats and normalizes it into a structured record. The more historical cycles available, the stronger the pattern detection becomes, though the system begins generating value from the very first newly analyzed outage.
How does the system handle root cause narratives that are written differently by different engineers?
Natural language processing is specifically suited to this problem because it classifies the underlying meaning of a narrative rather than requiring exact wording. Two engineers describing the same bearing failure in different phrasing are both tagged into the same standardized root cause category. Confidence scores are attached to each classification, and low-confidence entries are flagged for a quick manual review rather than being silently misclassified.
Does this replace the outage closeout meeting or just feed into it?
It is designed to make the closeout meeting more productive rather than replace it. Instead of the meeting being spent reconstructing what happened from memory and scattered notes, the team walks in with a structured summary of schedule variance, scope growth, cost impact, and safety findings already compiled and benchmarked. The discussion shifts from data gathering to decision making about which recommendations to prioritize for the next cycle. Support for meeting preparation is available through iFactory Support.
How quickly can we see results after our first outage using this system?
Initial value appears immediately after the first outage's closeout data is ingested, since even a single structured record is easier to search than a scattered one. The larger benefit compounds after the second and third analyzed outages, when cross-outage pattern correlation begins surfacing recurring root causes and benchmark variances that were previously invisible. Most operations teams report measurable planning improvements by their second full outage cycle using the system.
Make Your Next Outage Smarter Than the Last One
Connect with iFactory AI to map your outage data sources, build a structured lessons-learned database from your historical records, and give your planning team a documented head start on the next shutdown.


.png)