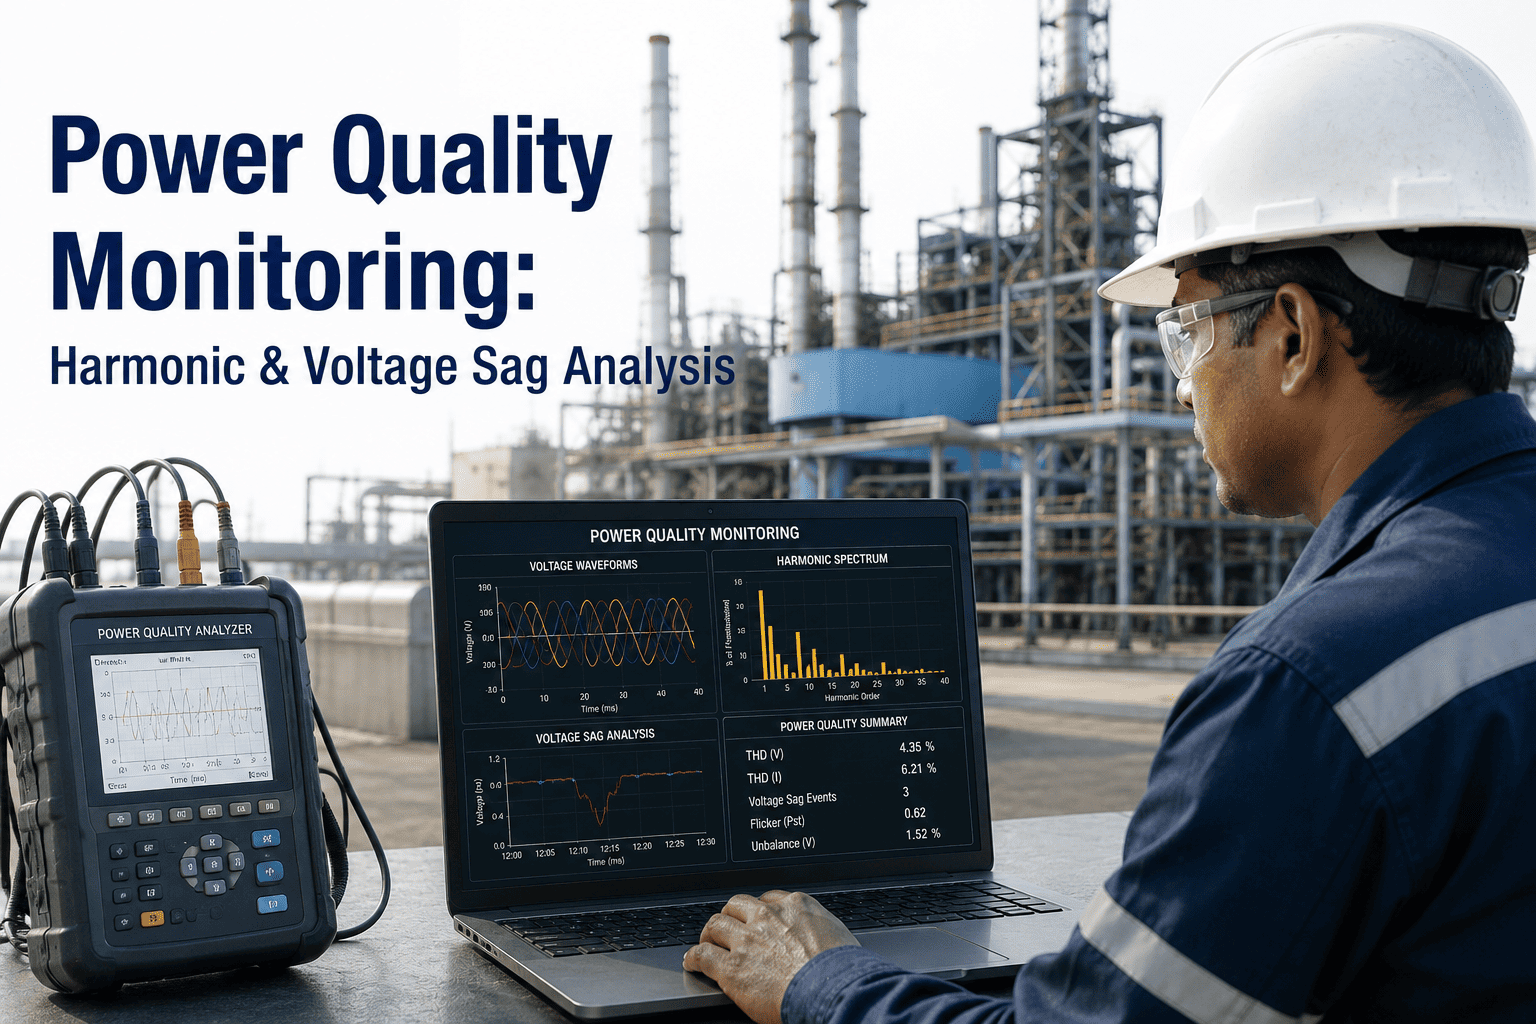
Power quality monitoring at power plant auxiliary systems is the process of continuously measuring voltage and current waveforms to detect deviations from the ideal sinusoidal supply that can damage transformers, motors, drives, and protective relays. Harmonic distortion caused by variable frequency drives and rectifier loads introduces high-frequency components that increase heating in electrical equipment beyond what the fundamental current alone would produce. Voltage sags, which are short-duration reductions in RMS voltage lasting from half a cycle to one minute, are the most frequent and economically significant power quality events in industrial facilities, often triggering unplanned shutdowns of sensitive control systems. Understanding these disturbances, quantifying their severity against IEEE 519 and IEC 61000 standards, and correlating them with equipment behavior is the foundation of an effective power quality management program. Teams that want to move from reactive troubleshooting to systematic PQ monitoring can Book a Demo to see how iFactory captures and analyzes power quality data across auxiliary systems.
Your Auxiliary Systems Are Degrading Every Time a VFD Starts.
iFactory monitors power quality across your auxiliary bus, captures harmonic distortion and voltage sag events, and flags equipment at risk before a failure occurs.
The State of Power Quality in Industrial Auxiliary Systems
Power quality is not an abstract electrical engineering concept. It is a direct measure of whether the electricity arriving at your motor terminals, drive inputs, and relay coils has the waveform characteristics that the equipment was designed to operate with. When the waveform deviates from the expected sinusoidal shape at the correct voltage and frequency, equipment heats up, misoperates, or trips. The statistics below represent the typical conditions found in power plant and industrial auxiliary systems where nonlinear loads have been added over years without systematic power quality assessment. Each metric represents a specific failure mode that, when left unmonitored, progresses from invisible degradation to forced outage.
IEEE 519 maximum allowable total harmonic distortion voltage at the point of common coupling for buses below 69 kV. Exceeding this limit causes transformer overheating and relay misoperation.
Average number of voltage sag events experienced annually by industrial facilities with overhead line supply. Each sag below 0.7 per unit can trip sensitive drives and control systems.
Estimated cost of a single unplanned shutdown caused by a voltage sag in a power generation or process facility, including lost production, restart labor, and potential equipment damage.
The fifth and seventh harmonic orders are the dominant distortion components produced by six-pulse variable frequency drives, which are the most common nonlinear loads in auxiliary power systems.
Six Categories of Power Quality Disturbances That Affect Auxiliary Systems
Power quality disturbances are classified into six fundamental categories by IEEE Std 1159. Each category encompasses a range of specific events with different root causes, different waveform signatures, and different effects on equipment. A monitoring system that only tracks voltage sags but ignores harmonics, or only measures harmonics but misses transients, will leave the facility exposed to the undetected disturbance type. Understanding all six categories is essential for specifying a monitoring system that provides complete coverage of the power quality threats present in a power plant auxiliary system.
Transients
Duration: nanoseconds to millisecondsImpulsive transients from lightning strikes and switching operations, and oscillatory transients from capacitor bank energization and load switching. Impulsive transients have a fast rise time and rapid decay, while oscillatory transients include a decaying oscillation at frequencies ranging from hundreds of hertz to megahertz. Both can damage insulation, cause electronic equipment reset, and degrade solid-state components over time. Capturing transients requires high-speed waveform recording with sampling rates above 100 kilosamples per second.
Short-Duration Variations
Duration: 0.5 cycle to 1 minuteIncludes voltage sags (0.1 to 0.9 per unit), voltage swells (1.1 to 1.8 per unit), and momentary interruptions (below 0.1 per unit). Sags are the most economically significant power quality event in industrial facilities, caused by fault clearing on adjacent feeders, motor starting, and transformer energization. Swells are less common but can damage equipment designed for nominal voltage. These events are characterized by their magnitude, duration, and phase angle shift, all of which must be captured to assess equipment vulnerability.
Long-Duration Variations
Duration: greater than 1 minuteSustained undervoltage, overvoltage, and sustained interruptions that last longer than one minute. These are typically caused by load scheduling changes, tap changer malfunction, capacitor bank switching errors, or permanent faults. Unlike short-duration events, long-duration variations are steady-state conditions that persist long enough for thermal effects to accumulate in equipment. Transformers operating in sustained undervoltage conditions draw higher current to deliver the same load power, increasing winding heating and accelerating insulation aging beyond what the original thermal design accounted for.
Voltage Unbalance
Measured as percentage of negative-sequence voltageA condition where the three phase voltages are not equal in magnitude or are not separated by exactly 120 degrees. Caused by unbalanced single-phase loading, open-phase conditions, or untransposed transmission lines. Voltage unbalance causes negative-sequence current to flow in three-phase motors, producing a reverse-rotating magnetic field that increases rotor heating dramatically. A voltage unbalance of just 2% can cause motor temperature rise of 15 to 20 degrees Celsius above the balanced condition, reducing motor insulation life by approximately half for every 10 degree increase.
Waveform Distortion
Continuous steady-state deviation from sinusoidal shapeEncompasses harmonic distortion, interharmonic distortion, DC offset, and notching. Harmonics are integer multiples of the fundamental frequency caused by nonlinear loads such as variable frequency drives, rectifiers, and arc furnaces. Interharmonics are non-integer frequency components produced by cycloconverters and some types of welding equipment. DC offset can occur in rectifier circuits and transformer inrush conditions. Notching is the periodic removal of a portion of the waveform by commutation of power electronic devices. Each distortion type has distinct measurement requirements and different effects on equipment.
Voltage Fluctuation and Flicker
Frequency: 0.5 to 30 Hz variationRapid, repetitive changes in voltage magnitude that cause visible flicker in lighting and can affect sensitive electronic processes. Caused by rapidly varying loads such as arc furnaces, electric welders, and motor drives with fluctuating torque requirements. Measured using the IEC flicker severity index (Pst for short-term, Plt for long-term), voltage fluctuation is a power quality concern that primarily affects human perception and process control accuracy rather than causing immediate equipment damage, though repeated thermal cycling from voltage fluctuations can accelerate connector and contact degradation.
Harmonic Distortion: Measuring What VFDs and Rectifiers Inject Into Your Auxiliary Bus
Harmonic distortion is the most pervasive power quality problem in modern auxiliary power systems because the solution to one problem, energy-efficient variable speed control, creates a different problem in the form of current harmonics injected back into the supply. A six-pulse variable frequency drive draws current in pulses rather than continuously, creating significant fifth and seventh harmonic currents that flow through the source impedance of the auxiliary transformer and produce harmonic voltage distortion at the bus. The chart below shows a typical harmonic profile measured at the auxiliary bus of a facility with multiple VFD installations, compared against the IEEE 519 individual harmonic voltage limits. Any harmonic order exceeding the red limit line represents a non-compliant condition that requires mitigation through harmonic filtering or drive configuration changes.
The total harmonic distortion voltage of 6.1% exceeds the IEEE 519 limit of 5.0%, driven primarily by the fifth and seventh harmonic contributions from six-pulse VFDs. This condition causes additional heating in the auxiliary transformer, increases losses in cable runs and bus duct, and can cause misoperation of voltage-sensitive protective relays that rely on zero-crossing detection or peak voltage measurement. Facilities that measure harmonics only during commissioning and never again have no way to know whether the harmonic profile has changed as loads have been added or modified. Continuous harmonic monitoring with trend analysis is the only way to detect gradual deterioration toward the compliance limit before it is exceeded. Book a Demo to see how iFactory tracks harmonic trends and alerts your team before limits are breached.
Voltage Sag Anatomy: What Happens in Milliseconds That Costs Thousands in Downtime
A voltage sag is a short-duration reduction in RMS voltage that typically lasts between half a cycle and one minute. The visualization below represents the voltage profile of a typical sag event caused by a fault on an adjacent feeder, showing how the voltage drops rapidly at the point of fault initiation, reaches a minimum value during the fault, and recovers when the protective device clears the fault. The entire event from initiation to full recovery may take only 6 to 15 cycles, which is 100 to 250 milliseconds at 60 Hz. In that brief window, variable frequency drives may trip on undervoltage, PLCs may reset, and contactors may drop out, causing a cascading shutdown of the auxiliary system even though the voltage at the affected bus never reached zero.
The severity of a voltage sag is characterized by two parameters: the residual voltage, which is the minimum RMS voltage during the event, and the duration, which is the time from the point where voltage drops below 0.9 per unit to the point where it returns above 0.9 per unit. These two parameters are plotted against equipment sensitivity curves, most commonly the ITIC curve, to determine whether a given sag event will cause equipment to trip. A sag to 0.35 per unit for 150 milliseconds falls well below the ITIC curve for most electronic equipment, meaning virtually all unprotected drives, PLCs, and computers on that bus will trip. The economic impact is not proportional to the depth of the sag but is instead a binary outcome: either the equipment rides through or it does not, and if it does not, the facility experiences a full or partial shutdown.
The root causes of voltage sags in power plant auxiliary systems include remote fault clearing on the utility supply, motor starting currents that depress the bus voltage, transformer energization inrush, and faults on adjacent plant buses that share the same supply transformer. Each cause produces a sag with a different characteristic signature in terms of magnitude, duration, and phase angle jump. A monitoring system that captures the full waveform during sag events enables root cause identification, which is the prerequisite for selecting the correct mitigation strategy, whether that is installing dynamic voltage restorers, adding ride-through capability to drives, or adjusting protective relay timing to reduce the sag duration experienced on adjacent buses.
How Each Disturbance Type Affects Specific Equipment in Your Auxiliary System
Different types of equipment in the auxiliary power system have different sensitivities to different power quality disturbances. A variable frequency drive may be highly susceptible to voltage sags but relatively tolerant of harmonic distortion in the supply voltage, while a transformer may be unaffected by sags but severely impacted by harmonic loading. The matrix below maps the susceptibility of common auxiliary system equipment against the five most relevant disturbance categories, using a severity scale from Low to Very High. This matrix is the starting point for prioritizing which power quality parameters to monitor at each bus in the system, based on what equipment is connected and what disturbances would cause the most consequential failure.
| Equipment Type | Voltage Sag | Harmonics | Voltage Swell | Transient | Flicker |
|---|---|---|---|---|---|
| Variable Frequency Drive | High | Very High | Medium | High | Low |
| PLC / DCS Controller | Very High | Low | High | Very High | Low |
| Auxiliary Transformer | Low | High | Low | Medium | Low |
| AC Induction Motor | Medium | Medium | Low | Medium | Low |
| UPS System | Low | High | Medium | High | Low |
| Protective Relay | High | Medium | Medium | Very High | Low |
| LED Lighting System | Medium | Medium | High | High | Very High |
The matrix reveals that no single disturbance type is the universal threat. Variable frequency drives are most vulnerable to harmonics because the DC bus capacitor and input rectifier are sensitive to peak voltage distortion, while PLCs and DCS controllers are most vulnerable to voltage sags and transients because their internal power supplies have limited energy storage and cannot ride through even brief voltage interruptions. Protective relays, which are the last line of defense for the electrical system, are themselves vulnerable to transients that can cause false tripping or failure to trip when needed. This creates a paradox where the protection system designed to safeguard the facility can be compromised by the same power quality disturbances it is supposed to be immune to. A comprehensive monitoring program must account for the specific vulnerability profile of each piece of critical equipment on each bus.
IEEE 519 Harmonic Limits at the Point of Common Coupling
IEEE Std 519 establishes the harmonic voltage and current distortion limits that apply at the point of common coupling between the facility and the utility, or between major subsystems within a facility. The limits are tiered by voltage level because higher voltage buses have lower source impedance relative to the harmonic currents, which naturally results in lower voltage distortion for the same current injection. The table below shows the voltage distortion limits by bus voltage level. Facilities must measure harmonic distortion at their PCC and demonstrate compliance with these limits as a condition of their interconnection agreement with the utility. Internal buses that do not constitute a PCC are not directly subject to IEEE 519 limits, but the same limits are commonly applied as internal design targets because equipment connected to those buses has the same harmonic sensitivity regardless of whether the bus is a formal PCC.
| Bus Voltage at PCC | THD-V Limit | Individual Harmonic Limit | Typical Auxiliary Application |
|---|---|---|---|
| Below 1 kV | 5.0% | 3.0% | Motor control centers, lighting panels, instrument power |
| 1 kV to 69 kV | 5.0% | 3.0% | Plant auxiliary bus at 4.16 kV or 6.9 kV, unit station service |
| 69 kV to 161 kV | 2.5% | 1.5% | High-side auxiliary supply, plant tie to utility grid |
| Above 161 kV | 1.5% | 1.0% | Transmission-level interconnection, generator step-up bus |
For current distortion, IEEE 519 uses a different approach based on the ratio of available short-circuit current to maximum load current at the PCC. A higher short-circuit ratio means the utility source is stiffer and can absorb more harmonic current without excessive voltage distortion, so the current limits are more lenient. The TDD, or total demand distortion, limit for current harmonics ranges from 5% for a stiff system with Isc/IL greater than 1000, up to 15% or more for a weak system with Isc/IL below 20. This means that the same VFD installation can be compliant at one facility and non-compliant at another, depending entirely on the strength of the supply at the PCC. Measuring both voltage and current harmonics simultaneously, along with the short-circuit ratio, is necessary for a complete IEEE 519 compliance assessment. iFactory captures all of these parameters in a single monitoring workflow, so your team always knows where you stand relative to the applicable limits. Contact iFactory Support to learn how the platform handles IEEE 519 compliance tracking.
You Cannot Fix What You Cannot Measure on Your Auxiliary Bus.
iFactory connects to your PQ meters, captures harmonic and sag data in real time, and gives your engineering team a live view of power quality compliance across every monitored bus.
Five Layers of a Power Quality Monitoring System for Auxiliary Networks
A power quality monitoring system is not a single instrument. It is a layered architecture where each layer performs a specific function, from sensing the voltage and current waveforms at the measurement point to presenting actionable information to the engineer who must decide what to do about a detected problem. A weakness in any single layer, whether it is insufficient sampling rate at the sensing layer or inadequate event classification at the analysis layer, degrades the value of the entire system. The five layers described below represent the complete architecture required for effective power quality monitoring at a power plant auxiliary system.
Sensing and Instrumentation Layer
Consists of the current transformers, voltage transformers or potential dividers, and the power quality meters installed at each monitoring point. The CTs and VTs must have sufficient bandwidth to accurately reproduce the harmonic frequencies being measured, which typically requires Class 0.2S metering accuracy up to at least the 50th harmonic, or 3 kHz at 60 Hz fundamental. The PQ meter must support continuous waveform recording at a minimum of 256 samples per cycle for harmonic analysis per IEC 61000-4-30 Class A, and high-speed transient capture at rates above 100 kilosamples per second. The location of each meter must be selected to measure at the PCC for IEEE 519 compliance and at individual bus sections where critical equipment is connected for equipment-level sag sensitivity assessment.
Data Acquisition and Storage Layer
Handles the sampling, digitization, and local storage of waveform data, RMS trend data, and event records. Modern PQ meters perform the acquisition function internally, but the system architecture must account for how much data is stored locally versus streamed to a central server. Continuous waveform recording at high resolution generates enormous data volumes that cannot be streamed continuously over typical plant networks. The acquisition layer must implement intelligent triggering that stores full waveforms only when a disturbance is detected, while logging RMS trends and harmonic snapshots at regular intervals, typically every 10 minutes, for long-term trending. The storage layer must retain event waveforms for at least 30 days and trend data for a minimum of one year to support seasonal analysis and correlation with operating mode changes.
Communication and Integration Layer
Transfers data from the meters to the central analysis platform using industrial communication protocols. Common protocols for PQ monitoring include Modbus TCP for polling RMS and harmonic data, IEC 61850 for substation-grade metering with event reporting via GOOSE messages, and proprietary protocols from meter manufacturers for full waveform transfer. The communication architecture must be designed to handle the data volume without congesting the plant network, which typically means using a dedicated VLAN for PQ monitoring traffic or installing a separate network switch for the metering infrastructure. Integration with the plant DCS or SCADA system allows PQ alarms to be displayed alongside process alarms, giving operators a unified view of both process and electrical disturbances.
Analysis and Classification Engine
Processes the raw waveform and event data to extract meaningful information. This layer performs Fast Fourier Transform analysis on captured waveforms to decompose the signal into its harmonic components, calculates RMS voltage and current trends with half-cycle resolution for sag and swell detection, classifies each detected event by type using the IEEE 1159 taxonomy, and computes severity metrics against IEEE 519 limits, ITIC curve thresholds, and facility-specific alarm setpoints. The analysis engine must handle overlapping events correctly, such as a harmonic resonance that is triggered by a voltage sag, and must maintain event correlation across multiple meters to distinguish between a system-wide disturbance and a localized condition that affects only one bus.
Reporting and Action Layer
Presents the analyzed data to engineers and managers in formats that support decision-making. This includes real-time dashboards showing current PQ status at each monitored bus, trend charts showing harmonic distortion and power factor over time, sag count and severity distributions that identify the most problematic circuits, and automated compliance reports that document IEEE 519 performance for utility or regulatory submission. The critical function of this layer is converting the enormous volume of PQ data into a small number of actionable items: which buses are non-compliant, which equipment is at risk, and what mitigation action should be taken first. Without this translation from data to action, PQ monitoring becomes a data collection exercise that generates reports but never prevents failures.
Critical PQ Metrics That Define Auxiliary System Electrical Health
Monitoring power quality without defining the specific metrics that matter for your equipment and your standards compliance is equivalent to installing temperature sensors without setting alarm thresholds. The six metrics below represent the core set of power quality parameters that every auxiliary system monitoring program should track, along with the typical ranges that indicate healthy operation and the threshold values that require engineering attention. These metrics are not theoretical; each one directly correlates with a specific failure mode or compliance obligation that has real consequences for plant reliability and regulatory standing.
THD-V
0% to 5.0% Alarm above 4.5%Total harmonic distortion of the voltage waveform. Indicates the cumulative effect of all harmonic currents flowing through the source impedance. Rising THD-V trends signal increasing harmonic loading, often from new VFD installations or changes in operating configuration.
THD-I
0% to 20% Alarm above 15%Total harmonic distortion of the current waveform. Higher than voltage THD because current distortion is the source that causes voltage distortion through impedance. Used to calculate the TDD metric required for IEEE 519 current compliance assessment at the PCC.
Power Factor
0.85 to 1.00 Alarm below 0.90True power factor including the effect of harmonic distortion, not just the displacement power factor from fundamental frequency phase angle. Harmonics reduce true power factor below the displacement value, which means a facility can have a good displacement PF but still pay utility penalties for poor true PF.
Voltage Unbalance
0% to 2.0% Alarm above 1.5%Negative-sequence voltage as a percentage of positive-sequence voltage. Exceeding 2% derates motors and causes excessive heating in the rotor. NEMA requires motors to derate linearly for unbalance above 1%, with a recommended maximum operating unbalance of 1% for continuous duty applications.
Sag Events Per Month
0 to 5 Alarm above 3 below 0.7 puCount of voltage sag events where the residual voltage drops below 0.7 per unit, which is the approximate sensitivity threshold for most variable frequency drives without ride-through capability. Tracking this count over time reveals whether the sag frequency is stable, increasing, or seasonal.
Crest Factor
1.0 to 1.5 Alarm above 1.45Ratio of peak voltage to RMS voltage. A pure sine wave has a crest factor of 1.414. Higher crest factors indicate the presence of peaked waveforms from notching or transient superposition, while lower crest factors indicate flat-topped waveforms from rectifier loading that reduce peak voltage below the expected value.
From Raw Waveform to Root Cause: How PQ Data Becomes a Maintenance Decision
Collecting power quality data is not the objective. The objective is converting that data into specific maintenance or engineering actions that improve plant reliability. The process below describes the analytical pipeline that transforms a raw voltage and current waveform captured during a disturbance event into a documented root cause and a prioritized corrective action. Each step in the pipeline adds value by reducing the raw data volume and increasing the information density, so that by the time the result reaches the engineering team, it is a clear recommendation rather than a dataset that requires hours of manual analysis to interpret.
Waveform Capture
The PQ meter detects a disturbance trigger, captures the voltage and current waveforms at high sampling rate, and stores the event record with timestamp, channel identification, and pre-event baseline data for comparison.
Spectral Decomposition
Fast Fourier Transform analysis breaks the captured waveform into its frequency components, quantifying the magnitude and phase angle of each harmonic order to identify which harmonic frequencies are present and at what levels relative to the fundamental.
Event Classification
The disturbance is classified by type using IEEE 1159 criteria based on magnitude, duration, and frequency content. A sag to 0.65 pu for 8 cycles is categorized differently from a transient with a 2 microsecond rise time and 50 microsecond decay.
Severity Assessment
The classified event is compared against IEEE 519 limits for harmonics, ITIC curve thresholds for sags, and facility-specific alarm setpoints to determine whether the event is within acceptable limits or represents a condition requiring attention.
Root Cause Correlation
The event is correlated with plant operating data, including which loads were running, what switching operations occurred, and what fault records exist from the protection system, to identify the specific cause of the disturbance.
The value of this pipeline is that it converts a raw waveform, which is meaningless to anyone without specialized training in signal processing, into a structured finding that any electrical engineer can act on. Without this pipeline, PQ monitoring produces event logs that accumulate in a database and are only examined after a failure has already occurred, at which point the data is used for forensic analysis rather than prevention. The entire business case for investing in PQ monitoring infrastructure depends on whether the data reaches the engineering team in a form that enables preventive action. iFactory automates this entire pipeline from waveform capture through root cause correlation, so your engineers receive prioritized findings instead of raw event logs. Book a Demo to see the analysis pipeline in action.
Power Quality Monitoring at Auxiliary Systems — Common Questions
What is the difference between THD-V and THD-I and why do both matter?
THD-V measures the distortion present in the voltage waveform at the bus, while THD-I measures the distortion in the current waveform drawn by the connected loads. THD-I is always higher than THD-V because the current distortion is the cause and the voltage distortion is the effect, with the voltage distortion being reduced by the impedance between the load and the source. Both matter because THD-I determines the heating effect in cables, transformers, and bus duct that carry the distorted current, while THD-V determines whether other equipment connected to the same bus receives a distorted voltage supply. IEEE 519 regulates both: voltage distortion limits apply universally at each voltage level, while current distortion limits depend on the short-circuit ratio at the PCC. Book a Demo to see how iFactory tracks both metrics simultaneously with trend analysis.
How many PQ meters does a typical power plant auxiliary system need?
The number of meters depends on the bus configuration and the criticality of the connected loads, but a typical installation requires meters at the main auxiliary bus for IEEE 519 compliance measurement, at each downstream bus that supplies VFDs or other significant nonlinear loads for harmonic tracking, and at buses supplying critical control systems for sag sensitivity monitoring. A medium-sized plant with a 4.16 kV auxiliary bus, two 480V load centers, and a 120V instrument bus typically requires four to six meters to achieve complete coverage. Installing meters only at the main bus misses the harmonic contribution and sag exposure of individual load centers, while installing a meter at every panel is unnecessary and generates more data than the engineering team can effectively use. The iFactory Support team can help determine the optimal meter placement for your specific auxiliary system configuration.
Can power quality monitoring prevent equipment failures or only diagnose them after they occur?
Power quality monitoring prevents failures when the data is analyzed continuously for trending conditions rather than only examined after a failure. Harmonic distortion that is trending upward over months, voltage unbalance that increases as single-phase loads are added to a bus, and sag frequency that correlates with specific operating modes are all examples of degradation patterns that can be detected and mitigated before they cause equipment damage. The key is setting alarm thresholds below the failure point, so that the engineering team receives a warning when THD-V reaches 4% rather than waiting until it exceeds 5% and a transformer trips on overtemperature. This requires a monitoring platform that performs continuous trend analysis and threshold comparison, not one that simply logs events for later review.
What is the ITIC curve and how is it used in voltage sag assessment?
The ITIC curve, published by the Information Technology Industry Council, defines the voltage tolerance envelope for most types of electronic equipment. It plots voltage magnitude on the vertical axis against event duration on the horizontal axis, with a no-damage region above and to the left of the curve and a damage or malfunction region below and to the right. For voltage sags, the relevant portion of the curve shows that equipment can tolerate sags to 0% voltage for up to 1 millisecond, sags to 70% voltage for up to 30 cycles, and sags to 80% voltage for up to 10 seconds, with progressively shallower sags tolerated for longer durations. By plotting each measured sag event on the ITIC curve, the monitoring system can immediately determine whether the event was severe enough to have tripped sensitive equipment, without needing to test each device individually after every event.
What is harmonic resonance and why is it more dangerous than the original harmonic source?
Harmonic resonance occurs when the inductive reactance of the system impedance and the capacitive reactance of power factor correction capacitors are equal at a specific harmonic frequency, creating a parallel resonance condition that amplifies the harmonic voltage at that frequency far above what the harmonic current source alone would produce. A facility with fifth harmonic current injection of 20 amps from VFDs might experience fifth harmonic voltage distortion within IEEE 519 limits under normal conditions, but when power factor correction capacitors are switched in and create a resonance near the 300 Hz fifth harmonic, the same 20 amps of harmonic current can produce voltage distortion ten to twenty times higher than the non-resonant condition. This is why harmonic studies must be performed whenever capacitor banks are added to a system with significant nonlinear loads, and why continuous PQ monitoring is essential to detect resonance conditions that may not have been predicted in the original study. Book a Demo to learn how iFactory detects resonance conditions through harmonic trend monitoring.
Stop Discovering Power Quality Problems After the Equipment Has Already Tripped.
Talk to iFactory about building a power quality monitoring program where every harmonic trend, every sag event, and every compliance metric is captured, analyzed, and acted on before it causes a shutdown.