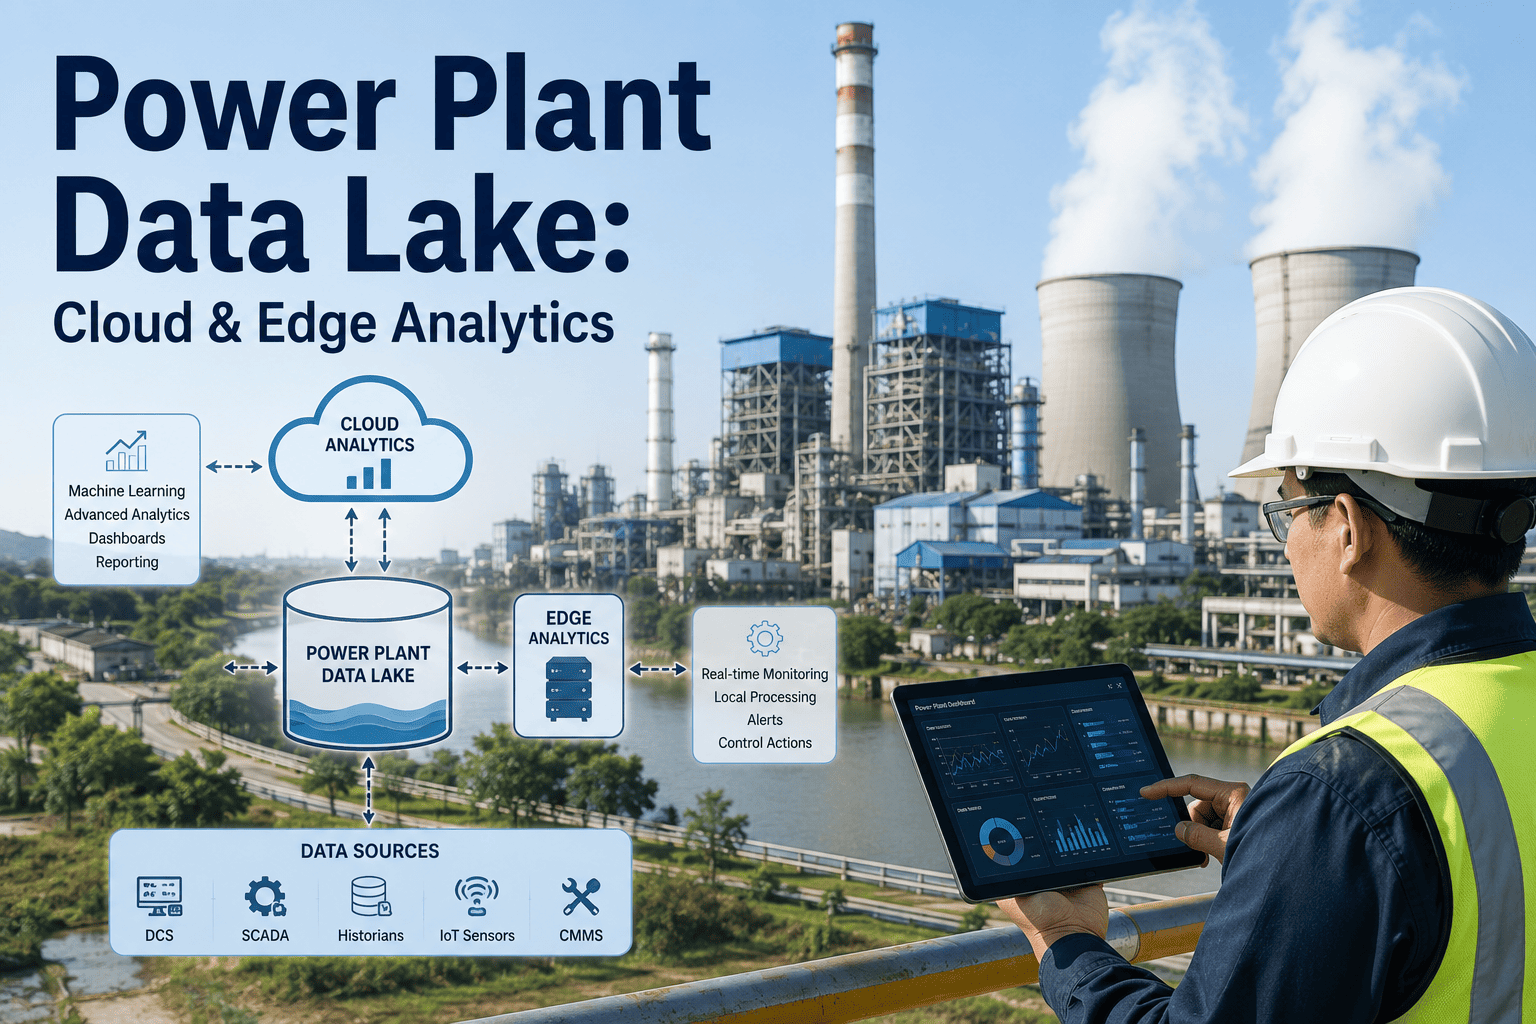
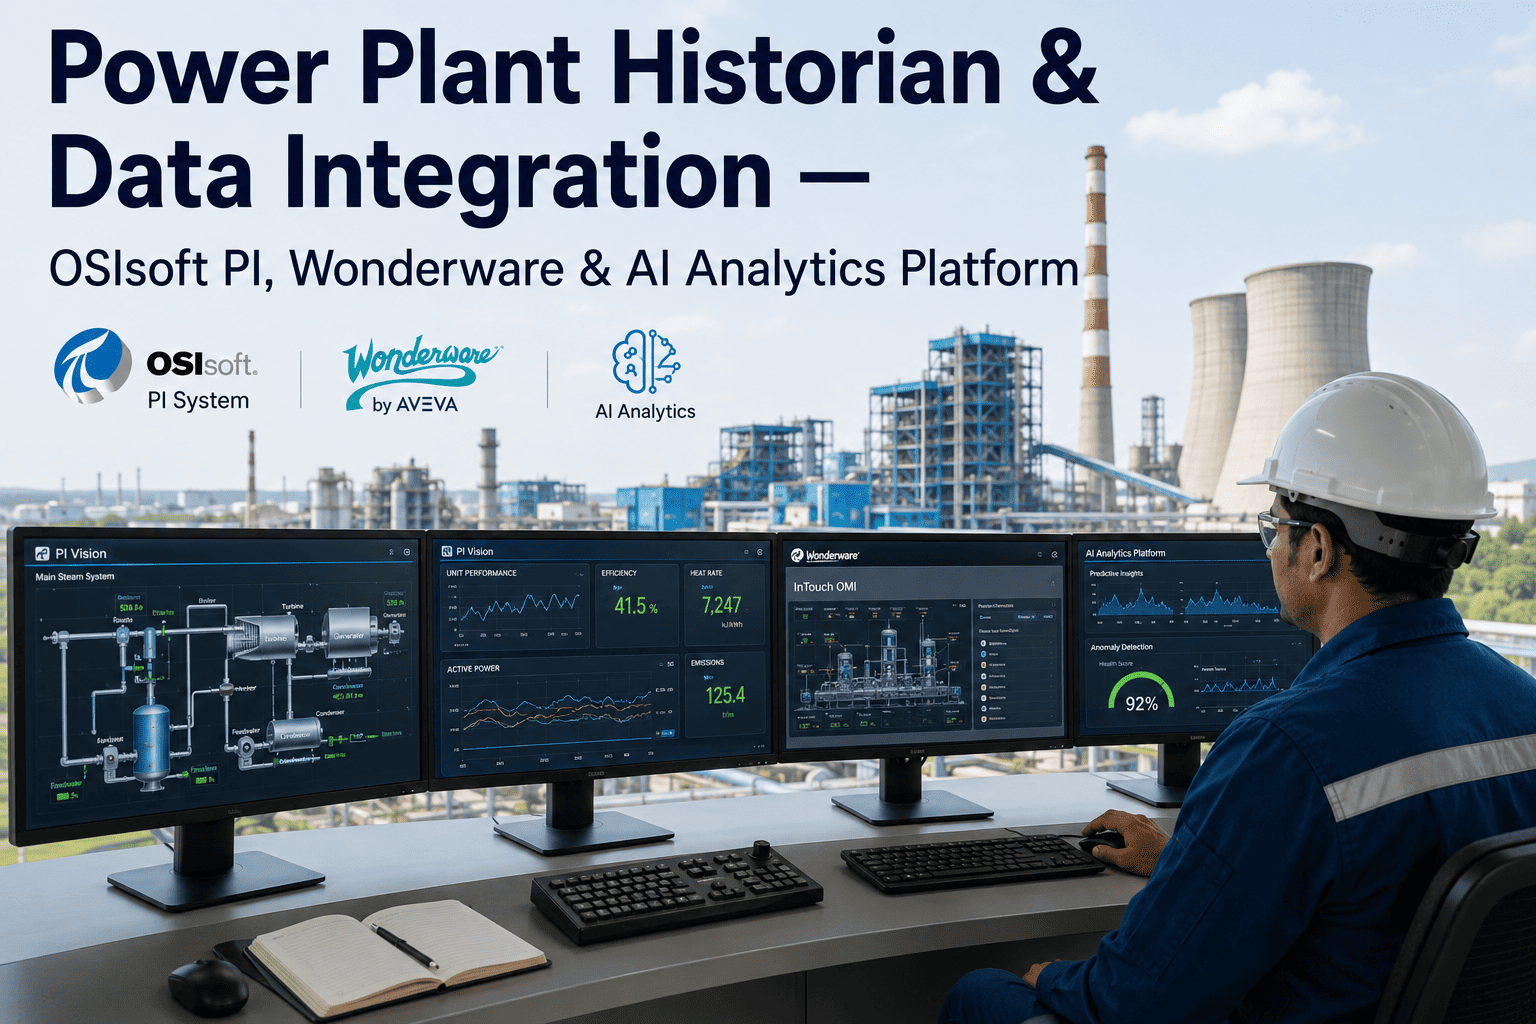
Most plant managers who look into predictive analytics assume the project starts with a DCS upgrade or a historian migration, and that assumption alone has quietly killed more good analytics initiatives than any technical limitation ever has. The truth is far less disruptive: predictive analytics platforms are built to sit on top of the infrastructure you already have, reading from your existing historian and control system rather than replacing either one. Understanding the actual connectivity options, and where each one fits your environment, turns a project that sounds like a multi-year capital investment into something that can go live in weeks. See how iFactory connects to your existing DCS and historian without a rip-and-replace project when you book a demo.
You Don't Need a New DCS to Get Predictive Analytics
Predictive analytics platforms read your existing tags, they don't replace the systems that generate them. iFactory connects through the same interfaces your historian already uses to pull data from PLCs, SCADA, and the DCS, and the connection can typically be validated in a test environment before any production data flow begins.
Why "We'd Have to Replace Our DCS First" Is Almost Always Wrong
Reliability and IT teams frequently shelve predictive analytics projects after estimating the cost of a control system overhaul that was never actually required. Historians and DCS platforms were designed from the ground up to expose data to external applications, whether that's a visualization tool, a reporting system, or an analytics platform, and that exposure layer is exactly what a predictive analytics platform plugs into. The real integration work is almost always smaller, faster, and cheaper than the imagined alternative of touching the control system itself. This misunderstanding tends to originate from confusing two very different kinds of projects. A control system replacement touches safety logic, operator displays, and the fundamental way the plant is controlled, and rightly demands months of planning, testing, and change management. A predictive analytics integration touches none of that. It simply reads values that are already being generated, stored, and displayed today, and routes them into a separate analytical engine running alongside, not inside, the existing control environment. Once that distinction is clear, the perceived barrier to starting a predictive maintenance program tends to disappear almost immediately, and the conversation shifts from whether the plant can afford a DCS overhaul to which integration pathway fits the infrastructure already in place.
The Integration Pathways Most Plants Actually Use
There is no single correct way to connect a predictive analytics platform to plant infrastructure, and the right pathway depends on what data sources exist today, how they are currently networked, and how strict the plant's cybersecurity posture is around anything touching operational technology. Many plants, especially those operating multiple units or a mix of legacy and modern control systems, end up using more than one of these pathways simultaneously, connecting to a central historian for the majority of tags while using OPC-UA for a newer unit that hasn't been fully historized yet. The platform is designed to blend data from multiple pathways into a single unified view, so the choice of connection method for a given data source does not fragment the analytics experience for the people actually using it day to day.
Not Sure Which Integration Path Fits Your Plant?
iFactory's integration team reviews your current historian, DCS, and network architecture and recommends the fastest, lowest-risk connectivity path for your specific environment.
What Happens to Your Data After It Leaves the Historian
Once connectivity is established, data moves through a structured pipeline designed to turn raw tag values into a form predictive models can actually use, without ever requiring changes to how that data is generated at the source.
This pipeline runs continuously and independently of the historian's own retention and compression settings, which means the analytics platform can maintain its own model-ready data store without placing additional load on production historian queries that operators depend on for daily trending. Because contextualization happens once during setup rather than being re-derived every time a new alert fires, the ongoing computational overhead of running predictive models stays low even as the number of monitored assets grows, and the same equipment hierarchy built during initial mapping continues to serve every new model added to the platform going forward, whether that is a vibration model added six months later or an entirely new failure mode identified after further data accumulates.
Tag Mapping and Equipment Context Matter More Than the Wire Protocol
If there is a genuine effort involved in a predictive analytics integration, it is not the network connection itself, it is making sure the platform understands what each tag actually represents in the context of your plant's equipment hierarchy. A historian tag named with an internal naming convention tells a predictive model nothing useful on its own, it needs to be mapped to a specific asset, a specific measurement type, and a specific location in the process before any model can reason about normal versus abnormal behavior for that point.
This mapping effort pays for itself the first time an alert arrives already labeled with the correct pump, motor, or heat exchanger name rather than a raw tag string that an engineer has to look up manually, and it is the single biggest factor separating an analytics deployment that gets used daily from one that quietly gets ignored after the initial rollout excitement fades. Plants that invest properly in this step during the pilot phase find that every subsequent unit or system added to the platform benefits from the same equipment hierarchy, turning what looks like a one-time setup cost into a reusable asset for the life of the analytics program.
What IT and OT Teams Should Confirm Before Go-Live
Any integration touching operational technology deserves scrutiny, and a well-run predictive analytics deployment should make it easy for IT and OT stakeholders to verify exactly what access is being granted and how data moves once it leaves the plant network. The checklist below reflects the questions most cybersecurity teams raise during review, and getting clear answers to each one upfront tends to shorten the internal approval process considerably compared to leaving these details for a security team to uncover on their own during a later audit.
Most cybersecurity reviews move quickly once these five points are documented in writing, because they map directly onto the standard questions an OT security team already asks about any new application, whether that application is a predictive analytics platform, a reporting tool, or a third-party dashboard. Plants that prepare this documentation before the review meeting rather than during it consistently report a shorter approval cycle, since the security team spends the meeting confirming details rather than generating a list of open questions to chase down afterward.
What Actually Happens Week by Week
Plants evaluating a predictive analytics integration often want a concrete sense of what the first few weeks actually look like before committing budget or engineering time, and the timeline below reflects a typical rollout for a single production unit connecting through an existing historian, one of the most common starting points.
This timeline compresses considerably for plants adding a second or third unit once the initial integration pattern and tag mapping conventions are established, since much of the connectivity and mapping logic built for the first unit carries forward directly. Multi-unit fleets frequently find that unit two and three go live in half the time the pilot unit required, simply because the integration team already understands the plant's historian structure and naming conventions.
Historian API vs OPC-UA vs Edge Gateway at a Glance
The table below summarizes how the three common integration pathways compare across the factors that typically drive the decision for a given site.
| Factor | Historian API | OPC-UA Direct | Edge Gateway |
|---|---|---|---|
| Best fit | Plants with a mature historian already in place | Plants with limited or no historization | Sites with strict network segmentation |
| Setup complexity | Low, reuses existing infrastructure | Moderate, requires tag mapping | Moderate, requires local hardware |
| Network footprint | Minimal, uses existing historian access | Direct read from control layer | Isolated, no direct control network exposure |
| Typical time to live data | Days to two weeks | One to three weeks | Two to four weeks |
Common Pitfalls That Slow Down an Otherwise Simple Integration
Most integration delays have nothing to do with the technology itself and everything to do with process and communication gaps between the teams involved. Recognizing these patterns ahead of time lets a project team route around them before they cost weeks of schedule. None of the pitfalls below are unique to predictive analytics deployments specifically, they are the same coordination challenges that slow down almost any cross-functional plant technology project, but they show up with particular frequency in analytics integrations because the project often spans reliability, process engineering, IT, and OT security teams that may not have a well-established working relationship with each other.
What Plant and IT Teams Ask Before Connecting Analytics to Their DCS
Your Historian Already Has the Data. Let's Put It to Work.
iFactory connects to your existing DCS, historian, or SCADA infrastructure through standard read-only interfaces, turning data you're already collecting into predictive maintenance intelligence without a control system replacement. Book a demo and see live connectivity mapped to your specific environment and equipment.