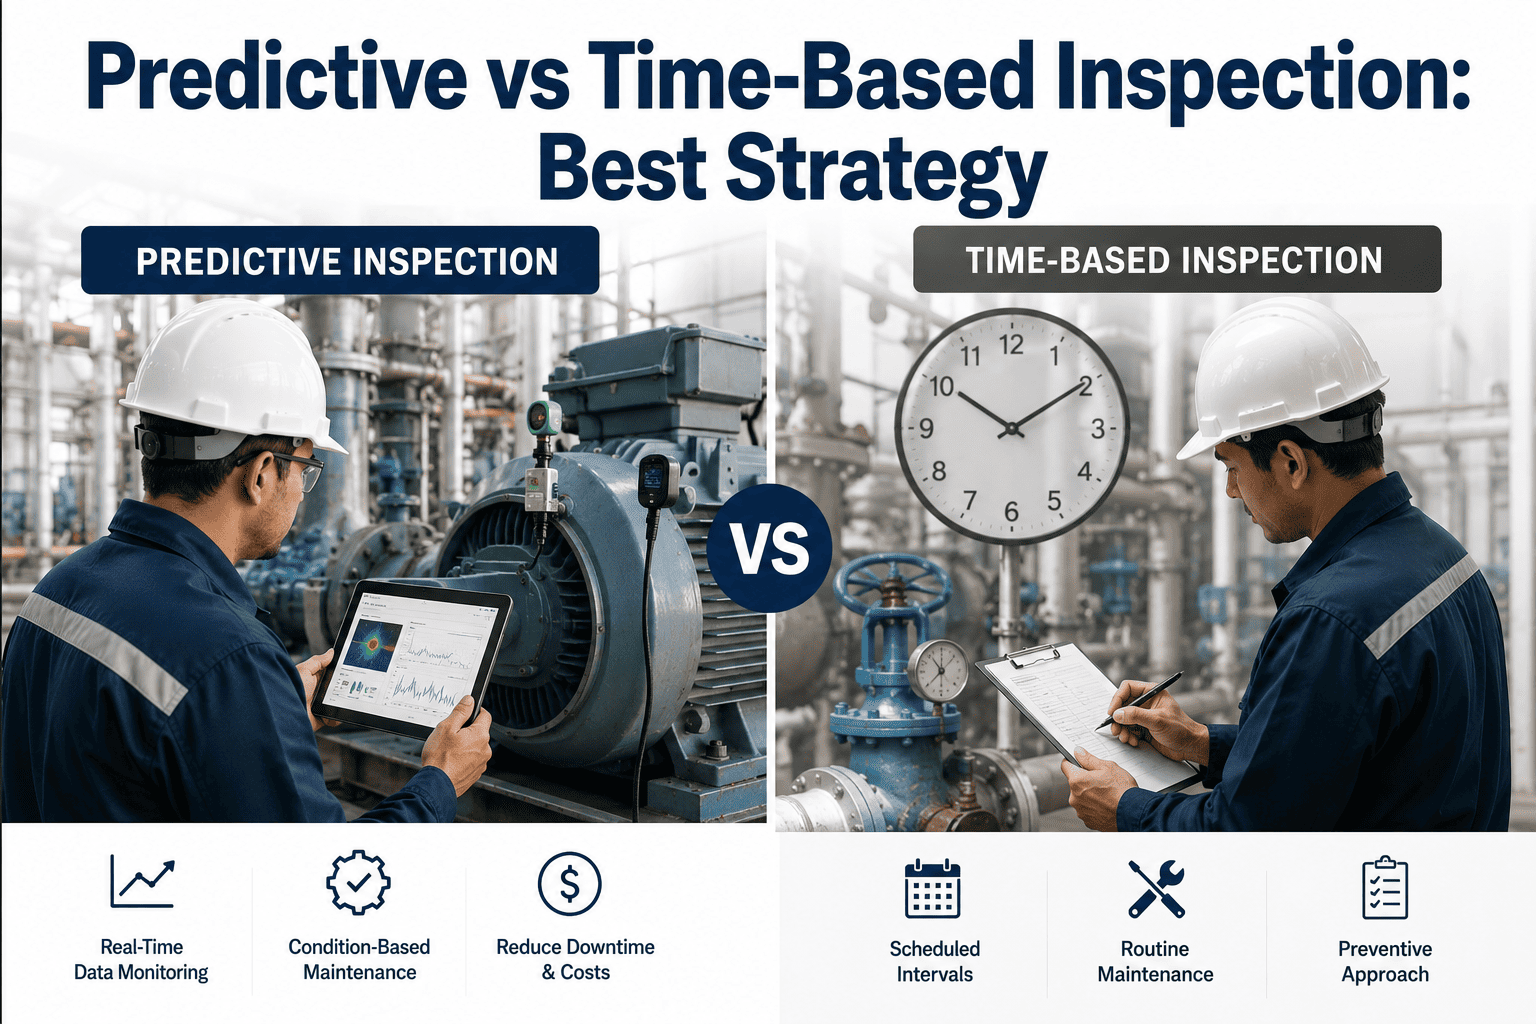
Most industrial facilities still run their inspection programs on fixed calendars, every six months, every twelve months, every two years, regardless of what the equipment is actually doing, how hard it has been running, or what condition data already exists that could redirect inspection resources to where they matter most. Time-based inspection was the right answer when condition data was scarce and analysis tools were limited, but sensor proliferation, camera-based monitoring, and AI-driven analytics have made it possible to inspect based on what the equipment needs rather than what the calendar dictates, and iFactory supports this transition with a predictive inspection workflow you can explore at iFactory support.
Blog · Inspection Strategy
Predictive vs Time-Based Inspection: Which Strategy Actually Protects Your Assets
A structured comparison of calendar-driven and condition-driven inspection approaches, with cost evidence, risk analysis, and a practical framework for building a hybrid strategy that works with your existing maintenance program.
Time-Based
Calendar-driven intervals
Same scope every cycle
Blind to condition between inspections
Reactive to failures
Predictive
Condition-driven triggers
Targeted scope based on data
Continuous monitoring between inspections
Proactive to degradation signals
The Time-Based Trap
Why Fixed-Interval Inspection Is Failing Modern Industrial Operations
Time-based inspection served the industry well for decades because there was no practical alternative. Equipment was inspected on a schedule because schedules were the only organizational tool available. But as operating profiles have changed, cycling duty has increased, and equipment ages beyond original design life, the assumption that condition degrades at a predictable calendar rate has become dangerously inaccurate. The following failures of time-based inspection are not theoretical — they are the root causes of most unplanned outages that occur between scheduled inspection windows.
01
The Interval Mismatch Problem
A twelve-month inspection interval assumes that the most critical degradation mode on the asset will take at least twelve months to progress from detectable to failure. When operating conditions change — increased cycling, different fuel composition, water chemistry excursions — the actual degradation rate can accelerate well beyond what the calendar interval was designed to accommodate. The inspection happens on schedule, but the failure happens between schedules because the interval was set for a different operating regime than what the asset is currently experiencing.
02
The Blanket Scope Inefficiency
Time-based programs typically inspect everything on the asset list every time the interval elapses, because there is no condition data to suggest which items need attention and which do not. This means inspection resources are spread evenly across all equipment regardless of actual condition, with the same effort spent on a pump showing early bearing degradation as on a pump that has been running steadily with no indication of change. The result is that the items that need more attention get the same attention as items that need less, which is a misallocation that time-based scheduling cannot correct.
03
The Between-Inspection Blind Spot
Perhaps the most consequential limitation of time-based inspection is that it provides zero visibility into what happens between inspection events. A tube develops a leak indication three months after the last inspection and ruptures at seven months — the time-based program has no mechanism to detect this because the next inspection is not scheduled until month twelve. The entire period between inspections is a blind interval during which the asset can degrade from acceptable to failed with no warning and no opportunity to intervene early.
04
The Institutional Knowledge Dependency
Time-based inspection programs rely heavily on inspector judgment to interpret findings and decide what matters. When an experienced inspector retires or transfers, the new inspector walking the same route with the same checklist may interpret the same conditions differently, leading to inconsistent trending and lost continuity. Without a digital condition record that survives personnel changes, time-based programs are vulnerable to knowledge erosion every time the inspection team changes, which happens more frequently than most maintenance organizations acknowledge.
How Predictive Inspection Works
The Condition-Based Inspection Pipeline From Data to Decision
Predictive inspection replaces the calendar with a data pipeline. Instead of waiting for a date to trigger an inspection, the system continuously evaluates condition signals and triggers inspections when those signals indicate that degradation has reached a threshold warranting physical examination. The pipeline has five stages, each producing a more refined output that the next stage consumes.
1
Continuous Data Capture
Cameras, sensors, and existing plant instrumentation feed condition data into the platform continuously. This includes visual imagery from fixed cameras at inspection points, vibration readings from rotating equipment, temperature profiles from thermal monitoring, and process parameters that indicate equipment stress such as pressure differentials, flow rates, and cycle counts. The data capture layer runs without human intervention, building a growing record of equipment condition at intervals measured in minutes and hours rather than months.
2
Signal Analysis and Anomaly Detection
AI models analyze the incoming data stream against learned baselines for each monitored asset and location. The models are trained to recognize the normal range of variation for each signal and to flag deviations that exceed statistical thresholds. A vibration signature that shifts from its established pattern, a visual texture that diverges from the reference image, or a temperature profile that departs from the expected curve — each of these anomalies is detected and logged with a timestamp, location, and severity estimate.
3
Degradation Trending
Individual anomalies are not actionable in isolation — what matters is the trend. The platform tracks each detected anomaly over time, calculating the rate of change and projecting forward to estimate when the degradation will reach a threshold that requires physical inspection or intervention. A stain on a tube surface that has been stable for six months is treated differently from a stain that appeared last week and has already expanded by forty percent. Trending transforms point-in-time detections into trajectory information that supports prioritized decision-making.
4
Inspection Trigger Logic
When a degradation trend crosses a predefined threshold — either in absolute severity or in rate of change — the system generates an inspection recommendation with the specific location, the detected condition, the trend history, and the recommended inspection method. This trigger is not a calendar date. It is a condition-based decision that says this specific location on this specific asset has changed enough to warrant a human or physical inspection now, regardless of when the last inspection occurred or when the next one was scheduled.
5
Targeted Inspection Execution
The physical inspection is executed at the specific location the data has flagged, using the method recommended by the trigger logic. Because the inspection scope is defined by data rather than by a blanket checklist, the inspector spends time on the locations that have actually changed rather than walking a generic route. Findings from the physical inspection are fed back into the platform to calibrate the models and update the condition record, closing the loop between digital monitoring and physical verification.
Head-to-Head Comparison
How the Two Strategies Differ Across Six Critical Inspection Dimensions
The difference between predictive and time-based inspection is not just about when inspections happen. It fundamentally changes how inspection scope is defined, how resources are allocated, how findings are interpreted, how outage planning works, and how the organization builds institutional knowledge about asset condition over time.
Inspection Trigger
Inspection is triggered when a calendar date arrives, regardless of what the equipment has experienced since the last inspection. If the unit ran gently for the entire interval, it still gets the same inspection. If the unit was pushed hard with cycling, chemistry excursions, and overloads, it still gets the same inspection on the same date.
VS
Inspection is triggered when condition monitoring detects that a specific asset or location has degraded beyond a defined threshold or is degrading at a rate that will reach that threshold before the next planned inspection window.
Scope Definition
The inspection scope is defined by a checklist that covers the same items every cycle. The checklist is typically built from original equipment manufacturer recommendations, industry standards, and site-specific failure history, but it does not change based on what has actually happened to the equipment since the last inspection.
VS
The inspection scope is built from the accumulated condition data since the last physical inspection, focusing on locations where monitoring has detected changes and deprioritizing locations that show stable, unchanged condition. The scope is different every time because the data is different every time.
Resource Allocation
Inspection labor, equipment, and time are distributed across all items on the checklist in a fixed pattern. High-risk items get the same inspection effort as low-risk items unless the checklist has been manually modified, which requires someone to anticipate the change before the inspection starts.
VS
Inspection resources are concentrated on the locations that the data says need attention. If three out of twenty monitored locations show degradation trends and seventeen are stable, the physical inspection focuses on those three with appropriate depth, freeing labor for other work or reducing total inspection time.
Finding Interpretation
Findings are interpreted against the inspector's experience and the written report from the previous inspection. Without a digital image history tied to specific locations, the inspector must rely on memory and notes to determine whether a crack, stain, or deformation is new, growing, or unchanged since the last time that location was examined.
VS
Findings are interpreted against a complete digital image and detection history for that specific location. The inspector sees not just what is there now, but what was there last time, the rate of change, and the projected trajectory. This context transforms a point-in-time observation into a trend-informed assessment.
Outage Planning Integration
Outage inspection scopes are built from the same checklists used during online inspections, often expanded to include items that were deferred or inaccessible during the previous online window. The scope is defined by what was on the list, not by what the equipment condition data suggests is most important to examine during the limited outage time available.
VS
Outage inspection scopes are built from the prioritized list of condition-triggered findings that have accumulated since the last outage, ranked by severity and degradation rate. The outage time is spent on the highest-priority locations first, ensuring that the most consequential findings get the deepest examination within the available window.
Long-Term Trending
Trending depends on written reports and selected photographs stored in filing systems or document management platforms. Comparing condition across multiple inspection cycles requires manually locating and reviewing prior reports, and the comparison is only as good as the photographs that were selected for inclusion — which may not cover the same locations from cycle to cycle.
VS
Every monitored location has a complete, searchable image and detection history that spans every inspection cycle since monitoring began. Trending is automated — the system can pull the condition history for any location, any defect class, and any time range without manual searching, and it survives inspector turnover without knowledge loss.
Cost and Risk Quantification
The Financial Impact of Switching From Time-Based to Predictive Inspection
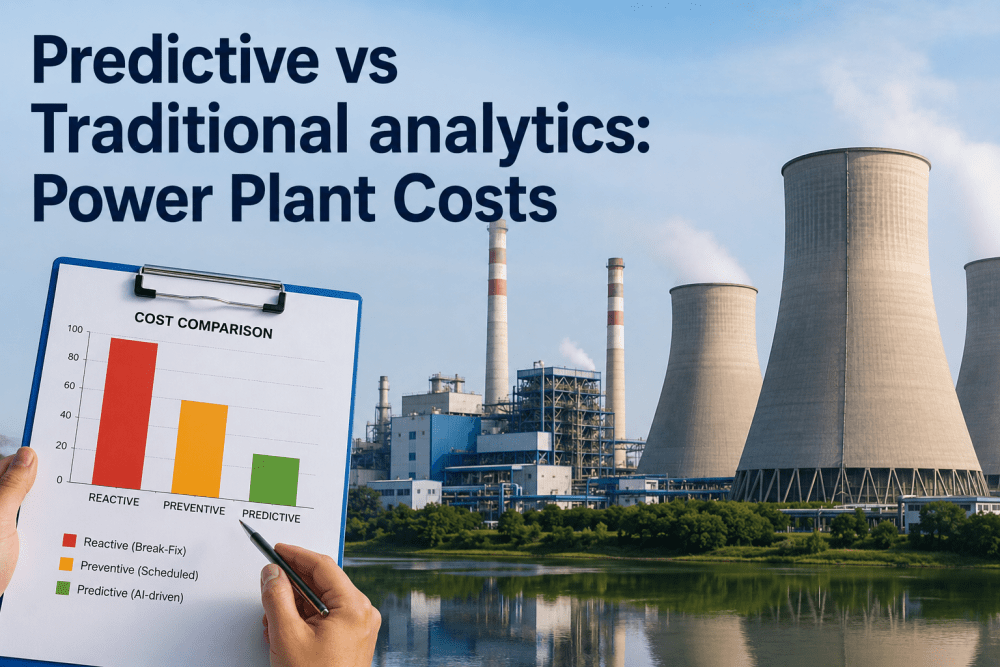
The cost argument for predictive inspection is not that it eliminates inspection spending. It is that it redirects inspection spending from low-value blanket coverage to high-value targeted examination, while simultaneously reducing the much larger cost category of unplanned failures that occur in the blind spots of time-based programs. The following cost dimensions represent where the financial difference materializes in practice.
Inspection Labor Efficiency
25-40% Reduction
By eliminating blanket checklist coverage and focusing physical inspection on data-flagged locations, total inspection labor hours drop because inspectors spend time only where the data says condition has changed. The reduction varies by facility depending on how much of the current inspection scope is redundant on any given cycle.
Unplanned Outage Avoidance
$200K - $5M Per Event
The single largest financial impact. Each unplanned outage avoided by catching degradation before it becomes a failure represents lost generation or production revenue, emergency repair mobilization, equipment damage cascades, and regulatory consequences that dwarf the entire annual inspection budget for most facilities.
Outage Window Optimization
15-30% Shorter Scopes
When outage inspection scopes are built from prioritized data rather than blanket checklists, the total scope shrinks because stable locations are deprioritized. Shorter inspection scopes within a fixed outage window mean more time available for actual repair work, or the ability to shorten the outage duration itself.
Spare Parts Inventory Reduction
10-20% Inventory Value
Predictive trending provides advance notice of which components are degrading and when they will need replacement, allowing just-in-time procurement instead of stocking spares for every possible failure mode on every asset. The inventory carrying cost reduction is a direct financial benefit of knowing what will fail before it fails.
Capital Planning Accuracy
Deferred or Optimized CapEx
When condition trending shows that a component degradation rate is slower than the age-based assumption used in capital planning, the replacement can be deferred by years. When it shows faster degradation, the replacement can be pulled forward before a failure forces an emergency capital expenditure at much higher cost.
Regulatory and Insurance
Variable by Industry
Demonstrating a predictive inspection program with documented condition trending and proactive intervention history can influence regulatory inspection frequency requirements and insurance risk assessments. Some jurisdictions and insurers recognize condition-based programs as equivalent or superior to calendar-based compliance, potentially reducing mandatory inspection frequencies and associated downtime.
Your Inspection Budget Is Probably Spending 60-70% of Its Resources on Equipment That Has Not Changed Since the Last Inspection Cycle.
Predictive inspection redirects that spend to the locations where condition is actually changing — and catches the failures that time-based programs miss in the blind spots between scheduled intervals.
Building a Hybrid Strategy
A Practical Four-Phase Roadmap From Time-Based to Predictive Inspection
No facility transitions from a fully time-based program to a fully predictive program overnight. The practical path is a phased approach that layers predictive capability on top of the existing time-based program, gradually shifting the balance from calendar-driven to condition-driven as the data infrastructure matures and the organization builds confidence in the predictive triggers.
Phase 1
Data Foundation — Months 1 to 3
Establish continuous monitoring on the highest-consequence assets
Deploy camera-based monitoring and integrate existing sensor data for the ten to twenty assets or locations that would cause the largest operational impact if they failed unexpectedly. Continue running the existing time-based inspection program unchanged. The goal of this phase is not to change inspection behavior but to start building the condition baseline that future phases will depend on. Every day of baseline data captured is a day of trending capability that did not exist before.
Phase 2
Parallel Running — Months 3 to 9
Run both strategies simultaneously and compare results
Keep the time-based inspection program running on its normal schedule, but add a parallel predictive analysis that generates condition-triggered inspection recommendations for the monitored assets. After each time-based inspection cycle, compare what the time-based checklist found against what the predictive system would have flagged. This comparison builds the evidence base that shows where predictive triggers catch things the calendar misses and where the calendar still adds value for assets not yet under monitoring.
Phase 3
Selective Migration — Months 9 to 18
Convert monitored assets from time-based to condition-based triggers
For assets where the parallel running phase has demonstrated that predictive triggers reliably identify the conditions that matter, formally transition those assets from calendar-based to condition-based inspection triggers. The time-based interval is replaced by the predictive trigger logic, and the inspection scope for those assets is now defined by the data rather than the checklist. Assets not yet under monitoring remain on the time-based schedule until monitoring coverage expands to include them.
Phase 4
Full Integration — Months 18 to 24
Expand monitoring coverage and retire remaining calendar-only intervals
Extend monitoring to the remaining assets in the inspection program, using the infrastructure, model library, and organizational experience built in the first three phases. As each new asset comes under monitoring, it transitions through the same parallel running and migration process. By the end of this phase, the majority of the inspection program is running on condition-based triggers, with time-based intervals retained only for the small number of assets where monitoring is not yet feasible or where regulatory requirements mandate calendar compliance.
Common Misconceptions
What People Get Wrong About Switching From Time-Based to Predictive Inspection
The transition from time-based to predictive inspection encounters resistance that is usually based on misunderstandings about what predictive inspection requires, what it replaces, and what changes for the inspection team. The following misconceptions are the ones that most often delay or derail adoption.
Misconception
Predictive inspection means we can stop doing physical inspections entirely and just rely on sensors and cameras.
Reality
Predictive inspection changes when and where physical inspections happen, not whether they happen. The data pipeline identifies the locations that need physical examination and tells the inspector exactly what to look for and why. Physical inspection becomes more targeted and more valuable, not less necessary.
Misconception
We need to install hundreds of new sensors before we can start doing predictive inspection.
Reality
Most facilities already have far more data available than they are using. Existing plant instrumentation, CCTV systems, DCS data historians, and periodic inspection records can feed a predictive program without any new sensor installation. Additional sensors are added later where specific gaps are identified, not as a prerequisite to starting.
Misconception
Regulators will not accept predictive inspection in place of calendar-based compliance inspections.
Reality
Many regulatory frameworks, including API 580/581 for risk-based inspection and ASME PCC-3 for equipment lifecycle management, explicitly provide pathways for condition-based and risk-based inspection programs as alternatives to pure time-based compliance. The documentation and trending that predictive inspection produces often exceeds what regulators require from calendar-based programs.
Misconception
Our inspectors will resist it because it changes their role and makes their experience less relevant.
Reality
Inspectors who have spent years walking the same routes with the same checklists are often the strongest advocates once they experience the difference. Predictive inspection gives them better information about what to look for, eliminates the tedious parts of blanket coverage inspection, and elevates their role from checklist executor to condition assessor who interprets data-informed findings rather than discovering conditions blind.
Industry Evidence
What Facilities Report After Transitioning to Predictive Inspection Strategies
35-50%
Reduction in unplanned equipment failures within the first two years of predictive inspection deployment, as reported across power generation and process industry reliability benchmarking studies
3:1
Average return-on-investment ratio for predictive inspection programs in the first three years, driven primarily by unplanned outage avoidance rather than inspection cost reduction
60-70%
Of physical inspection findings that predictive programs flag are concentrated in 20-30% of monitored locations, confirming that blanket inspection spends most effort on unchanged equipment
8-14 months
Average lead time between first detection of a degradation signature by predictive monitoring and the point where that degradation would have caused a failure if undetected
90%+
Of facilities that complete the full four-phase transition report that they would not return to a purely time-based program, citing the between-inspection visibility as the primary irreversible benefit
Zero
Loss of inspection coverage during transition when the hybrid approach is followed — time-based intervals remain active until predictive triggers have demonstrated reliability for each asset
Frequently Asked Questions
What Maintenance and Reliability Leaders Ask About Inspection Strategy Transition
Does predictive inspection completely replace time-based inspection, or do we still need some calendar-based intervals?
In practice, most facilities end up with a hybrid program where the majority of inspection activity is driven by condition triggers but a small number of calendar-based intervals remain for assets where monitoring is not feasible, where regulatory requirements mandate calendar compliance, or where the consequence of missed detection is so high that a minimum inspection frequency is retained as a backstop regardless of what the monitoring shows. The goal is not to eliminate every calendar interval but to make condition-based the default and calendar-based the exception for specific justified cases. To discuss how this hybrid model would work for your specific asset mix,
book a demo and we will walk through a tailored transition plan.
How long does it take to build enough baseline data for predictive triggers to be reliable?
The baseline period depends on the degradation mode and the data type. For visual inspection of surface degradation like cracking, corrosion, and staining, useful baselines can be established in two to three months of weekly or biweekly image captures. For vibration-based monitoring of rotating equipment, baselines of one to two months of continuous data are typically sufficient to define the normal operating signature. The key point is that baseline building starts producing value immediately because even an incomplete baseline is better than no baseline, and the predictive models improve continuously as more data accumulates. The
support team can provide specific baseline duration estimates for your asset types and monitoring methods.
What happens if the predictive system misses a degradation mode that the time-based program would have caught?
This is exactly why the phased hybrid approach exists. During the parallel running phase in Phase 2, the time-based program continues as a safety net while the predictive system's detection performance is validated against actual inspection findings. If the predictive system misses something that the time-based inspection catches, that gap is identified, the monitoring coverage or model is adjusted to address it, and the parallel running continues until the detection rate meets the reliability threshold defined by the facility. No asset is migrated from time-based to condition-based triggers until the predictive system has demonstrated that it catches the failure modes that matter for that specific asset type and operating context.
Do we need to hire data scientists or AI specialists to run a predictive inspection program?
Not with a deployed platform like iFactory. The AI models, anomaly detection algorithms, and trending analytics are built into the platform and configured during onboarding for your specific asset types and failure modes. Your inspection and reliability engineers interact with the system through standard interfaces — dashboards, finding cards, and trend views — without needing to write code, train models, or manage data pipelines. The platform handles the data science; your team handles the engineering judgment that interprets the findings and makes the maintenance decisions. To see the interface and workflow in action,
book a demo.
How does predictive inspection affect our insurance and regulatory compliance posture?
Most industrial insurers and regulators evaluate inspection programs based on whether they demonstrate systematic monitoring, documented findings, and evidence of proactive intervention — all of which predictive inspection produces in greater quantity and quality than time-based programs. Several major insurance carriers offer premium adjustments for facilities that can demonstrate condition-based monitoring programs with documented trending and intervention history, because the risk profile of a facility that catches degradation early is objectively lower than one that relies on calendar intervals with blind spots in between. For regulatory compliance, frameworks like API 580/581, ASME PCC-3, and equivalent international standards explicitly accommodate risk-based and condition-based inspection as alternatives to fixed-interval programs, and the documentation that predictive inspection generates typically exceeds what regulators require from calendar-based approaches. The
support team can provide guidance on how to frame your predictive program for your specific regulatory and insurance stakeholders.
Stop Spending Your Inspection Budget on Equipment That Has Not Changed and Missing the Equipment That Has.
Predictive inspection gives you between-inspection visibility, targeted physical inspection scopes, and a trended condition record that survives personnel turnover — all built on top of your existing program without disrupting what already works.