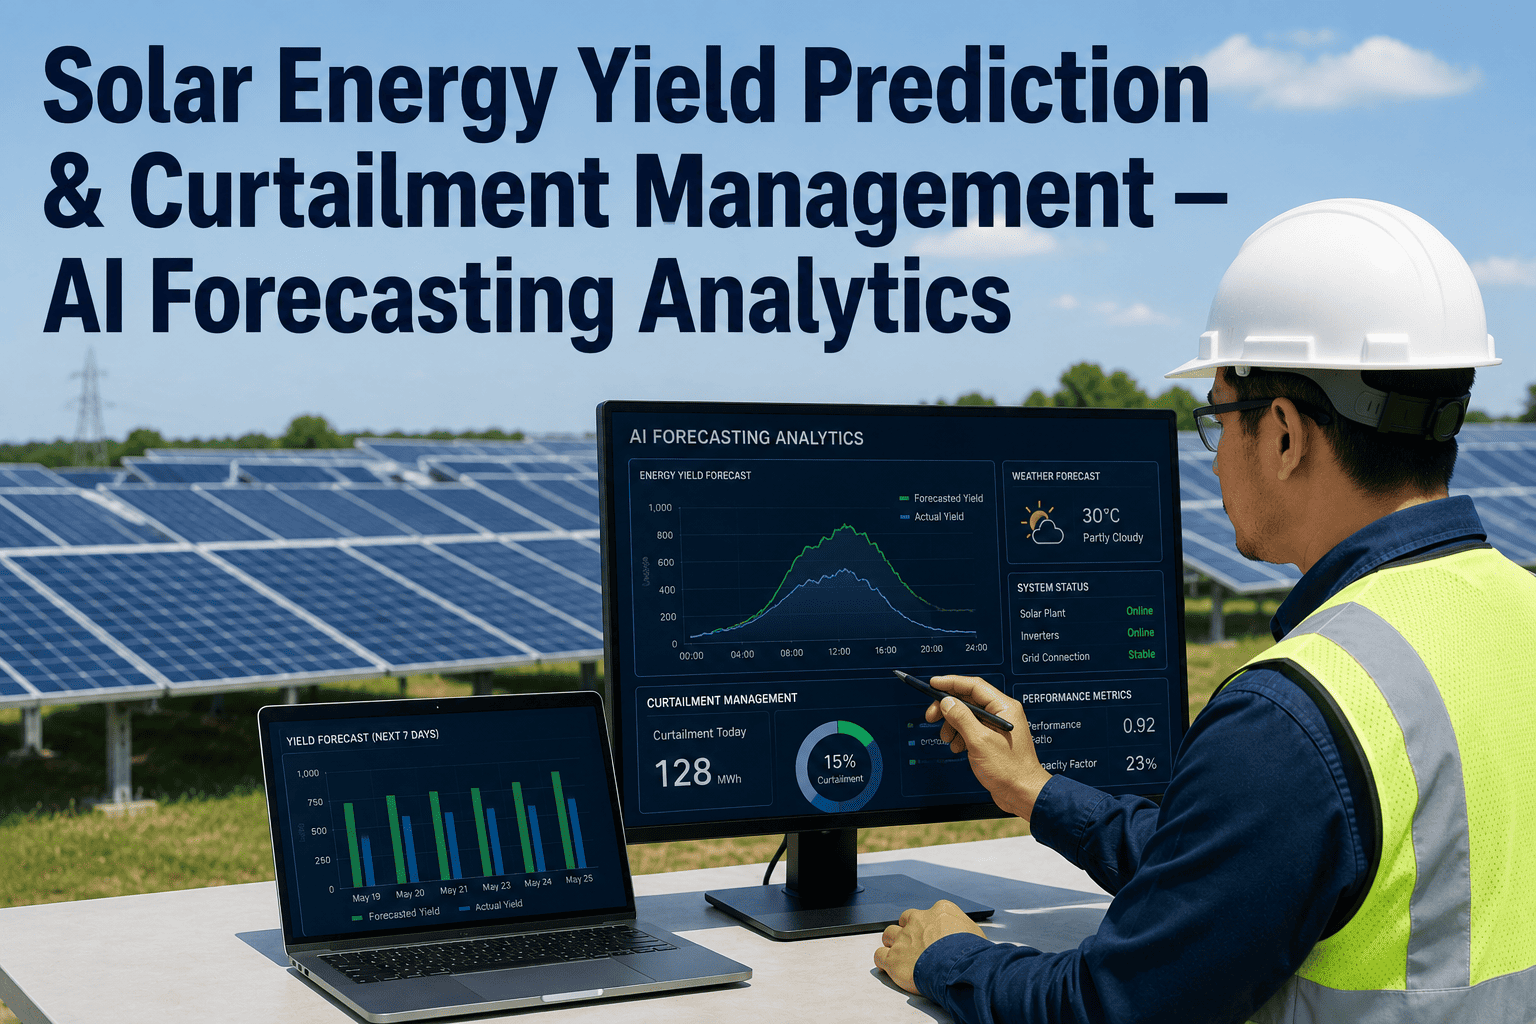
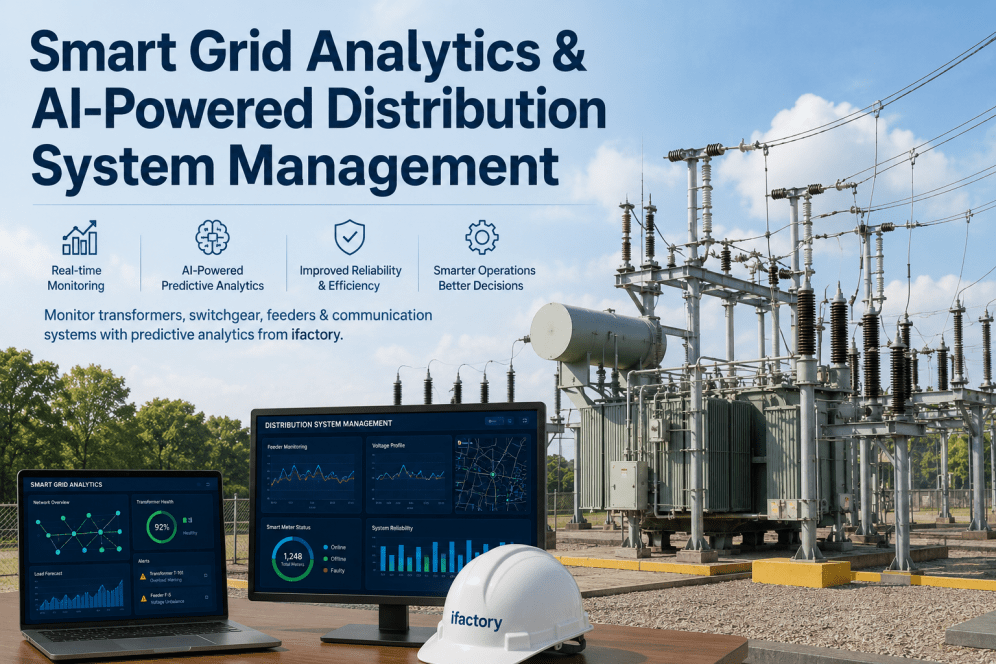
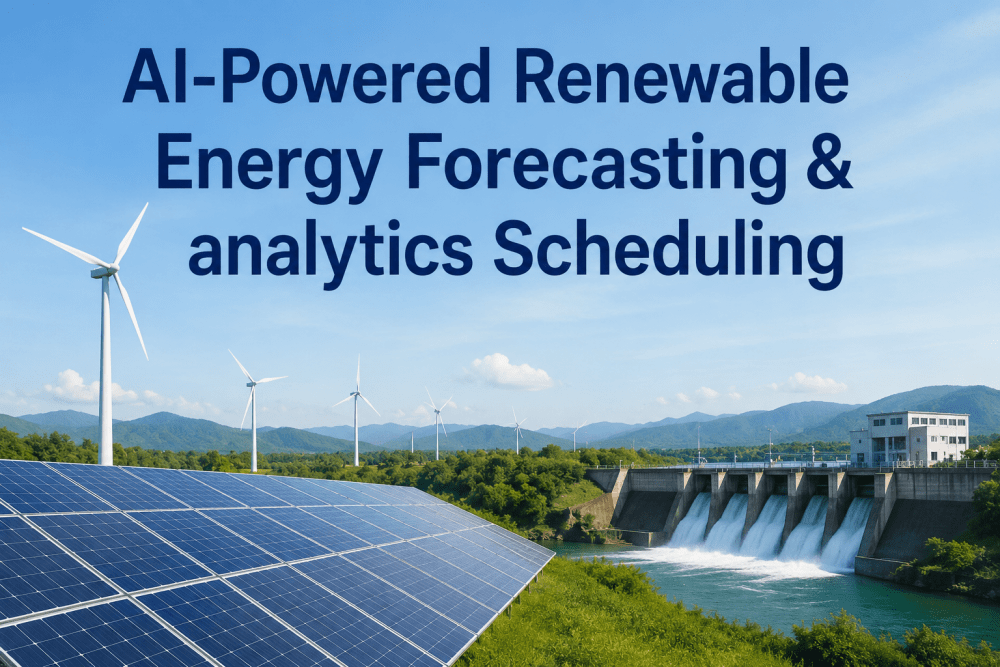
Every curtailment order costs money twice — once in the generation you can't sell, and again in the forecast error that made the grid operator distrust your bid in the first place. Operations directors managing solar portfolios against day-ahead and real-time markets are finding that the gap between forecasted and delivered generation is quietly one of the largest controllable costs on the books, larger in many cases than the physical losses from soiling or equipment wear combined. AI-driven irradiance forecasting and curtailment analytics are built to close that gap, and you can book a demo to see the forecast accuracy against your own portfolio's historical data.
ENERGY YIELD FORECASTING · CURTAILMENT ANALYTICS
Capture More Revenue From the Generation You're Already Producing
iFactory forecasts solar yield with satellite-informed irradiance modeling and turns curtailment events into a managed, revenue-optimized process instead of an unplanned loss.
The Revenue Leak
Two Numbers Every Solar Portfolio Should Be Watching
Forecast error and curtailment loss are usually tracked in different spreadsheets, owned by different teams, and rarely reviewed side by side — even though they're two sides of the same revenue problem. A forecast that consistently overstates output leads to underbidding penalties and lost market opportunity. A curtailment event that isn't actively managed leaves negotiable generation on the table that a better dispatch strategy could have partially recovered.
Day-Ahead
forecast accuracy directly determines market bid quality and penalty exposure
Real-Time
intra-hour forecast correction reduces balancing market imbalance charges
Grid-Ordered
curtailment events managed proactively instead of absorbed as pure loss
Portfolio-Wide
visibility across every site's forecast performance and curtailment history
How Forecasting Works
From Satellite Data to a Site-Level Generation Forecast
Accurate yield prediction starts well before the panel — it starts with the weather. The forecasting pipeline layers several data sources together, then calibrates the result against each site's actual historical performance.
Input
Satellite & Weather Data
Cloud cover, aerosol density, and atmospheric conditions pulled from satellite imagery and regional weather models, updated on a rolling basis throughout the day.
Model
Irradiance Prediction
Machine learning models trained on historical weather-to-irradiance patterns translate atmospheric data into a site-specific solar irradiance forecast for each hour ahead.
Calibration
Site Performance History
The irradiance forecast is converted into an expected generation number using each site's own historical output curve, panel degradation rate, and known equipment constraints.
Output
Bid-Ready Generation Forecast
A day-ahead and continuously updated intra-day forecast, formatted for direct use in market bidding and dispatch planning decisions.
Curtailment Playbook
Turning a Curtailment Order Into a Managed Decision
Grid-ordered curtailment is often treated as an unavoidable loss, but the size of that loss depends heavily on how the order is handled. A managed curtailment process evaluates the tradeoffs in real time instead of applying a blanket production cut.
Constraint Recognition
Grid constraint signals and curtailment instructions are ingested automatically, flagging which assets and time windows are affected before the order takes effect.
Revenue Impact Modeling
The forecast engine calculates the generation and revenue value at stake for the curtailment window, giving dispatch teams a real number to work from rather than a percentage cut.
Selective Dispatch Response
Where partial compliance options exist, the platform identifies which assets or inverter blocks to curtail first to minimize total revenue impact across the portfolio.
Post-Event Reconciliation
Actual curtailed generation is reconciled against the forecast baseline automatically, producing clean documentation for settlement and compensation claims.
SEE YOUR FORECAST ACCURACY
Run Your Portfolio's Historical Data Through the Forecast Engine
Bring recent generation and curtailment history and our team will show you exactly where forecast error and curtailment loss are costing your portfolio revenue today.
Forecasting Approach Comparison
Basic Weather Forecasting vs. AI-Calibrated Yield Prediction
Not every forecasting approach delivers the same accuracy, and the difference shows up directly in bid penalties and imbalance charges.
Solar Yield Forecasting — Approach Comparison
Portfolio View
Benchmarking Forecast Accuracy Across Every Site You Operate
A single site's forecast accuracy tells you how that site is performing. A portfolio-wide view tells you which sites are systematically underforecast, which markets are absorbing the most curtailment risk, and where the next round of calibration effort will pay off fastest.
Site-Level Accuracy Ranking
Every site is ranked by day-ahead forecast error, surfacing which locations need recalibration before their forecast error keeps costing bid penalties.
Curtailment Exposure by Market
Curtailment frequency and revenue impact are broken out by ISO or utility territory, showing which markets carry the most grid-constraint risk across your footprint.
Imbalance Charge Trending
Real-time balancing charges are tracked over time per site, isolating whether imbalance costs are driven by forecast error, curtailment, or unplanned equipment downtime.
Quarterly Revenue Recovery Report
A consolidated report quantifies the revenue recovered through improved forecast accuracy and managed curtailment response, formatted for board and investor reporting.
Frequently Asked Questions
Yield Forecasting & Curtailment Management — FAQ
How accurate is the day-ahead forecast compared to what we're using now?
Accuracy depends on site conditions and weather variability, but AI-calibrated models that combine satellite irradiance data with a site's own historical performance consistently outperform generic regional weather forecasts, particularly on partly cloudy days where basic models struggle most. The clearest way to see the difference is to run your own historical generation data through the engine and compare the forecast output against what actually happened — which is exactly what happens during a
book a demo session.
Can the platform integrate with our existing market bidding system?
Yes. Forecast output is formatted to feed directly into standard day-ahead and real-time market bidding workflows, and the platform can be configured to match the specific format and timing requirements of the ISO or utility your portfolio bids into. Most integrations are handled during onboarding without requiring changes to your existing bidding software.
Does this help with curtailment compensation claims and settlement documentation?
Yes. Because the platform maintains a forecast baseline for what generation would have been without the curtailment order, actual curtailed output is reconciled against that baseline automatically, producing clean, timestamped documentation that supports compensation claims and settlement processes without requiring manual reconstruction after the fact.
How does forecast accuracy improve over time for a specific site?
Each site's calibration improves as more actual generation outcomes are compared against forecasted values, allowing the model to correct for site-specific factors like local microclimate effects, shading patterns, and equipment-specific performance quirks that a generic regional forecast would never capture. Most sites see meaningful accuracy gains within the first two to three months of continuous operation.
Can we manage a multi-site portfolio with different market rules from a single dashboard?
Yes, portfolio-wide visibility across sites with different market participation rules, curtailment histories, and forecast accuracy trends is one of the platform's core use cases for operations directors managing distributed solar assets. For details on configuring multi-market portfolios,
contact support before your onboarding call.
YIELD FORECASTING · CURTAILMENT MANAGEMENT · 2026
Stop Treating Forecast Error and Curtailment as Unavoidable Losses
See how AI-calibrated forecasting and managed curtailment response can recover revenue that's currently being left on the table across your solar portfolio.