Thermal imaging and infrared monitoring have become essential technologies for electrical equipment condition assessment in power generation, industrial manufacturing, and critical infrastructure facilities.iFactory's condition monitoring platform integrates fixed thermal camera arrays, drone-based infrared surveys, and handheld thermography workflows into a unified analytics layer that applies machine learning to thermal data for automated hot spot detection, temperature trend analysis, and predictive failure alerting. Book a Demo to see iFactory's thermal monitoring platform configured for your facility's electrical infrastructure.
Deploy AI-Enhanced Thermal Monitoring Across Your Electrical Infrastructure
iFactory's platform integrates fixed thermal cameras, drone-based IR surveys, and handheld thermography with AI-driven hot spot detection, temperature trend analysis, and automated inspection workflows — all from a single condition monitoring dashboard.
Why Electrical Equipment Thermal Failures Are Predictable — and Why Most Plants Miss the Signs
Electrical equipment degrades through heat long before it fails through electrical fault. Loose connections generate resistive heating at the point of increased contact resistance. Insulation breakdown creates leakage currents that produce localized temperature rise. Overloaded conductors operate above their rated temperature, accelerating insulation aging. Switchgear bus bar joints, cable terminations, transformer bushings, circuit breaker contacts, and motor control center connections all exhibit detectable temperature anomalies that precede failure by weeks or months. Despite this predictability, the majority of industrial facilities rely on annual or semi-annual handheld infrared thermography surveys conducted by third-party contractors — a sampling rate that leaves 364 days of thermal data gap between inspections. Book a Demo to learn how iFactory's continuous thermal monitoring closes this detection gap across your electrical distribution system.
Critical Electrical Assets Where Thermal Imaging Prevents the Most Costly Failures
Thermal imaging addresses distinct failure modes across the full electrical distribution chain — from primary substation equipment and switchgear to motor control centers, cable systems, and critical power electronics. Each asset class produces specific thermal signatures that AI models learn to recognize, classify, and trend over time. iFactory's thermal analytics platform supports fixed, drone, and handheld thermal data sources across seven critical electrical asset categories.
Switchgear and Bus Bar Systems
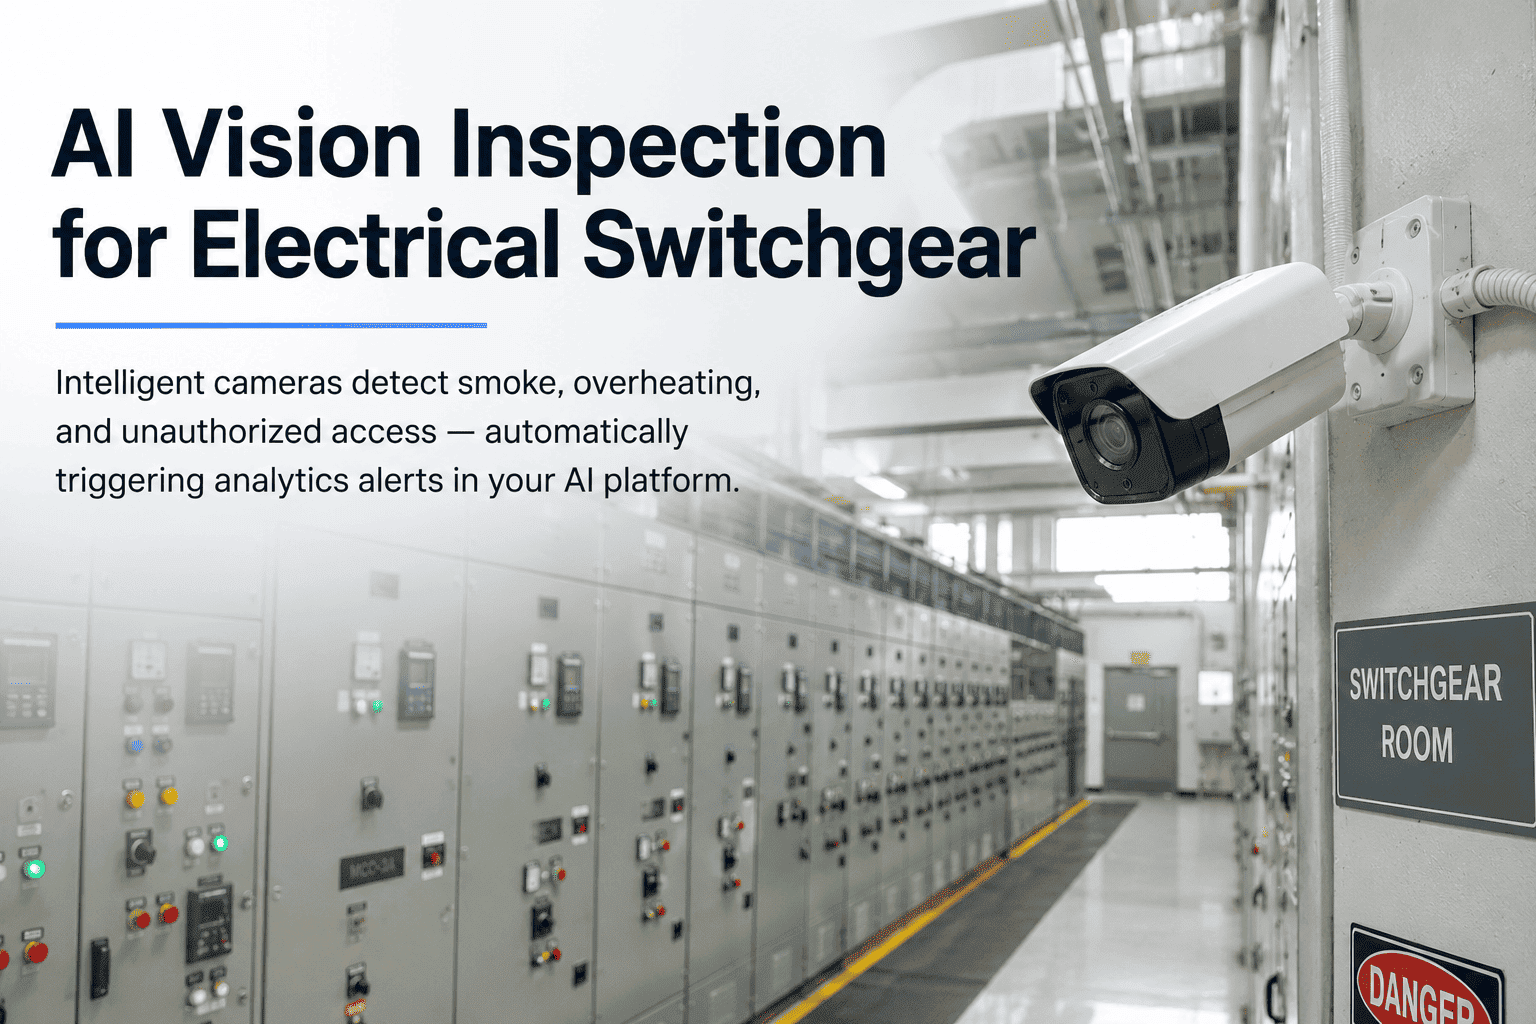
Fixed thermal cameras monitoring medium-voltage and low-voltage switchgear lineups detect hot spots at bus bar joints, circuit breaker contacts, and cable terminations. AI models track temperature rise relative to load current, distinguishing genuine connection degradation from load-driven temperature variation. Priority-based alerting escalates connections exceeding 10°C, 20°C, and 40°C thresholds with load-normalized severity scoring.
Transformers and Bushings
Transformer thermal monitoring covers tank wall temperature distribution, bushing connection temperature, cooling system performance, and load tap changer condition. AI analytics compare phase-to-phase temperature balance and load-versus-temperature correlation to detect internal winding faults, bushing degradation, and cooling system degradation before they advance to catastrophic failure.
Motor Control Centers and Starters
MCC bucket temperatures at main lugs, starter contacts, overload relay terminals, and cable entry points are monitored continuously with fixed thermal camera arrays covering entire MCC lineups. AI models learn the load-temperature profile for each bucket and detect abnormal temperature excursions that indicate loose connections, contact wear, or overload conditions before they produce operational faults.
Cable Systems and Terminations
Cable termination thermal monitoring at both ends of every critical feeder identifies high-resistance connections, shield termination faults, and conductor degradation. Medium-voltage cable splice temperature monitoring using distributed thermal sensing or fixed camera arrays detects the thermal progression of partial discharge activity and water tree degradation before cable failure occurs.
Power Electronics and VFDs
Variable frequency drive cabinets, DC bus capacitor banks, IGBT heat sinks, and filter components are monitored with thermal cameras positioned for direct line-of-sight to critical components. AI analytics detect capacitor degradation through case temperature trend analysis, IGBT thermal cycling stress accumulation, and cooling fan performance degradation before electronic component failure.
Substation and Transmission Equipment
Outdoor substation equipment — disconnect switches, circuit breakers, surge arresters, instrument transformers, and bus connections — benefit from drone-mounted thermal imaging and fixed camera surveillance. AI analytics classify equipment-specific thermal signatures, track seasonal and load-driven temperature baselines, and detect developing faults in outdoor equipment exposed to environmental degradation that accelerates connection deterioration.
Infrared Monitoring Technologies for Electrical Equipment Condition Assessment
Selecting the appropriate thermal imaging technology for electrical equipment monitoring requires balancing resolution, field of view, deployment flexibility, and cost across the specific asset configuration of each facility. The table below compares the primary infrared monitoring technologies available to plant operators and reliability engineers.
| Technology | Typical Resolution | Deployment Mode | Best Application | AI Integration |
|---|---|---|---|---|
| Fixed Thermal Cameras | 320×240 to 640×480 | Permanent installation, continuous monitoring | Switchgear, MCCs, transformer, cable terminations | Real-time AI inference on continuous stream |
| Drone-Mounted IR | 640×480 to 1280×1024 | Periodic aerial surveys | Substation equipment, overhead lines, rooftop gear | AI-based stitching and anomaly classification |
| Handheld Thermography | 160×120 to 640×480 | Walk-down inspection rounds | Detailed follow-up, confined spaces, complex geometry | Automated report generation and trend integration |
| Distributed Temperature Sensing | 1 meter spatial resolution | Buried/fiber-optic continuous sensing | Cable trays, underground ducts, long cable runs | Thermal gradient and hotspot profiling |
| Thermal IoT Sensors | 32×32 to 80×64 | Low-cost per-point monitoring | Cable terminations, small panelboards, junction boxes | Edge-based temperature threshold monitoring |
Conventional Thermography vs AI-Enhanced Continuous Thermal Monitoring
The transition from conventional interval-based infrared thermography to AI-enhanced continuous thermal monitoring represents a fundamental change in electrical equipment condition management. The comparison below makes the operational and safety impact explicit across the dimensions that matter most for electrical reliability programs.
- Annual or semi-annual handheld IR surveys capture thermal data at isolated points in time
- Between-survey interval leaves 180-364 days of thermal data gap; developing faults missed in window
- Manual image analysis depends on thermographer experience; findings vary between inspectors
- No load-current correlation; temperature anomalies attributed to loading rather than connection degradation
- Paper-based or PDF reports filed without trend comparison to previous survey data
- Corrective action triggered when visible hot spot exists during survey cycle only
- Single-employee dependency on thermography-certified technician limits survey reliability
- Fixed thermal cameras, drone surveys, and handheld data integrated into unified continuous monitoring timeline
- Zero thermal data gap; every electrical connection monitored every 5-60 minutes depending on criticality
- AI models analyze every thermal image against learned baselines; consistent detection logic across all assets
- Load-temperature correlation applied automatically; true connection degradation distinguished from load-driven variation
- All thermal data stored with trend history; multi-year temperature trend charts available for every monitored point
- Corrective action triggered automatically when AI detects developing condition; alerts sent with asset-specific context
- No thermography certification dependency; maintenance team receives AI-validated thermal findings with clear severity ranking
iFactory Thermal Analytics Architecture — From Infrared Pixel to Maintenance Work Order
Deploying AI-enhanced thermal monitoring across electrical equipment requires an architecture that bridges the thermal sensor layer — fixed IR cameras, drone-mounted imagers, and handheld devices — with the analytics layer where AI models, temperature trending, and maintenance integration operate. iFactory AI is designed for this multi-modal thermal data integration, with native support for thermal image ingestion, AI model training, and CMMS workflow automation in a single unified platform.
Thermal Data Ingestion Layer
Fixed thermal cameras stream radiometric JPEG or RTSP video to edge gateways at configurable intervals from 30 seconds to 60 minutes. Drone survey thermal images are uploaded post-flight with GPS-tagged position data for automated registration. Handheld thermography images are imported through the iFactory mobile app with inspection route mapping. All thermal data is stored with full radiometric metadata, enabling retrospective temperature analysis at any pixel coordinate.
AI-Based Hot Spot Detection and Classification
AI models analyze every thermal image using computer vision to identify electrical equipment within the frame, extract temperature data at each connection point, and classify thermal anomalies against severity thresholds. Object detection models learn the physical layout of each switchgear lineup, MCC bucket, or transformer tank wall and automatically register temperature measurement regions of interest for consistent time-series trending.
Temperature Trend Analysis and Load Correlation
Time-series temperature data for each monitored connection is analyzed against load current data from SCADA or metering systems. AI models learn the normal load-temperature relationship for each connection and flag deviations that indicate resistive heating from connection degradation rather than expected load-driven temperature variation. Temperature rise rate analysis distinguishes gradual degradation from sudden fault progression.
Alerting, Work Order Generation, and Reporting
When AI analytics detect a thermal anomaly exceeding configured severity thresholds, the platform generates an alert with asset-specific context — equipment tag, connection point, temperature rise value, load current, trend direction, and infrared image with anomaly highlighted. Alerts can be configured to generate CMMS work orders automatically for conditions requiring corrective action, with priority level based on temperature rise severity and asset criticality.
Ready to move from periodic thermography to continuous AI-enhanced thermal monitoring? Book a Demo with iFactory's electrical monitoring team for a site-specific assessment of your thermal monitoring gaps and recommended deployment pathway.
Thermal Monitoring Deployment Roadmap — From Assessment to Full Coverage
Deploying AI-enhanced thermal monitoring across electrical equipment follows a structured four-phase methodology that delivers incremental value at each stage while building toward comprehensive infrastructure coverage. iFactory's deployment framework has been validated across power generation, petrochemical, and data center facilities in North America.
Thermal Monitoring Gap Assessment and Asset Prioritization
Comprehensive review of existing thermography program — survey interval, asset coverage, findings history, and corrective action closure rate. Prioritization of electrical assets by failure consequence, historical failure rate, and current monitoring gap. Fixed camera placement planning for switchgear, MCC, and transformer locations; drone survey route planning for substation and outdoor equipment.
Fixed Camera Installation and Drone Survey Deployment
Installation of fixed thermal camera arrays at prioritized switchgear rooms, MCC areas, transformer locations, and cable termination zones. Camera positioning optimized for line-of-sight to target connections with appropriate field of view for the asset configuration. Configuration of drone-based thermal survey routes with automated GPS waypoint navigation for repeatable survey consistency and image registration.
AI Model Training and Baseline Establishment
Two-week baseline data collection period establishes normal temperature profiles for every monitored connection point across the full range of loading conditions. AI models are trained on asset-specific thermal signatures, object detection is validated for correct connection region identification, and load-temperature correlation models are calibrated against SCADA data. Severity thresholds are configured based on facility-specific electrical safety standards.
Dashboard Activation and Continuous Operation
iFactory thermal monitoring dashboard configured with real-time asset health view, temperature trend charts, alert timeline, and work order integration. Maintenance team onboarding with role-based dashboard access and mobile app deployment for handheld thermography integration. Continuous operation with monthly model retraining as new thermal data accumulates and corrective action outcomes provide labeled training events.
Measurable ROI — What AI-Enhanced Thermal Monitoring Delivers
The financial case for AI-enhanced thermal monitoring of electrical equipment is built on three primary value drivers: avoided electrical failure costs from continuous detection of developing hot spots, reduced thermography contractor spend through automation of routine surveys, and extended equipment life through early intervention on preventable degradation mechanisms.
Electrical Failure Avoidance
- Continuous thermal monitoring detects loose connections and hot spots 2-8 weeks before failure threshold
- Switchgear fault, cable failure, and transformer damage avoided through early intervention
- Emergency outage costs of $50,000-500,000 avoided per significant electrical event
- Arc flash incident prevention through proactive connection maintenance before failure
Contractor Spend Reduction
- Fixed camera arrays replace 60-80% of routine handheld thermography survey contractor spend
- Drone-based surveys cover outdoor substation equipment at 80% lower cost than bucket-truck scaffold access
- Annual thermography audit scope reduced to validation and non-covered equipment only
- Typical annual savings of $25,000-80,000 on thermography contractor costs per facility
Equipment Life Extension
- Early detection of insulation degradation enables corrective action before permanent damage progression
- Connection maintenance performed during planned outages based on AI-detected condition trends
- Transformer bushing replacement planned with adequate lead time vs. emergency bushing failure response
- Extended service life of switchgear, MCCs, and transformers through condition-based maintenance
Performance Benchmarks — Before and After AI Thermal Monitoring
Measuring the business impact of AI-enhanced thermal monitoring requires KPIs spanning detection performance, maintenance cost avoidance, and deployment scalability. The benchmark table below provides the performance metrics iFactory tracks for each electrical asset category, with representative before-and-after ranges from industrial facility deployments.
| Asset Category | KPI Tracked | Baseline (Periodic Thermography) | With iFactory AI Continuous Monitoring | Primary Value Driver |
|---|---|---|---|---|
| Switchgear Connections | Hot spot detection lead time | 0 days (detected at annual survey or failure) | 2-8 weeks before failure threshold | Planned connection maintenance vs. arc flash event |
| Transformer Bushings | Bushing temperature anomaly detection | Quarterly or annual IR survey only | Continuous real-time per-bushing monitoring | Bushing replacement planned vs. catastrophic failure |
| MCC Buckets | Thermal anomaly detection rate | 10-15% of connections surveyed per year | 100% of connections monitored continuously | Full coverage eliminates blind spots |
| Cable Terminations | Temperature rise trend detection | Not monitored between surveys | Daily trend analysis for every termination | Connection failure prevented weeks in advance |
| Electrical Infrastructure | Annual thermography spend | $25,000-80,000 in contractor surveys | $5,000-15,000 validation surveying only | 60-80% reduction in external survey cost |
| Critical Connections | Monitoring coverage | 5-15% of critical connections monitored continuously | 90-100% of critical connections monitored | Fleet-wide thermal visibility |
Industry Perspective — AI Thermal Monitoring in Electrical Reliability Programs
"I spent nineteen years managing electrical reliability programs across three petroleum refineries and two chemical manufacturing complexes. Our thermography program was considered best-in-class by industry standards — certified Level 3 thermographers, quarterly surveys of all critical electrical equipment, digital report generation with trend comparison. The gap we never acknowledged in our program reviews was the time between surveys. A connection that started developing a hot spot on day two of the quarter had ninety days to progress before our next scheduled survey would detect it. In that window, the temperature rise could advance from a 10°C developing condition to a 40°C critical condition that required an emergency shutdown to repair. Over nineteen years, I can identify ten significant electrical failures that were found in the post-incident investigation to have detectable thermal precursors that appeared in the survey gap window — every one of them avoidable with continuous monitoring technology that existed at the time but was not deployed because the business case was built around the cost of cameras and connectivity rather than the cost of failures. The economics have flipped. Fixed thermal camera arrays with AI analytics now deliver continuous monitoring at a per-point cost that is lower than the annualized cost of periodic handheld surveys for any facility with more than 200 critical electrical connections. The technology gap is closed. The adoption gap remains."
Deploy AI-Enhanced Thermal Monitoring Across Your Electrical Infrastructure
From switchgear hot spot detection to transformer bushing monitoring and cable termination trending — iFactory AI delivers the complete continuous thermal monitoring intelligence stack for electrical equipment in one platform built for industrial reliability programs.
The Gap Between Periodic Thermography and Continuous Thermal Monitoring Is the Gap Between Reaction and Prevention
Electrical equipment failures that produce detectable thermal anomalies before catastrophic failure are failures of monitoring frequency — not failures of available technology. The 180-to-364-day data gap between periodic handheld thermography surveys represents a risk window in which developing connection degradation, insulation breakdown, and overload conditions progress from incipient to critical without visibility. Fixed thermal camera arrays with AI analytics close this gap permanently, delivering continuous temperature monitoring for every critical electrical connection at a per-point cost that is competitive with periodic survey programs for any facility with more than 200 monitored connections.
The AI analytics layer transforms the continuous thermal data stream from all monitored connections into actionable condition intelligence — hot spot detection with severity classification, load-normalized temperature trending, and automated work order generation — with enough lead time for planned corrective action before failure. iFactory AI provides the integrated platform that connects fixed thermal cameras, drone surveys, and handheld thermography into a unified thermal monitoring dashboard with AI-driven analytics and CMMS maintenance workflow integration. Book a Demo with iFactory's electrical monitoring team to build a site-specific continuous thermal monitoring assessment for your electrical infrastructure.
Deploy AI-Enhanced Continuous Thermal Monitoring for Your Electrical Equipment with iFactory
iFactory registers every thermal camera, monitors electrical connection temperature in real time, detects hot spots and developing faults from AI analytics, and generates maintenance-ready work orders — in one platform built for electrical equipment reliability.
AI-Enhanced Thermal Imaging for Electrical Equipment — Frequently Asked Questions
Conventional infrared thermography relies on a certified thermographer conducting periodic walk-down surveys with a handheld thermal camera — typically on an annual or semi-annual schedule. The thermographer visually inspects each thermal image, identifies hot spots based on experience, and records temperature readings in a report. AI-enhanced thermal monitoring replaces this manual periodic approach with fixed thermal cameras that stream continuous thermal data to AI analytics platforms. The AI performs automated object detection to identify equipment within the frame, extracts temperature data from every connection point, classifies anomalies against learned baselines, and trends temperature over time with load current correlation. The critical difference is continuity: AI-enhanced monitoring detects developing faults day or night, regardless of survey schedule, and provides consistent detection logic across all monitored assets without reliance on individual thermographer expertise.
The electrical industry standard for thermographic anomaly classification follows temperature rise above ambient — the difference between the connection temperature and the ambient air temperature at the equipment location. A temperature rise of 1°C to 10°C above ambient is classified as a developing condition requiring monitoring during the next scheduled survey. A rise of 10°C to 20°C indicates a probable deficiency requiring investigation and corrective action planning. A rise of 20°C to 40°C indicates a serious deficiency requiring immediate corrective action. A rise greater than 40°C indicates a critical deficiency requiring emergency shutdown and immediate repair. These thresholds are guidelines and should be adjusted based on equipment type, connection configuration, loading conditions, and facility-specific electrical safety standards. iFactory's AI platform applies these standard thresholds with load-normalized adjustments — a connection at 80% loading producing a 15°C rise is classified differently than the same connection at 30% loading with the same rise.
A complete fixed thermal camera deployment for electrical equipment monitoring — including cameras, edge gateways, iFactory AI platform license, and installation — typically ranges from $40,000 to $180,000 depending on the number of camera nodes and the scope of electrical infrastructure covered. A single fixed thermal camera with AI analytics covers a standard switchgear lineup of 10 to 20 cubicles or an MCC section of 8 to 15 buckets, providing continuous monitoring for 20 to 60 electrical connection points per camera. The per-connection monitoring cost for a fixed camera deployment ranges from $15 to $40 per connection per year over a five-year equipment life — competitive with or lower than the per-connection cost of annual handheld thermography surveys for any facility with more than 200 critical connections. The payback period from avoided electrical failure costs alone is typically 8 to 16 months for most industrial facilities.
Yes. iFactory's thermal analytics platform supports drone-based thermal imaging as a complementary data source alongside fixed camera monitoring. Drone thermal images with GPS position metadata are uploaded to the iFactory platform post-flight, where AI models automatically register each image to the equipment asset register, extract temperature data at identified connection points, and append the readings to the continuous trend history for each asset. This hybrid architecture — fixed cameras for indoor and high-density equipment areas, drone surveys for outdoor and distributed equipment — provides complete thermal monitoring coverage across the entire electrical infrastructure at the lowest total cost.
iFactory's thermal analytics platform integrates with existing electrical preventive maintenance programs through multiple integration points. The platform connects to the facility's CMMS to receive the existing equipment asset register, preventive maintenance schedule, and historical work order data. When AI analytics detects a thermal anomaly exceeding configured severity thresholds, the platform generates a work order in the CMMS with asset-specific context — equipment tag, connection point, temperature rise value, load current, trend chart, and annotated infrared image. The work order priority is set automatically based on the severity classification. Completed work order findings — confirmed loose connection, insulation damage, etc. — are fed back to the AI model as labeled training data to improve detection accuracy over time. The platform also generates monthly thermal monitoring summary reports that document all detected anomalies, corrective actions taken, and trend data for inclusion in the facility's electrical preventive maintenance records and regulatory compliance documentation.