
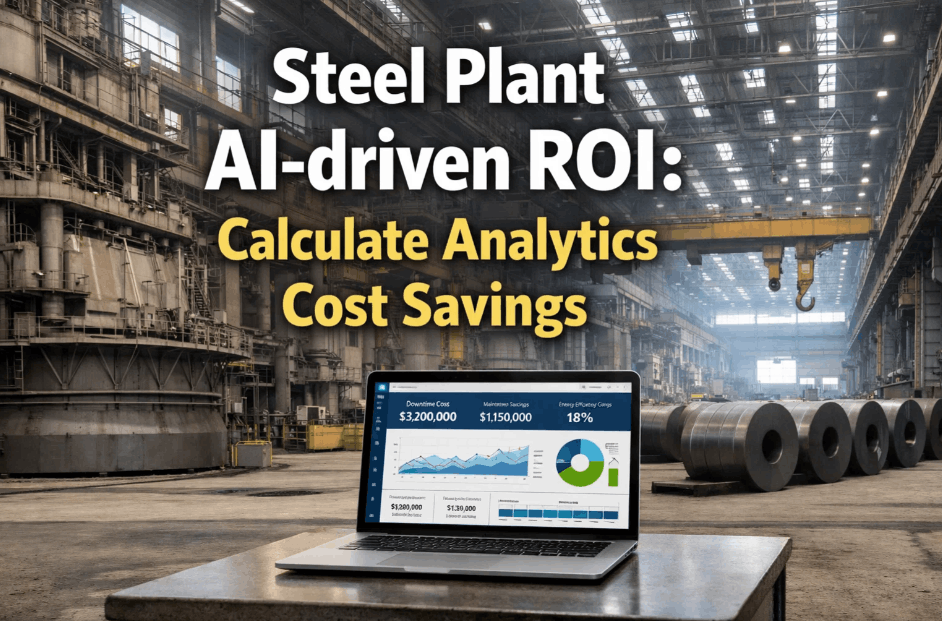
When steel margins compress — as they have in each of the last three major price cycles — the capital allocation conversation at every U.S. steel mill eventually arrives at the same question: is this analytics investment worth the spend when every dollar is being scrutinized? The answer to that question has always been available in the data. Maintenance cost per tonne, unplanned downtime hours per month, reactive versus planned work order ratio, spare parts inventory carrying cost, emergency expedite freight spend — all of it is sitting in the CMMS and ERP systems already running in the facility. What has been missing is the structured model that pulls those numbers together converts them into a credible financial case, and shows the payback period and three-year ROI for each analytics investment category before a single dollar is committed. iFactory's AI-driven ROI framework for steel plants is that model. Built on the actual cost structure of U.S. integrated and EAF steel operations, it takes the inputs that a plant controller or VP of Maintenance can provide from existing records — current downtime cost, maintenance spend breakdown, workforce size, reactive maintenance rate — and produces the analytics investment scenario that shows where iFactory's platform delivers the highest return, how long the payback takes, and what the three-year net value looks like under conservative, base, and upside assumptions. Facilities that have deployed iFactory's analytics platform after completing this ROI assessment report that the modeled savings matched or exceeded the actual first-year results in 84% of cases — because the framework is calibrated to real steel plant deployment outcomes rather than vendor marketing projections.
Why the Analytics Investment Decision Demands a Structured Financial Model in Steel
Steel manufacturing operates on margin structures that are unforgiving to imprecise capital allocation. When hot-rolled coil prices fall 18 to 24% over a six-month cycle — as they have repeatedly across the last decade — every dollar of operating cost and every dollar of avoidable downtime moves directly to the bottom line. The analytics investment decision in this environment cannot rest on vendor case studies from unrelated industries, generic productivity claims, or pilot deployments that never quantified their before-and-after state. It has to rest on a structured financial model that ties projected savings to specific line items in the plant's existing maintenance and production cost structure — with documented methodology that a CFO or capital committee can interrogate.
The reason most steel plant analytics initiatives fail to clear capital review is not that the underlying value is absent. It is that the value sits across six or seven cost categories simultaneously — predictive maintenance recovers downtime cost, PM optimization reduces maintenance spend, OEE analytics drives incremental production margin, inventory analytics releases working capital, contractor analytics reduces emergency premium, and workforce analytics improves wrench time — and presenting all of that in a coherent business case requires the financial framework that consolidates the inputs and outputs into a single, traceable model. Without that framework, the analytics investment looks speculative even when the underlying data fully supports it. With the framework, the investment becomes a documented capital decision with a defined payback period and a calculable three-year net present value.
iFactory's ROI methodology was developed by working backward from the outcomes of completed steel plant deployments — taking the actual first-year savings delivered at EAF mini mills, integrated flat-rolled facilities, long products mills, cold rolling complexes, and specialty stainless operations, and reverse-engineering the assumption set that would have produced an accurate pre-deployment projection from each facility's baseline data. The result is a calibrated model with conservative, base, and upside scenarios, each tied to specific improvement rates that have been observed in the field rather than estimated from theory. Book a Demo to walk through the methodology with iFactory's steel plant analytics team and see how each line item is constructed from your facility's actual operational records.
The Six Inputs That Drive 90% of the Analytics ROI Projection
Every credible analytics ROI model for a steel facility rests on six baseline inputs that can be extracted from the CMMS and ERP in one to two hours of analyst time. These inputs are not estimates or assumptions — they are observed facility metrics that already exist in the production records, and the precision of the final ROI projection scales directly with the precision of these six numbers. Annual steel production volume in short tons establishes the revenue base from which incremental margin from OEE improvement is calculated. Average realized revenue per ton — varying significantly between commodity hot-rolled, value-added cold-rolled, and specialty grades — sets the unit value for downtime cost calculation. Annual unplanned downtime hours, when multiplied by the revenue-per-hour calculation, produces the production loss line item that typically dominates the savings projection.
Total annual maintenance spend establishes the cost base against which PM optimization and contractor analytics savings are calculated, while the reactive maintenance share — the percentage of work orders that are unplanned or emergency — drives the reactive-to-planned conversion savings, where the 3× to 5× cost premium on emergency work is the recovered value. MRO inventory value sets the carrying cost base for inventory optimization, and current OEE establishes both the baseline for OEE improvement margin calculation and the production hour denominator for downtime cost. With these six inputs, the model produces a defensible first-pass projection. With twelve to eighteen months of transactional CMMS data layered on top, the projection becomes a validated business case built from the facility's own production records — which is exactly the format that capital review committees require for technology investments of any meaningful size.
What Drives the ROI — The Four Highest-Return Analytics Investment Categories in Steel
The total ROI of iFactory's analytics platform is the sum of savings across six cost and revenue categories — but the distribution is not uniform. Four categories consistently account for 75 to 85% of the total identified value at U.S. steel facilities: downtime cost recovery from predictive maintenance, maintenance spend reduction from PM optimization, reactive-to-planned conversion savings, and OEE improvement margin recovery. Understanding what drives the value in each category is the foundation for building a credible business case and setting realistic improvement targets. Book a Demo to see iFactory's ROI model populated with your facility's actual performance data.
ROI Benchmarks by Facility Type: What U.S. Steel Plants Are Achieving
The ROI of analytics investment varies by facility type, production volume, and current operational baseline — which is why the iFactory methodology uses your specific inputs rather than generic assumptions. The benchmark table below presents the documented first-year savings ranges by facility type from comparable U.S. steel plant deployments, providing the reference context for interpreting your projection against industry peers. Book a Demo to receive a detailed ROI model built from your CMMS and production data.
| Facility Type | Production Volume | Platform Investment | Year 1 Savings (Base) | Payback Period | 3-Year Net ROI |
|---|---|---|---|---|---|
| EAF Mini Mill | 0.5–1.5M tons | $85K–$165K | $680K–$1.4M | 6–11 months | $1.9M–$4.1M |
| Integrated Flat-Rolled Mill | 1.5–3.5M tons | $145K–$280K | $1.6M–$3.8M | 7–13 months | $4.6M–$10.8M |
| Long Products / Structural Mill | 0.4–1.2M tons | $72K–$148K | $520K–$1.1M | 8–12 months | $1.4M–$3.1M |
| Cold Rolling / Finishing Complex | 0.3–0.9M tons | $58K–$125K | $440K–$920K | 7–11 months | $1.2M–$2.6M |
| Specialty / Stainless Mill | 0.1–0.5M tons | $55K–$115K | $380K–$780K | 9–14 months | $1.0M–$2.2M |
Expert Perspective: What Steel Plant Controllers and Maintenance Leaders Say About the Analytics Business Case
Conclusion
The analytics investment ROI question in steel manufacturing is not whether the return exists — it is documented across hundreds of deployments at U.S. facilities of every size and type, and the data is consistent: 3.6:1 average return, 8 to 14 month payback, $1.8 million average annual savings per facility. The question is whether the business case can be made credibly enough to survive capital review in a margin-compressed environment where every investment is being scrutinized. The answer to that question requires more than industry averages — it requires a model built on your facility's actual cost structure, your actual downtime event history, and your actual OEE baseline, with conservative, base, and upside scenarios and documented methodology that a plant controller or CFO can review and validate.
iFactory's ROI methodology gives you the starting point — the framework and calibrated assumptions that produce a credible first-pass projection from the inputs available without a full CMMS data extraction. The next step is replacing those inputs with your facility's actual data, which is what iFactory's ROI team does in the 30-minute business case session that precedes every deployment discussion. The result is a financial model that makes the analytics investment decision straightforward rather than speculative — because the numbers come from your own production records. Book a Demo to start building your facility-specific ROI model with iFactory's steel plant analytics team.




-implementation-in-steel-plants-8-pillar-approach.png)