Steel producers choosing between a blast furnace-basic oxygen furnace (BF-BOF) route and an electric arc furnace (EAF) route are increasingly making a carbon decision as much as a cost decision. The two routes differ by multiples in tonnes of CO2 per tonne of steel, and that differential is shaped by scrap availability, iron ore reduction chemistry, and the carbon intensity of the regional electricity grid. Scope 1 emissions dominate the BF-BOF route through coke-based reduction, while EAF emissions shift largely into Scope 2 through purchased power. Getting this comparison right before locking in a route or a capacity expansion matters more with every passing reporting cycle. Melters and sustainability teams comparing their own route mix against reporting requirements can walk through a carbon intensity breakdown with the iFactory AI team.
BF-BOF vs EAF: Where the Carbon Intensity Gap Actually Comes From
iFactory AI tracks route-level energy, scrap, and grid data so your Scope 1 and Scope 2 numbers reflect what each furnace is actually doing, not an industry average.
Why BF-BOF and EAF Diverge on Carbon
The two routes are not variations on the same process. They reduce iron through entirely different chemistry, which is the real source of the carbon gap long before electricity or scrap enter the picture.
Coke-Based Reduction
A blast furnace reduces iron ore with coke, releasing carbon as an unavoidable byproduct of the chemistry itself. This is a Scope 1 emission baked into the process, not an input choice that can be swapped out.
Electricity-Based Melting
An EAF melts scrap or direct-reduced iron using electric arcs. Its direct process emissions are small, but the furnace draws heavily on grid power, pushing most of its footprint into Scope 2.
Feedstock Dependency
BF-BOF relies on iron ore and coking coal regardless of scrap markets. EAF performance depends on steady access to scrap or DRI, which varies by region and by year.
Neither route is universally better. The right comparison always has to be run against your own feedstock access and your own grid, not a generic industry figure. Map your own route intensity with the iFactory AI team.
Carbon Intensity by Route: The Core Comparison
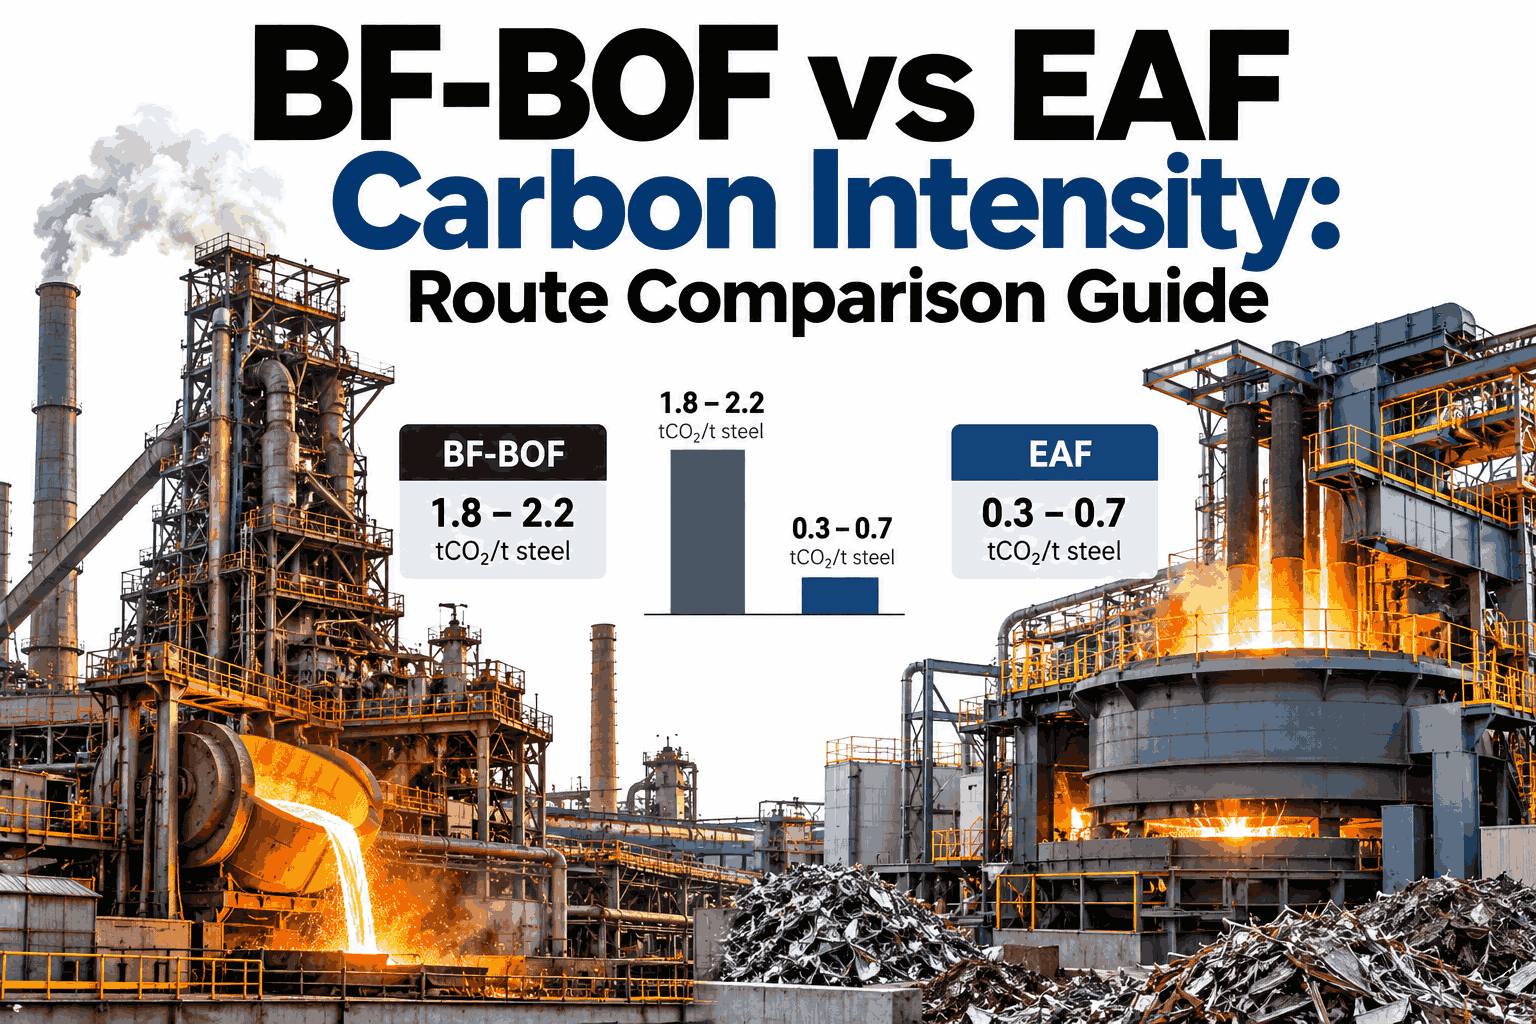
Industry literature consistently places BF-BOF well above EAF on tonnes of CO2 per tonne of crude steel, though the EAF figure swings widely depending on the grid behind it.
BF-BOF Route
EAF Route
These figures are illustrative ranges drawn from widely cited steel decarbonization literature, not a substitute for a facility-specific calculation against your own fuel mix and grid data.
See Your Own Route Intensity, Not an Industry Average
Book a 30-minute session and walk through how iFactory AI pulls furnace-level energy, scrap, and grid data into one Scope 1 and Scope 2 picture.
What Actually Drives the Gap Between the Two Routes
The headline BF-BOF versus EAF comparison hides a handful of variables that move the real number for any single plant up or down significantly.
Reduction Chemistry
Coke-based reduction in a blast furnace sets a carbon floor that process efficiency gains can trim but not eliminate without a fundamentally different reduction pathway.
Scrap Quality and Availability
An EAF running on clean, high-grade scrap needs less energy per tonne than one blending in lower-grade scrap or supplementing with direct-reduced iron.
Grid Electricity Intensity
The single biggest swing factor for EAF carbon intensity is what generates the power behind it, from coal-heavy grids to largely renewable ones.
Secondary Metallurgy Load
Ladle furnace time, alloy additions, and reheating for specific grades add energy draw on top of the primary melt, shifting the per-tonne number for specialty steels.
Fuel Mix at the BF-BOF Plant
Coke rate, pulverized coal injection levels, and byproduct gas recovery all move a blast furnace's number within its own route band, even without switching routes.
Most of these variables are measurable in real time once energy, scrap, and process data are actually connected, rather than reconstructed from monthly utility bills and purchase orders.
Scrap Availability Shapes the EAF Side of the Comparison
An EAF's carbon advantage only holds up when scrap is actually available at the volume and quality the furnace needs. Where that breaks down, the comparison shifts.
| Scrap Market Condition | Typical Effect on EAF Feed | Carbon Implication |
|---|---|---|
| Abundant, high-grade scrap | Near-full scrap charge, minimal DRI blend | EAF intensity stays near the low end of its range |
| Tight scrap supply | Blended with pig iron or imported scrap | Energy per tonne rises, pushing intensity up |
| Low-grade or mixed scrap | Higher melt energy, more slag to process | Moderate increase versus clean scrap charges |
| DRI-supplemented feed | Direct-reduced iron fills the scrap gap | Depends heavily on how the DRI itself was reduced |
| Regional scrap scarcity | Longer transport distances for scrap sourcing | Adds logistics emissions outside the furnace itself |
A route decision made on a single year's scrap price can look very different three years later when the local scrap market has tightened or loosened. Model your scrap sensitivity with the iFactory AI team.
Grid Intensity Tiers and Their Effect on EAF Footprint
Because EAF emissions sit mostly in Scope 2, the carbon intensity of the grid supplying the furnace matters as much as anything happening inside the plant.
Hydro, Nuclear or High Renewable Share
EAF intensity can sit near the bottom of the typical range, making the route gap against BF-BOF look dramatic rather than incremental.
Blended Fossil and Renewable Generation
Intensity lands in the middle of the EAF range and tends to shift gradually as the grid's generation mix changes year to year.
Coal as the Dominant Source
EAF intensity rises toward the top of its typical band, narrowing the gap against BF-BOF far more than most route comparisons assume.
A facility's own EAF emissions figure is only as reliable as the grid intensity data feeding into it, which is why static annual averages often understate real variability.
A Composite Scenario: Reweighting Feedstock Mix
A composite EAF facility increased its scrap share and shifted toward a lower-carbon grid supply contract over one reporting cycle. The figures below are an illustrative composite, shown as a relative index with the starting point set at 100.
The scrap-share increase moved intensity down faster than the grid contract alone would have, showing why route comparisons need to track more than one variable at a time.
Route Decision Self-Check
Use these ten checks before treating a BF-BOF versus EAF comparison as settled for your own plant or capacity plan.
Each unchecked box is a place where a route comparison looks cleaner on paper than it actually is on the floor.
Frequently Asked Questions
Is EAF always lower carbon than BF-BOF?
In most cases yes, but not universally. On a coal-heavy grid with a tight scrap market, EAF intensity can climb toward the upper end of its range, narrowing the gap against BF-BOF more than a generic comparison would suggest. Check where your own facility sits.
Why does EAF carbon intensity vary so much between plants?
Because most EAF emissions are Scope 2, tied to purchased electricity, intensity depends heavily on the generation mix behind the local grid connection. Two otherwise identical furnaces on different grids can report very different numbers.
How does scrap quality affect the comparison?
Lower-grade or mixed scrap requires more melt energy and more secondary processing, which raises EAF intensity even on the same grid. Clean, high-grade scrap keeps the route's carbon advantage closer to its best-case figures.
Can BF-BOF intensity be reduced without switching routes?
Yes, within limits. Coke rate optimization, pulverized coal injection, and byproduct gas recovery can trim intensity inside the BF-BOF band, though the route's structural carbon floor stays well above EAF's typical range. Discuss operational levers for your furnace.
What data does a facility need to run this comparison accurately?
Furnace-level energy consumption, scrap and DRI feedstock ratios, grid emission factors, and secondary metallurgy load, tracked continuously rather than reconstructed from monthly bills. iFactory AI connects these sources into one Scope 1 and Scope 2 view.
Run This Comparison Against Your Own Furnace Data
iFactory AI connects energy, scrap, and grid data from your own plant so Scope 1 and Scope 2 figures reflect reality, not an industry average. Book a walkthrough built around your route.