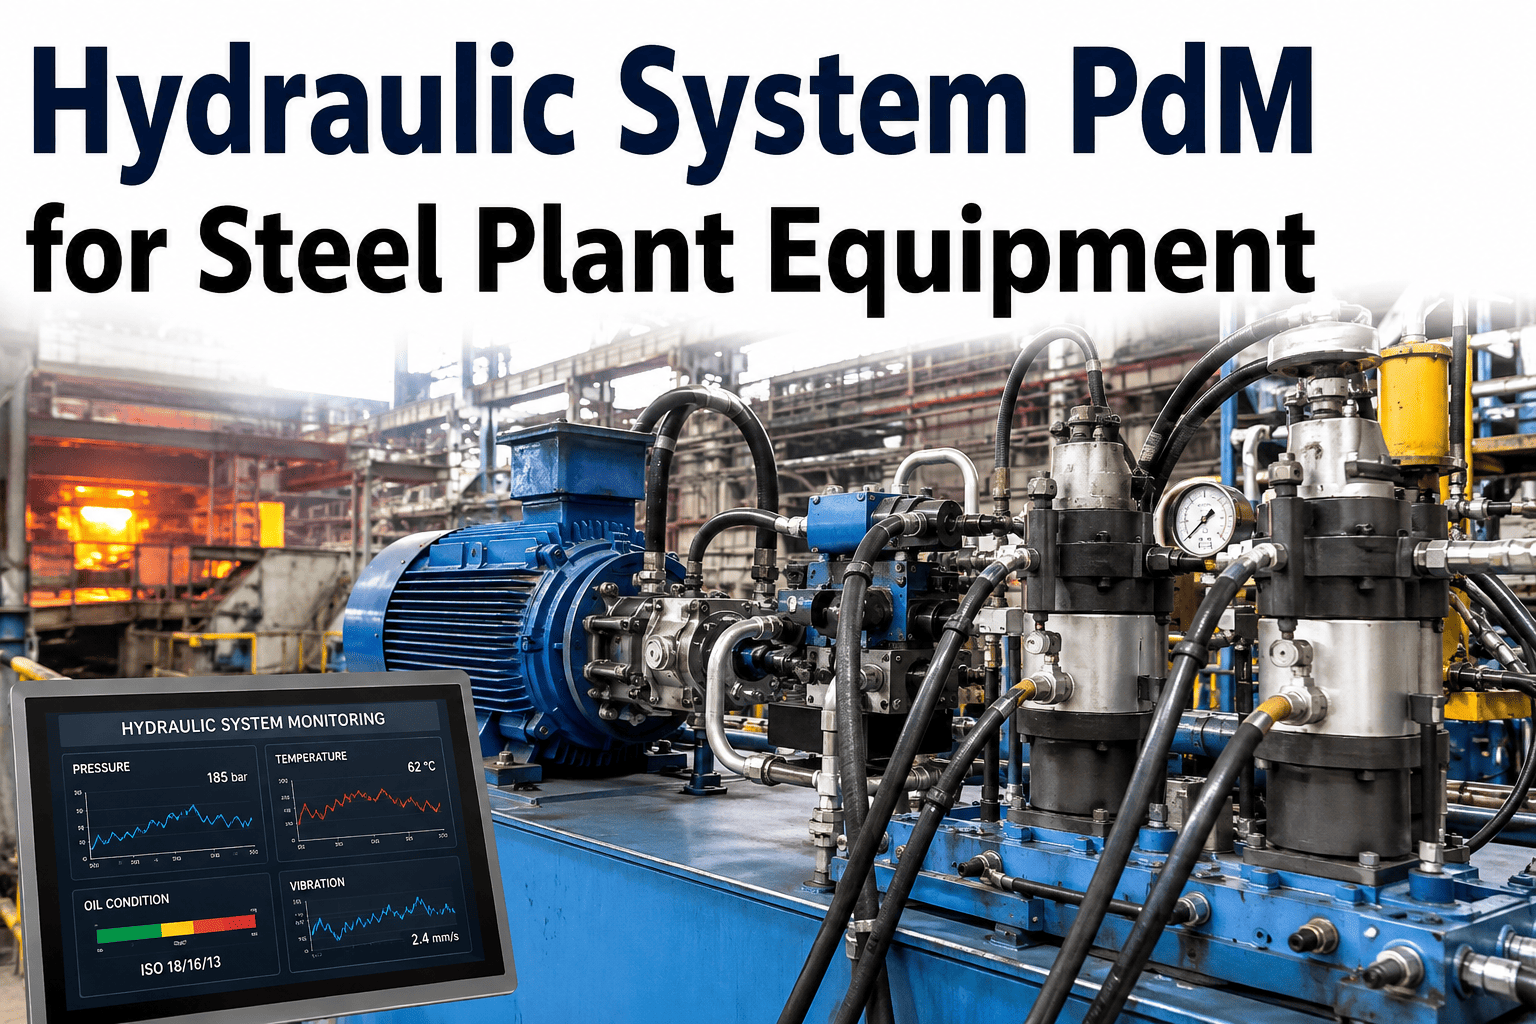
Every mill stand, every caster segment, and every coiler in the plant depends on a hydraulic system that most maintenance teams only think about when a pump fails or a cylinder starts leaking. Oil quality is the leading indicator behind nearly every hydraulic failure, yet particle count, viscosity, and water content are usually checked on a fixed lab sampling schedule that can run weeks behind what is actually happening inside the reservoir. Hydraulic maintenance teams that want to catch pump and valve degradation before a line stoppage can book a demo to see how continuous oil condition monitoring closes that gap.
Know Your Hydraulic Oil Is Degrading Before a Pump Fails
AI models built on particle count, viscosity, and pressure signature data give hydraulic maintenance teams continuous visibility into pump and valve health, instead of relying on a lab report that arrives days after the sample was drawn.
Why Oil Quality Drives Nearly Every Hydraulic Failure
Pumps and valves rarely fail because of a design flaw. They fail because the fluid carrying the load stopped doing its job — and by the time that shows up as a leak or a pressure drop, the damage inside the component is already done.
Lab Sampling vs Continuous Monitoring
A quarterly lab sample tells you what your oil looked like on the day it was drawn. It says nothing about what happened in the three months since, or the three months before the next sample is due.
| Parameter | Lab Sampling | Continuous AI Monitoring | Detection Lag Avoided |
|---|---|---|---|
| Particle Count (ISO Code) | Monthly or quarterly | Continuous inline | 4–12 weeks |
| Water Content | Monthly or quarterly | Continuous inline | 4–12 weeks |
| Viscosity | Quarterly | Continuous inline | 8–12 weeks |
| Pump Pressure Signature | Rarely trended manually | Continuous, real time | Not previously tracked |
See What Your Last Three Oil Reports Were Already Warning You About
Share your recent lab sample history for any hydraulic system. iFactory engineers will show you what a continuous monitoring model would have flagged between those sampling dates.
From Contaminated Oil to a Scheduled Fix
Detecting degraded oil is only useful if it leads to action before a pump or valve is damaged. iFactory ties oil condition data directly into a maintenance workflow.
What a Prevented Pump Failure Is Worth
A hydraulic pump failure on a mill stand or caster segment does not stay contained to the pump. It usually takes the whole hydraulic circuit, and often the process line, down with it.
Choosing the Right Sensors for Your Hydraulic Fleet
Not every hydraulic circuit in a steel plant needs the same level of instrumentation, and treating them all identically is one of the most common ways a monitoring budget gets spent inefficiently. The right starting point is grouping circuits by consequence of failure rather than by size or oil volume, since a small hydraulic unit tied directly to caster segment actuation can carry far more downside risk than a much larger system supporting a less critical process.
For the highest-consequence circuits, a full sensor package covering particle count, water content, viscosity, and pressure signature gives the most complete picture and the earliest possible warning across every major failure mode. For circuits with lower consequence or existing redundancy, a lighter package focused on particle count and water content alone often captures most of the practical value at a fraction of the cost, with periodic lab sampling filling in the rest of the picture.
Retrofit complexity varies significantly depending on how the existing hydraulic power unit was designed. Systems with an accessible sample port and a return line that can accommodate an inline sensor block are usually straightforward, often completed within a single shift. Older systems without a convenient sample point may require a small plumbing modification, which is worth scoping during a site walk-through before committing to a rollout timeline, so the maintenance team isn't caught off guard by an unplanned circuit modification mid-project.
Filtration strategy and monitoring strategy work best when planned together rather than separately. A system with an undersized or aging filter will show contamination trends regardless of how good the monitoring is, and in some cases the most cost-effective first step is upgrading filtration on a circuit before adding sensors, rather than paying to continuously monitor a problem that better filtration would have prevented in the first place.
Once the highest-priority circuits are instrumented and the alerting workflow is proven, expanding to the rest of the hydraulic fleet becomes a much easier internal conversation, because the maintenance team already has real examples of what an early contamination or viscosity alert looks like and what it prevented. That track record, built on your own equipment rather than a generic case study, is usually what moves a pilot into a plant-wide standard.
What Good Oil Condition Data Looks Like Over Time
A single oil reading, whether from a lab sample or an inline sensor, tells you very little on its own. Particle count, viscosity, and water content all have some normal range of variation depending on ambient temperature, recent maintenance activity, and duty cycle, and a maintenance team that reacts to every individual reading without context will end up chasing noise instead of real developing faults.
The real value shows up in trend lines built from continuous data over weeks and months. A particle count that climbs steadily over six weeks, even if each individual reading stays technically within an acceptable range, is a far stronger signal of developing contamination than a single reading that happens to cross a fixed threshold on one day. This is exactly the kind of pattern that quarterly lab sampling is structurally unable to catch, since there simply aren't enough data points across the year to see the shape of the trend.
Establishing a clean baseline for each hydraulic circuit is the foundation that makes trend-based alerting possible. During the first several weeks after sensor installation, the system collects data across a range of normal operating conditions specific to that circuit, building a picture of what healthy variation actually looks like before it starts flagging deviations. Circuits with highly variable duty cycles take longer to baseline than those running under steady, consistent load, which is worth factoring into rollout timeline expectations.
Once a reliable baseline is established, the most useful alerts are the ones that combine multiple signals rather than relying on any single parameter in isolation. A viscosity shift alone might indicate normal thermal variation, but a viscosity shift combined with a rising particle count and a pressure signature change on the pump paints a much clearer picture of an actual developing fault, and gives the maintenance team far more confidence in prioritising that circuit over others showing only a single, weaker signal.
Frequently Asked Questions
The questions hydraulic maintenance teams most often ask before moving from scheduled lab sampling to continuous monitoring.
Get a Hydraulic Fleet Risk Review
Share your hydraulic system list and recent oil sample history. iFactory engineers will identify which circuits carry the highest contamination and pump failure risk today.