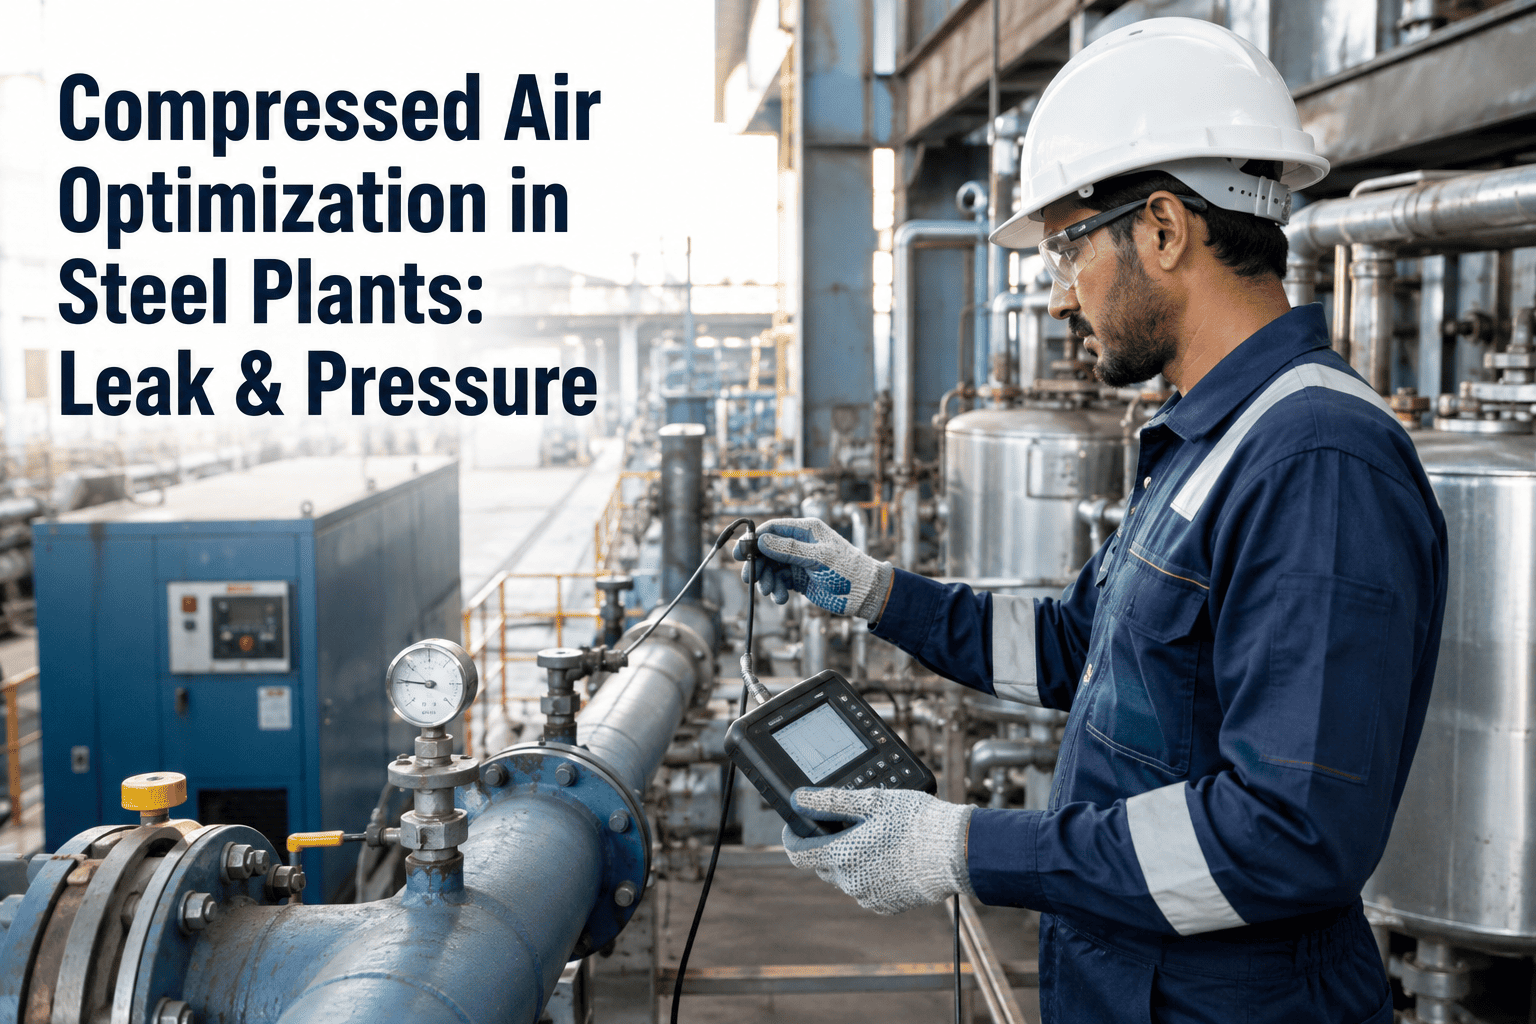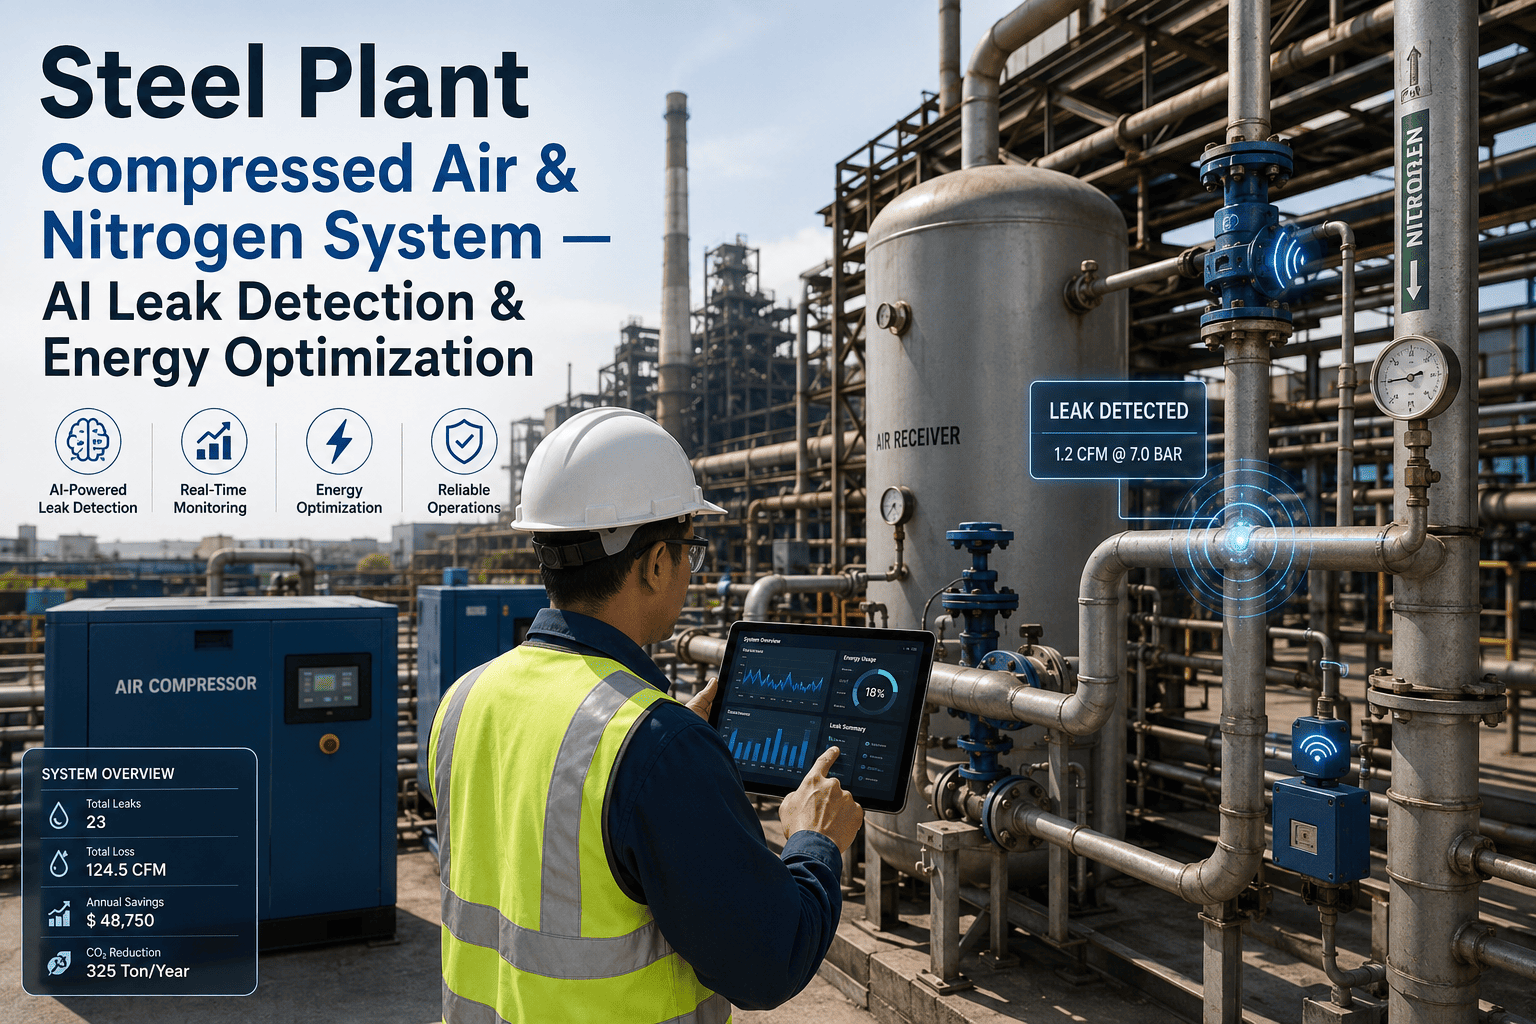
Compressed air looks free at the point of use, which is why it is wasted so easily. Behind every open valve and worn coupling sits a compressor drawing electricity, and most of that energy leaves the machine as heat before any work is done. In a steel plant, air drives tools, actuators, cleaning, instrumentation and process equipment across dozens of units, so small losses repeat everywhere. Fixing them starts with measuring where the air goes, then closing leaks, trimming pressure and cutting avoidable demand. Teams planning that work can see how iFactory AI tracks compressed air energy per tonne on live plant data before scheduling a plant-wide air audit.
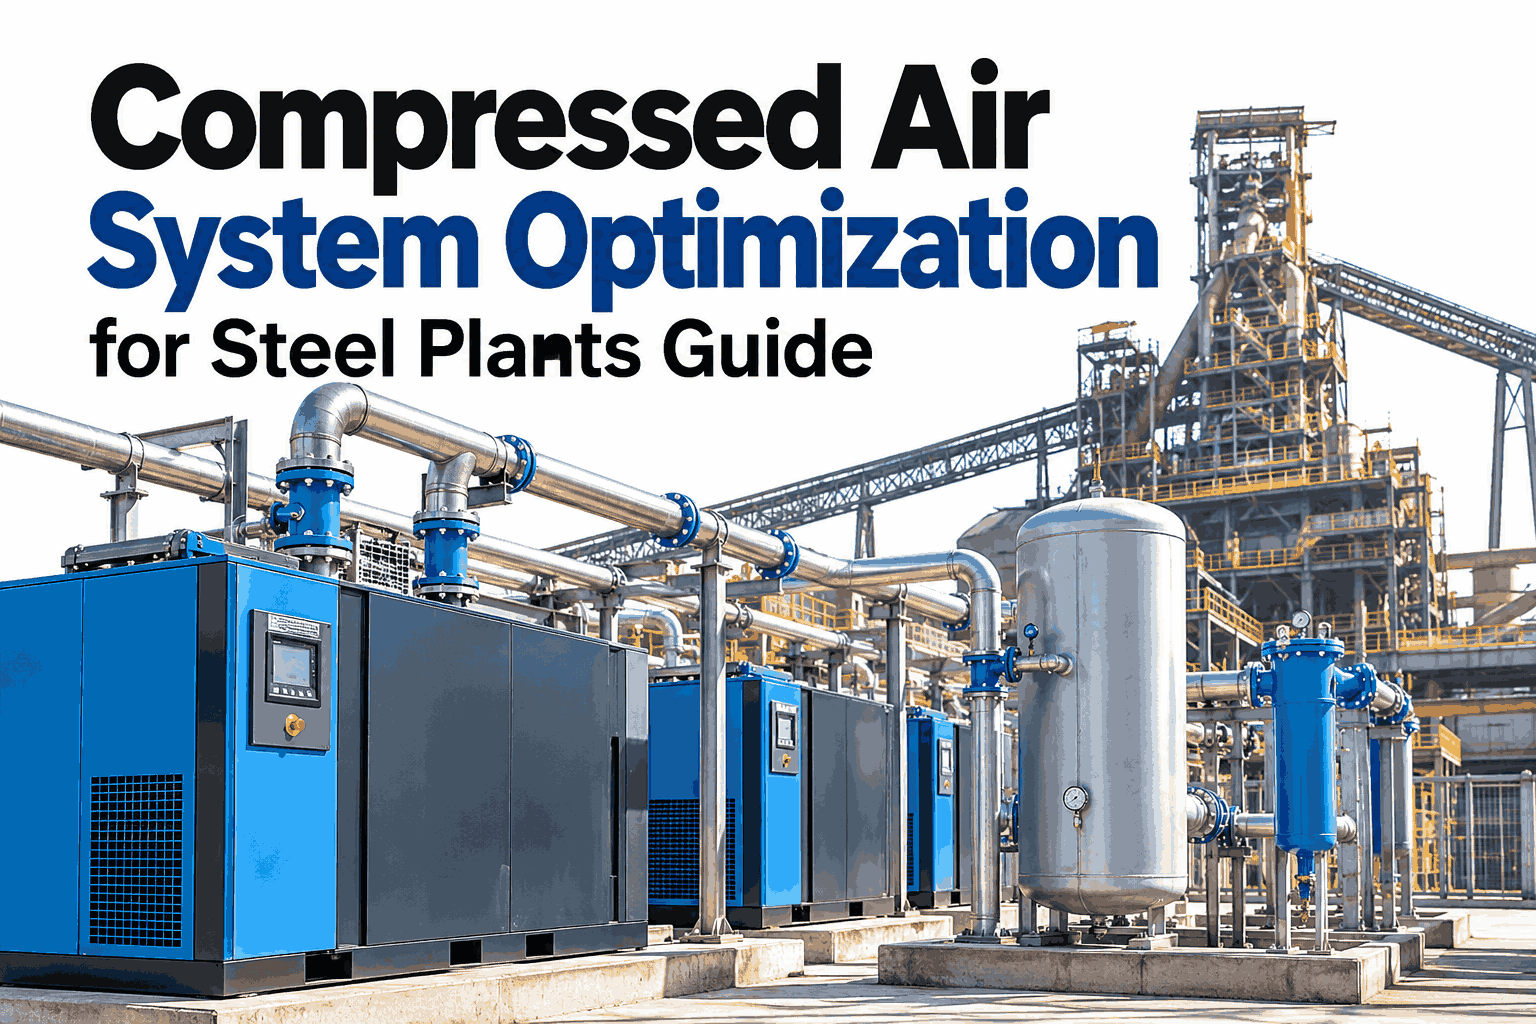
Compressed Air System Optimization for Steel Plants
Follow the air from compressor to use, find where it leaks away and recover the energy behind it.
Why Air Is One of the Costliest Utilities
Compressed air is convenient, but converting electricity into pressurised air is inefficient. Three facts explain why optimisation pays.
Most compressor input energy ends up as heat, so every unit of air carries a high energy cost.
Compressors run through idle periods and weekends, feeding leaks nobody is using.
Air cost is rarely charged to the units that use it, so waste has no owner.
Because the cost is hidden, the first job is visibility: air flow, pressure and compressor power measured against production.
Three Levers That Recover Energy
Work through the levers in order. Each makes the next one cheaper and safer.
Leak detection and repair
Leaks run all day and night. Finding and fixing them cuts demand without touching production.
Pressure reduction
Lower system pressure to what the real users need. Less pressure means less power and fewer leaks.
Demand-side management
Remove avoidable uses and match supply to demand with storage and compressor sequencing.
See Where Your Compressed Air Energy Goes
Book a 30-minute session and iFactory AI will show how compressor power, air flow and production are joined to give energy per tonne and a ranked list of savings.
Finding Leaks Without Stopping the Plant
Several methods work together. Use the table to choose by situation, and a leak survey planning session can set the order for your plant.
| Method | Best For | Watch Out For |
|---|---|---|
| Ultrasonic detection | Finding leaks in noisy areas, including overhead pipes | Needs a trained operator and a tagging routine |
| Off-shift flow test | Estimating total leakage when production is idle | Needs a clean stop, with valid readings only when all uses are off |
| Soap solution check | Confirming small leaks at fittings and couplings | Slow, and best for accessible joints only |
| Continuous flow monitoring | Spotting new leaks as soon as base flow rises | Needs metering at the right points |
Fixing leaks once is not enough. Without monitoring they return, so track base flow during idle periods and flag any rise.
The Arithmetic of Lower Pressure
Compressors use more power at higher discharge pressure, and every leak flows faster when pressure is up. A common rule of thumb helps size the gain.
The saving only holds if the lowest-pressure point still gets what it needs. Map the true minimum pressure per user, then lower in small steps while watching production.
Cutting Avoidable Demand
Not every use of compressed air needs it. Review each one, and keep air where it is the right tool.
Four Numbers to Measure First
A baseline makes every later saving provable. Start with these four.
Compressor kW per unit of air delivered, showing how efficiently air is made.
Idle-period flow as a share of normal flow, showing leakage.
Discharge pressure against the minimum the users need.
Compressor kWh divided by tonnes, tying air to steel output.
Where iFactory AI Fits
iFactory AI joins compressor, flow and production data so air cost and waste appear next to cost per tonne.
Air energy per tonne
Compressor kWh is expressed per tonne of steel, so air waste is visible in the plant's energy view.
Leak drift alerts
Rising idle-period flow is flagged, so new leaks are caught before they run for months.
Pressure and sequencing view
Setpoints and compressor loading are shown together, helping teams trim pressure and avoid part-load running.
Ask in plain language
Ask why air energy rose this week and receive the ranked causes with their cost.
iFactory AI arrives pre-configured on an NVIDIA server that ships racked and ready with software pre-loaded. Scope covers cabling, network, ERP and MES integration, team training and 24x7 remote monitoring.
Frequently Asked Questions
How much compressed air is typically lost to leaks?
Published audits often find leakage in a wide range, and poorly maintained systems can lose a large share of compressor output. Your own figure depends on age, maintenance and plant layout, so measure it with an off-shift flow test. You can watch leak share tracked on sample plant data in a live session.
Can we really recover 20 to 35 percent of compressed air energy?
Some plants report savings in that range, but results depend on how wasteful the starting point is and how consistently fixes are kept up. A plant with good practice will recover less. The safest method is to size your own opportunity from a measured baseline. To do that, request an air savings sizing session with the iFactory AI team, or ask support what data to collect.
Is lowering system pressure safe?
Yes, when done in small steps after the minimum pressure at each user has been confirmed. Watch the most pressure-sensitive equipment during each step and stop if performance drops. Lower pressure also reduces leak flow. A short product tour of pressure monitoring shows how trials are tracked.
What should we meter first?
Start with compressor power and total air flow, then add flow to the largest areas and pressure at key points. That is enough to calculate specific power, leak share and energy per tonne. See which meters give the fastest return in a guided walkthrough of your layout.
How do we stop leaks from coming back?
Tag and log every repair, track idle-period flow continuously and set an alert for rising base load. Pair that with a short routine leak patrol in high-wear areas. Monitoring turns a one-off project into a standing habit. Schedule a walkthrough of leak drift alerts to see how it works.
Stop Paying for Air You Never Use
iFactory AI tracks compressed air energy, leak drift and pressure against steel output. Book a walkthrough to see it built around your own plant.