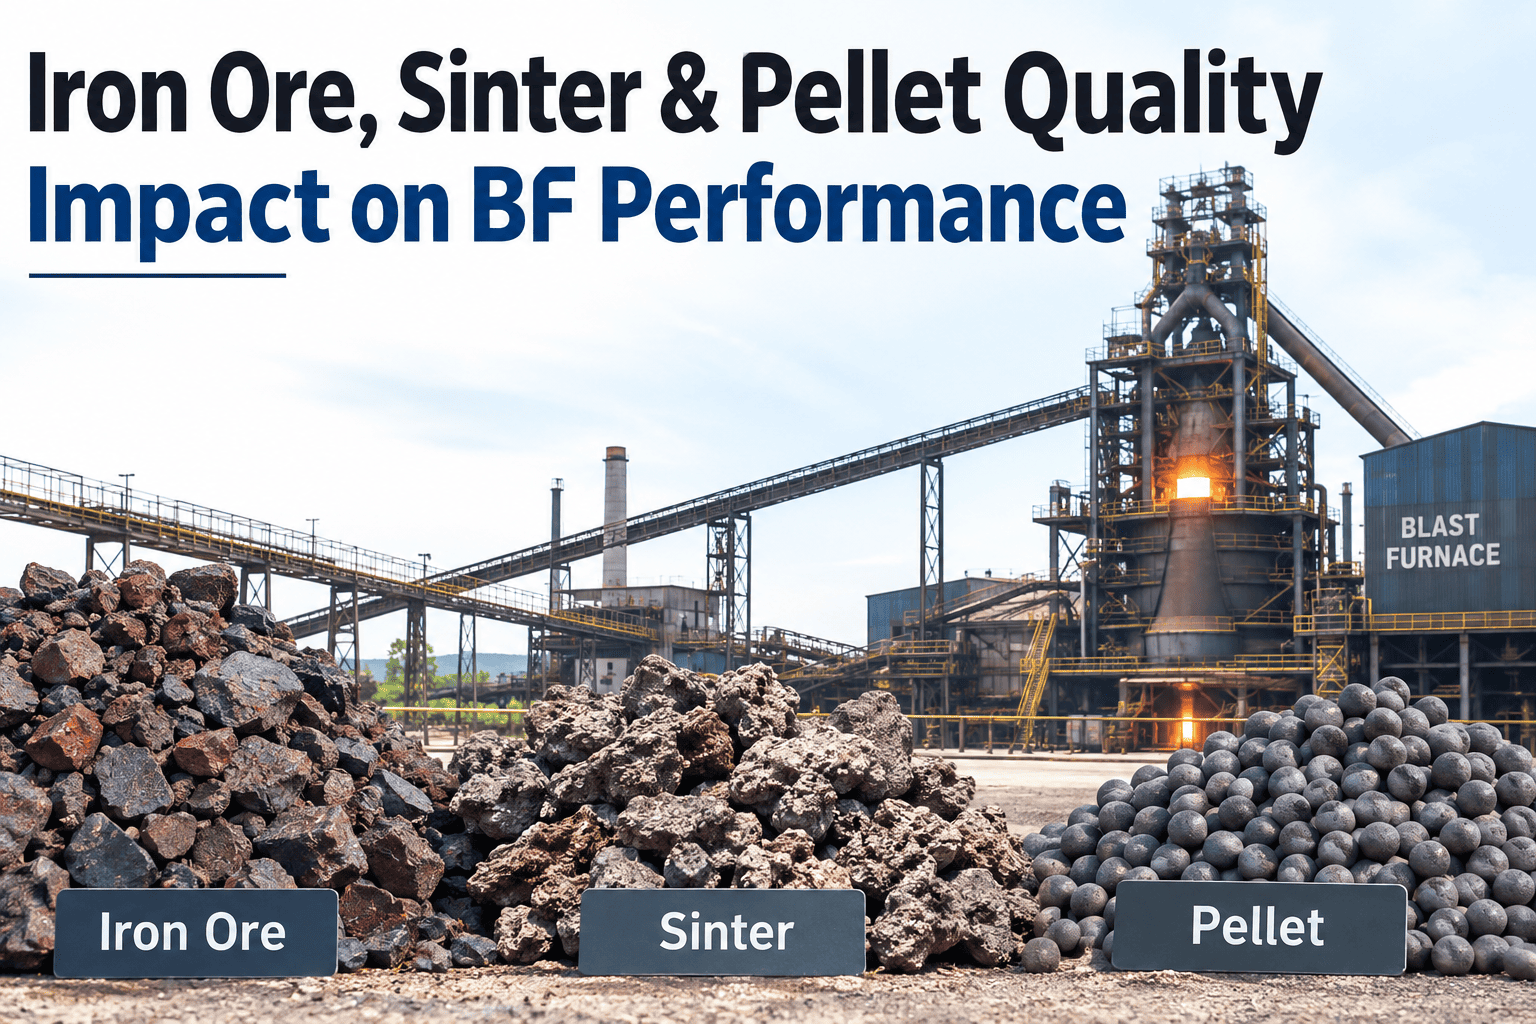
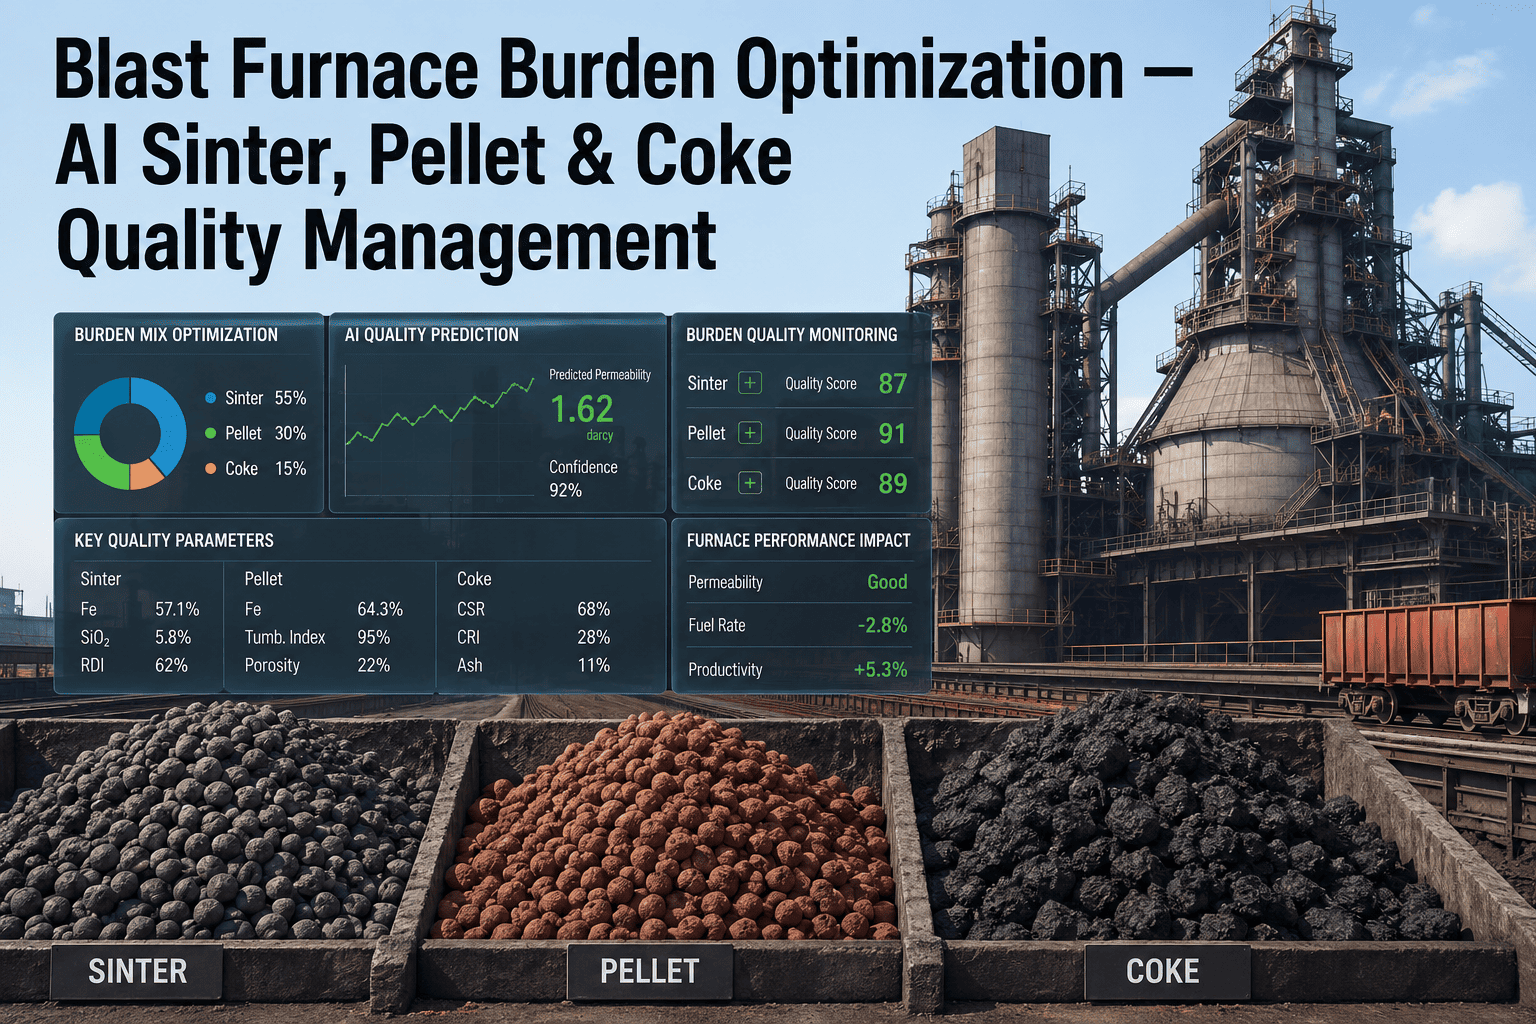
Blast furnace performance is decided less by furnace design and more by what gets charged into the stack each shift, and the iron-bearing burden — sinter, pellet, and lump ore — carries more weight over stability than most operating teams give it credit for. A drift in tumble strength, reduction degradation index, or fines content shows up hours later as a permeability problem, a burden distribution shift, or a fuel rate spike that operators end up chasing without ever tracing it back to the stockyard. Iron ore, sinter, and pellet quality management sits at the intersection of raw material sourcing, sinter plant control, and blast furnace stability, and most plants still manage it with periodic lab testing and operator memory rather than continuous tracking, a gap iFactory closes with correlated, real-time quality intelligence — full detail is available through iFactory's support team.
Burden Quality Intelligence · Blast Furnace
Iron Ore, Sinter, and Pellet Quality Management for Blast Furnace Performance
Track tumble index, RDI, reducibility, and chemistry across every incoming lot, and correlate burden quality directly against furnace permeability, fuel rate, and hot metal chemistry — before a bad batch turns into a week of unstable operation.
Representative tumble/strength ranges across a typical mixed burden
Why Burden Quality Drift Goes Unnoticed
The Furnace Reacts to Material Quality Long Before Anyone Sees a Lab Report
Sinter, pellet, and lump ore quality never arrives as a single fixed number. It moves lot to lot with raw mix, moisture, screening efficiency, and even how a stockpile was reclaimed, and most of that movement is invisible to the furnace crew until it has already changed burden behavior.
01
Lab Turnaround Lag
Tumble index, RDI, and chemistry results typically return hours to a full shift after the material has already been charged, so the data confirms a problem instead of preventing it.
02
Blend Variability
Sinter plant feed changes with iron ore fines source, and pellet shipments vary between plants and even between rail cars, so the burden a furnace receives is rarely as uniform as the average lab number suggests.
03
Hidden Interactions
A moderate RDI value and a moderate alkali load may each look acceptable individually, but combined they degrade softening-melting behavior in ways single-parameter thresholds do not catch.
04
Delayed Feedback Loop
By the time a fuel rate increase or a hanging event is traced back to a specific sinter batch, that batch is long since consumed, leaving no way to correct the root cause before it repeats.
Burden Composition
Sinter, Pellet, and Lump Ore Behave Differently Inside the Same Furnace
Every burden is a blend, and each component brings its own strength, reducibility, and degradation profile into the stack. Getting the ratio and the quality of each right is what keeps gas flow even from tuyere to stockline.
Property
Sinter
Pellet
Lump Ore
Typical Fe Content
56–58%
63–65%
60–63%
Tumble Index (TI)
65–72%
92–96%
78–86%
Reduction Degradation (RDI)
Moderate, mix-dependent
Sensitive above 1000°C
Generally low
Reducibility
High, porous structure
Moderate, dense structure
Lower, natural density
Softening-Melting Behavior
Wide range, basicity-driven
Narrow, consistent range
Variable by ore body
Fines Generation Risk
Higher during handling
Low, mechanically strong
Moderate, ore-dependent
Quality Parameters That Matter
Eight Measurements That Actually Predict Furnace Behavior
Strength & Degradation
Permeability Critical
Tumble Index (TI)Resistance to breakdown during handling and transport; low TI increases fines that choke burden permeability before the material even reaches the stockline
Reduction Degradation Index (RDI)Breakdown tendency in the cohesive zone as reduction proceeds; high RDI generates fines exactly where gas flow is already most restricted
Chemical Composition
Chemistry Critical
FeO ContentResidual iron oxide left after sintering; elevated FeO raises the energy needed for reduction and pushes coke rate higher
Alkali Load (K2O + Na2O)Circulating alkalis attack refractory lining and coke structure, and accelerate scaffold buildup inside the stack over time
Basicity (CaO/SiO2)Governs softening-melting temperature range; drift outside target basicity widens the cohesive zone and destabilizes gas distribution
Physical Condition
Handling Critical
Moisture ContentExcess moisture in sinter and lump ore reduces effective burden density and can trigger localized scaffolding near the belly
Fines Fraction (-5mm)Undersize material bypasses the intended burden layering and settles into voids, narrowing the gas flow channels that keep the furnace balanced
Reducibility Index (RI)Rate at which oxygen is removed under standard reduction conditions; low RI forces higher residence time and coke consumption to hit target metallization
From Lab Number to Furnace Event
What Actually Happens When a Quality Parameter Drifts
Low Tumble Index
leads to
Increased fines in burden layers, restricting gas flow channels near the stockline
Uneven gas distribution and localized channeling
High RDI
leads to
Fines generated in the cohesive zone where permeability is already lowest
Hanging events and slips during descent
Basicity Off-Target
leads to
Softening-melting range widens, thickening the cohesive zone
Rising coke rate and less stable descent rate
Elevated Alkali Load
leads to
Alkali circulation attacks refractory and coke structure over successive cycles
Scaffold formation and shortened campaign life
High Moisture in Sinter
leads to
Effective burden density drops and localized wet zones form near the belly
Irregular burden descent and local scaffolding
Low Reducibility (RI)
leads to
Longer residence time required to reach target metallization at each burden level
Higher fuel rate and reduced production rate
A One-Percent Shift in Tumble Index Rarely Shows Up on Its Own. It Shows Up as a Fuel Rate Trend You Cannot Explain Three Weeks Later.
Continuous burden quality tracking connects the lab number to the furnace event while there is still time to act on it.
How iFactory Tracks Burden Quality
From Incoming Lot to Correlated Furnace Insight
Stage 01
Incoming Lot Registration
Every sinter batch, pellet shipment, and lump ore consignment is logged against source, moisture, and screening data as it enters the yard, creating a traceable identity for each lot before it reaches the stockpile.
Stage 02
Lab and Sensor Fusion
TI, RDI, RI, and chemistry results from the lab are fused with online moisture and size-distribution sensors, closing the gap between periodic sampling and continuous material flow.
Stage 03
Real-Time Quality Index
Each material stream is scored against a rolling quality index calibrated to your furnace's historical tolerance band, flagging deviation before it reaches the charging system.
Stage 04
Burden Correlation Engine
Quality index trends are time-aligned with furnace descent rate, top gas utilization, and hot metal chemistry, surfacing which parameters actually move furnace behavior on your specific unit rather than a generic reference range.
Stage 05
Alerts and Recommendations
When a lot's projected quality index falls outside tolerance, the system recommends a blend adjustment or charging sequence change before the material is committed to the furnace.
Stage 06
Continuous Calibration
Correlation models are retrained against outcomes each campaign, so the tolerance bands and alert thresholds keep adapting to changes in raw material sourcing and furnace condition over time.
Operational Levers
Where Burden Quality Is Actually Won or Lost
Most quality drift is correctable upstream of the furnace, well before a lot ever reaches the bell. Knowing which lever to pull, and when, is what separates a stable campaign from a reactive one.
Sinter Plant
Holding raw mix basicity and moisture within a tighter band at the sinter plant reduces batch-to-batch TI and RDI swings before sinter ever leaves the strand.
Screening
Consistent screening at transfer points keeps the -5mm fines fraction out of the charged burden rather than letting it accumulate silently in stockpile reclaim.
Blend Ratio
Adjusting the sinter-to-pellet-to-lump ratio in response to a known quality dip in one stream can offset its impact on cohesive zone permeability without a production stoppage.
Pellet Sourcing
Tracking RDI performance by pellet supplier and plant of origin over multiple campaigns identifies which sources are reliably compatible with your furnace's cohesive zone tolerance.
Charging Sequence
Sequencing layer thickness and material placement based on the day's measured quality index, rather than a fixed recipe, keeps gas distribution even even when incoming quality varies.
Outcomes Reported by Ironmaking Teams
What Continuous Burden Tracking Changes Within Two Campaigns
01
Reduced
Fuel Rate Variance
Blend adjustments made ahead of charging, rather than after a fuel rate trend appears, narrow the shift-to-shift swing in coke and PCI consumption.
02
Earlier
RDI Drift Detection
Correlation against furnace response flags a developing RDI problem in the pellet stream before it accumulates into a hanging event.
03
Faster
Root-Cause Tracing
Every furnace upset can be traced back to the specific lot and quality parameter that preceded it, replacing guesswork with a searchable record.
04
Tighter
Burden Consistency
Quality-aware blend ratios keep the cohesive zone behavior within a narrower band campaign over campaign, rather than drifting with raw material sourcing.
05
Fewer
Unplanned Upsets
Slips, hangs, and scaffolding events tied to burden quality decline as blend and charging adjustments happen ahead of the furnace rather than in reaction to it.
06
Full History
Quality-Performance Record
Every lot, quality score, and furnace outcome is retained together, giving the raw materials and ironmaking teams a shared record instead of two separate systems.
Lab-Based QC vs. Continuous Correlation
Where the Two Approaches Actually Diverge
Aspect
Periodic Lab QC
iFactory Continuous Tracking
Sampling Frequency
Batch samples tested a few times per shift or per lot
Every lot logged and scored continuously as it moves through the yard
Feedback Timing
Results return after material is already charged into the furnace
Quality index available before the lot is committed to the charging system
Furnace Correlation
Left to operator experience and manual cross-referencing
Automatically time-aligned against descent rate, gas utilization, and chemistry
Root-Cause Tracing
Reconstructed manually from shift logs and lab records after an upset
Every upset queryable against the exact lot and parameter that preceded it
Blend Adjustment
Reactive, based on the most recent available lab result
Proactive, based on a projected quality index ahead of charging
Historical Record
Scattered across lab sheets, shift logs, and furnace control history
Unified lot-to-outcome record retained and searchable across campaigns
Field Example
Tracing a Fuel Rate Increase Back to a Pellet Supplier Change
An integrated steel plant running a mid-sized blast furnace noticed a gradual fuel rate increase of roughly four percent over six weeks, alongside a slight rise in hanging frequency. Lab data showed nothing obviously out of specification at any single sampling point, and the ironmaking team suspected coke quality first, since that was the most commonly investigated variable in past upsets.
Continuous burden tracking showed a different picture. A newly introduced pellet supplier had RDI values that were individually within acceptable range but consistently on the higher end of tolerance, and when correlated against furnace descent data, that supplier's lots aligned closely with the periods of elevated fuel rate and hanging frequency. The pattern had not been visible in periodic lab sampling because no single lot crossed a hard threshold on its own.
The team adjusted the blend ratio to reduce reliance on the new supplier during the transition period and worked with the supplier on raw mix changes to bring RDI performance closer to the furnace's established tolerance band. Fuel rate returned to baseline within three weeks, and the correlation model now flags any new pellet source automatically during its qualification period before full-volume use.
4%
Fuel rate increase traced to source
6 weeks
Time from drift onset to root cause without tracking
3 weeks
Time to recover fuel rate baseline after correction
Frequently Asked Questions
What Raw Materials and Ironmaking Teams Ask First
Which single quality parameter has the biggest impact on blast furnace fuel rate?
There is no single dominant parameter across all furnaces, which is exactly why single-threshold specifications underperform. Reducibility and RDI tend to have the largest combined effect on fuel rate because they govern how much extra reduction work the furnace has to do and how much of that work happens in fines rather than intact burden material. Basicity and FeO content compound whichever of those is already trending unfavorably. The practical answer for any given furnace comes from correlating your own quality and performance history rather than applying a generic rule, which is what the correlation engine is built to surface over successive campaigns.
How is burden quality data typically collected without disrupting the existing lab workflow?
Existing lab testing for TI, RDI, RI, and chemistry continues exactly as it runs today — this is a layer added on top of current procedures, not a replacement for them. Lot registration data is pulled from existing yard and rail records, and online moisture and size sensors, where installed, feed continuously into the same quality index. For plants without online physical sensors yet, lab results alone still provide meaningful lot-level tracking, with sensor integration added as a phased second step. Reach out through
iFactory support to scope what your current lab and yard setup already supports.
Can this correlate quality data against more than one furnace if a plant runs multiple stacks?
Yes, and this is a common configuration for integrated plants with two or more blast furnaces sharing a common stockyard and sinter plant. Each furnace maintains its own tolerance bands and correlation model, since two furnaces of different size, campaign age, and burden design can respond differently to the same incoming lot quality. Shared yard inventory is tracked once, then split by allocation to each furnace's charging record, so a quality issue traced on one stack does not get incorrectly attributed to material charged into another.
How long does it take before the correlation engine produces useful recommendations?
Meaningful lot-to-outcome correlation typically starts to emerge within four to six weeks of continuous data collection, once enough quality variation and corresponding furnace response has been captured to calibrate initial tolerance bands. Recommendations become more precise over the following two to three campaigns as the model incorporates seasonal raw material changes and any furnace condition shifts. Early value still comes immediately from having a unified, searchable lot record even before the correlation model is fully mature, which teams typically use for faster manual root-cause tracing during that ramp-up period.
Does better burden quality tracking reduce how much lab testing needs to be done?
Not directly, and that is intentional — lab testing remains the source of ground truth for TI, RDI, RI, and chemistry, and the correlation engine depends on that data being accurate. What changes is how the results get used: instead of sitting in a shift log to be manually cross-referenced later, every result feeds automatically into the quality index and correlation model the moment it is entered. Some plants do choose to add targeted online sensors over time specifically to fill gaps between lab sampling intervals, which is a separate decision from testing frequency itself. To talk through a specific lab and sampling setup,
schedule a walkthrough with the team.
Stop Discovering Burden Quality Problems Three Weeks Into a Fuel Rate Trend.
Correlate sinter, pellet, and lump ore quality against real furnace outcomes, and catch the drift while there is still a lot on the ground to correct.