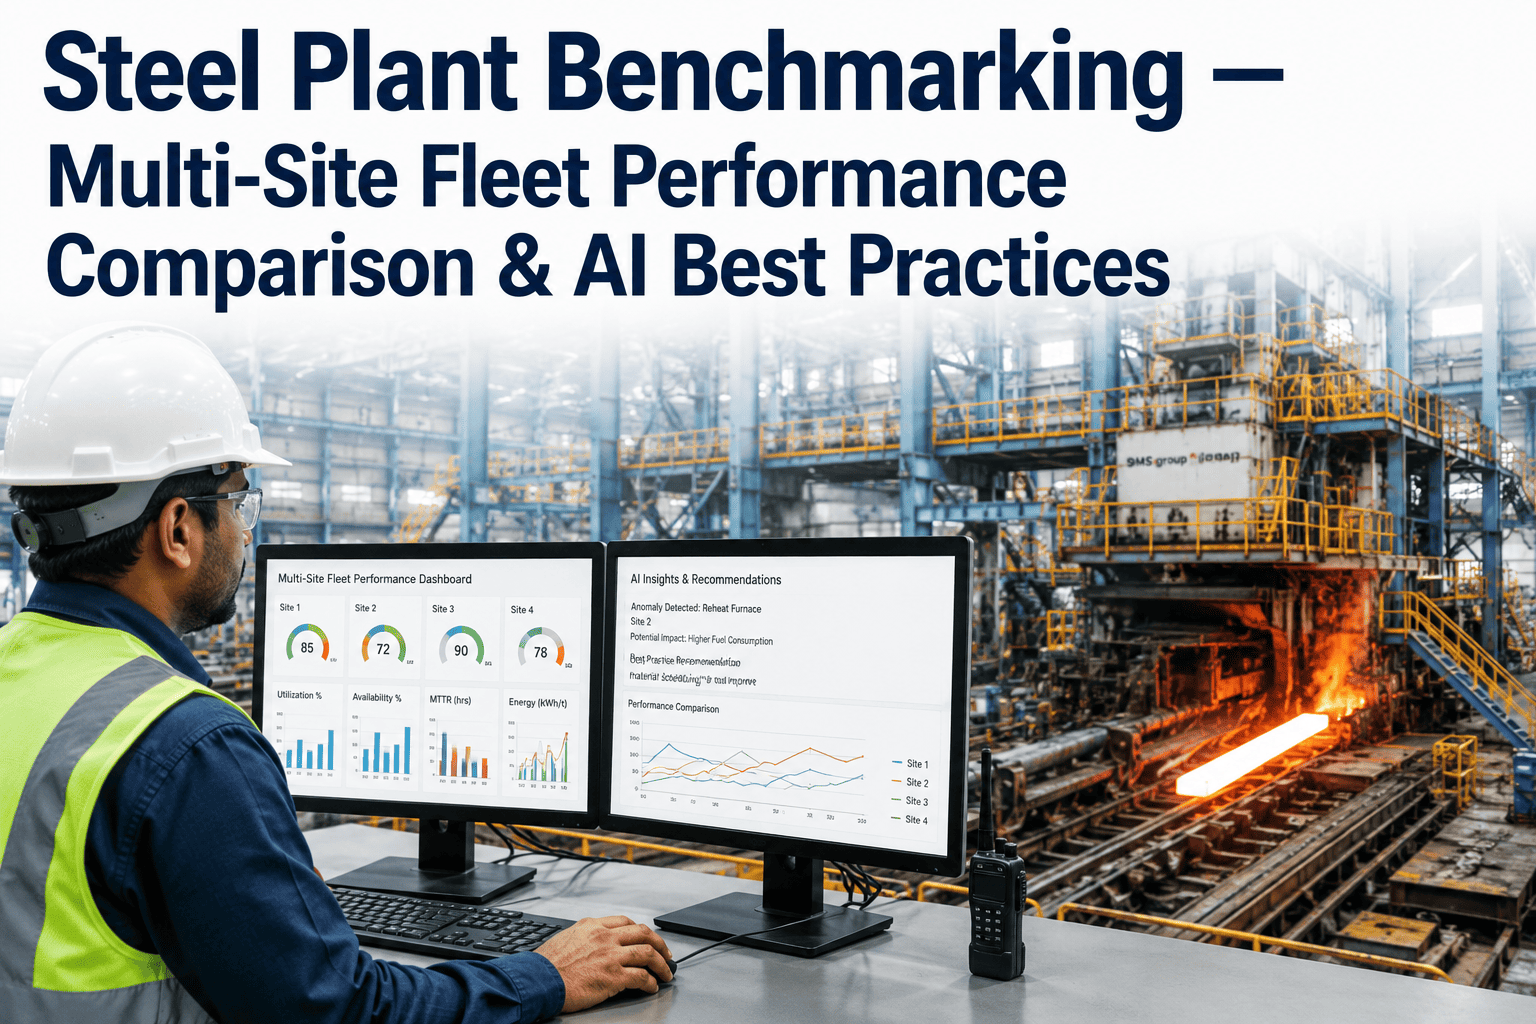
A steel corporation operating 4 plants across different geographies typically runs 4 different maintenance approaches, 4 different KPI definitions, 4 different spare parts inventories, and has no way to compare equipment performance or maintenance effectiveness across sites. The plant with the best rolling mill reliability cannot share its practices with the plant struggling with the same equipment because there is no common data language. iFactory provides enterprise-wide analytics standardisation across every steel plant location with unified KPI dashboards, cross-site equipment benchmarking, shared best practice propagation, and centralised spare parts intelligence. Corporate leadership sees every plant on one screen while each plant retains local operational control. Steel corporations running iFactory across multiple sites report 22% improvement in bottom-quartile plant performance, 18% reduction in enterprise spare parts inventory, and $4.2M annual value from cross-site optimisation. Book a free multi-site assessment.
iFactory provides enterprise-wide analytics standardisation with unified KPI dashboards, cross-site equipment benchmarking, best practice propagation, and centralised spare parts intelligence across all steel plant locations. Each site runs on-premise with local operational control while corporate sees a single consolidated view. Average result: 22% improvement in worst-performing plant, 18% spare parts inventory reduction, $4.2M annual enterprise value.
Cross-Site Benchmarking: What Enterprise Steel Analytics Reveals
When every steel plant runs on the same iFactory platform with standardised KPI definitions, corporate leadership can compare equipment reliability, maintenance effectiveness, energy efficiency, and safety performance across all sites for the first time. The gap between best and worst performers becomes visible and actionable.
Enterprise Capabilities That Single-Site Platforms Cannot Deliver
Multi-site steel analytics requires capabilities beyond what a standalone CMMS at each plant can provide. iFactory delivers enterprise intelligence that creates value from cross-site data that would otherwise remain siloed.
iFactory's multi-site platform connects every steel plant location into a single enterprise analytics layer that identifies cross-site improvement opportunities invisible to standalone plant systems.
iFactory vs Competitor Platforms for Multi-Site Steel
| Capability | iFactory | SAP EAM | IBM Maximo | Oracle EAM | Siemens Insights Hub | C3 AI Mfg |
|---|---|---|---|---|---|---|
| Cross-site KPI benchmarking | AI-standardised per site | Configuration required | Reporting module | Configuration required | Cloud analytics | Generic models |
| Best practice propagation engine | Auto-identifies and packages | Not available | Not available | Not available | Not available | Not available |
| Cross-site spare parts pooling | Enterprise inventory AI | MRP multi-plant | Materials module | Inventory module | Not available | Not available |
| Fleet risk ranking across sites | AI probability per asset | Not available | Not available | Not available | Cloud analytics | Generic models |
| On-premise per site (zero cloud) | Each site on-premise | On-prem option | On-prem option | On-prem option | Cloud required | Cloud required |
| Multi-region compliance modules | US + GCC + EU + UK + Canada | Configuration required | Configuration required | Configuration required | Limited regions | Not available |
Based on publicly available product documentation as of Q1 2025. Verify capabilities with each vendor.
Regional Compliance for Multi-Site Operations
| Region | Key Regulations | How iFactory Complies |
|---|---|---|
| United States | OSHA PSM, EPA NESHAP, Clean Air Act, RCRA | Full OSHA + EPA automation per US site. State-specific modules for IN, OH, PA, AL. On-premise per site. |
| UAE / Saudi | OSHAD SF, HCIS, ADNOC HSE, ICV | Arabic-first interface. GCC compliance preconfigured. ICV-eligible. Local support teams. |
| United Kingdom | UK GDPR, HSE PUWER, COMAH, UK ETS | UK emissions trading compliance. PUWER documentation. All data on-site per UK facility. |
| Canada | PIPEDA, Provincial OHS, CEPA, Carbon Pricing | Provincial compliance configurable. Carbon pricing tracking. Bilingual interface. |
| Europe (EU) | EU GDPR, EU ETS, IED, NIS2, EU Machinery Regulation | EU ETS emission tracking. IED BAT compliance. NIS2 cybersecurity. No external data transmission. |
Results from Multi-Site Steel Corporations Running iFactory
iFactory connects every steel plant location into a single enterprise analytics layer. Unified KPIs, cross-site benchmarking, best practice propagation, and fleet risk ranking.
Frequently Asked Questions
Continue Reading
iFactory connects every steel plant into a single enterprise analytics layer. Unified KPIs. Cross-site benchmarking. Best practice propagation. Fleet risk ranking. On-premise per site.