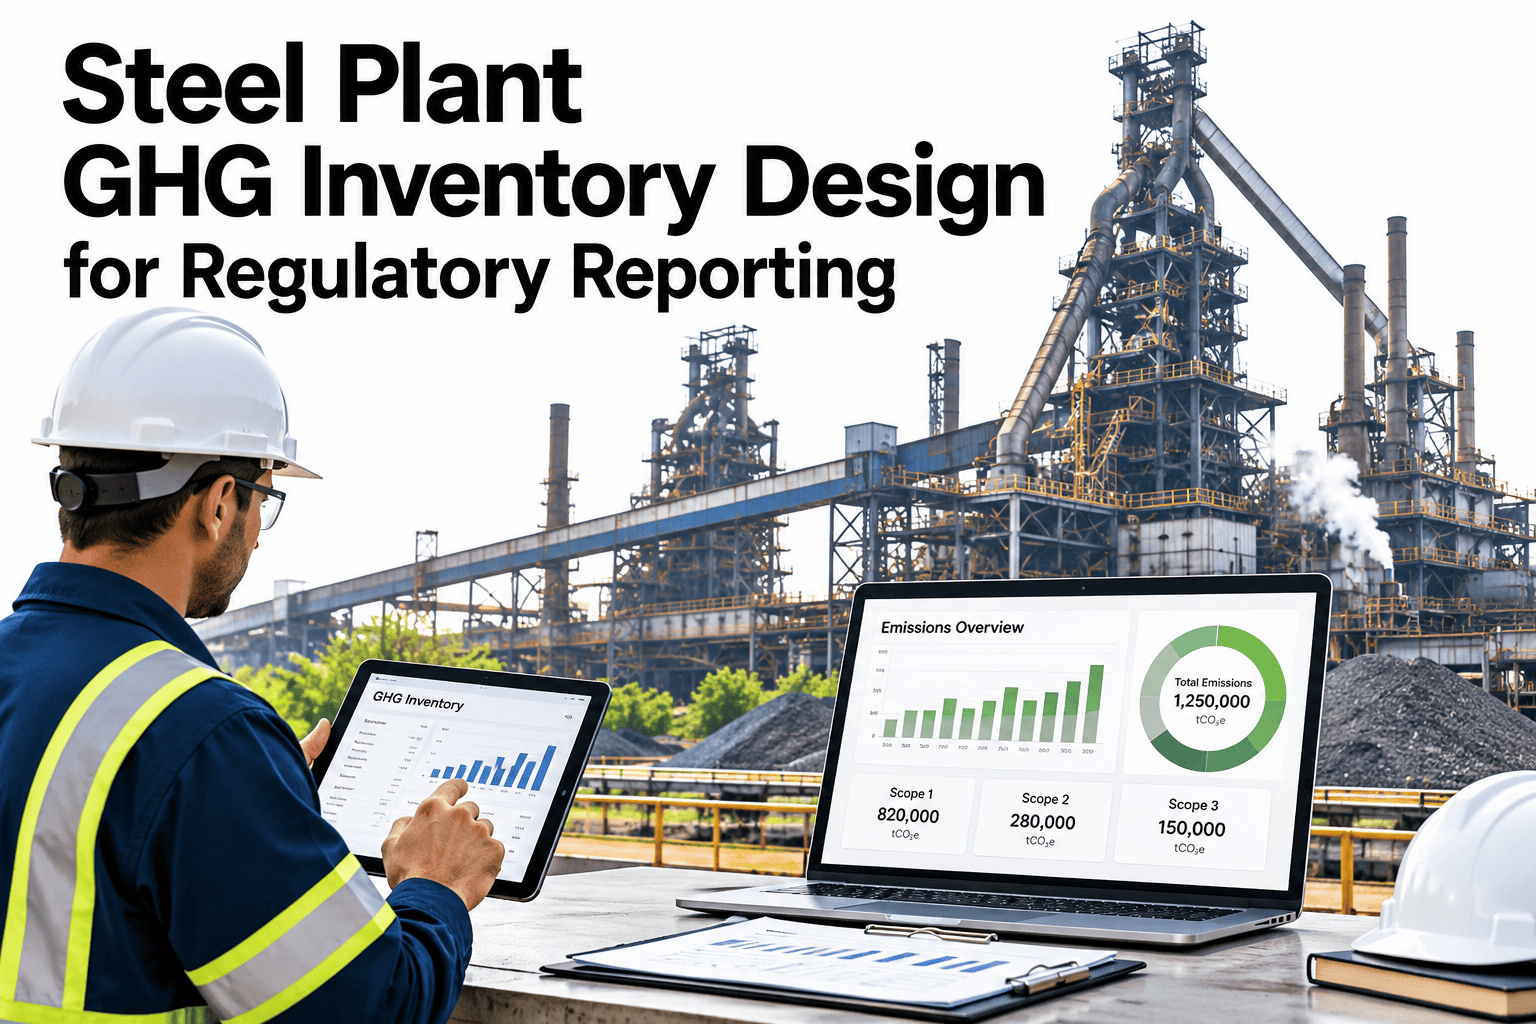
Carbon has become a financial variable in steel production — not merely an environmental metric. EU CBAM introduces a direct carbon cost on steel exports to Europe from 2026. Sustainability-linked loans and green bonds now require verified Scope 1, 2, and 3 emissions data. Major automotive and construction customers are imposing supplier carbon intensity limits as part of their own net-zero commitments. For steel plants in the USA, Canada, UK, Germany, Australia, and the UAE, carbon tracking is no longer optional — it is a prerequisite for market access, financing, and premium pricing on green steel. iFactory's ESG Reporting and Carbon Tracking platform gives steel plants the infrastructure to measure, verify, report, and systematically reduce their carbon footprint across all three scopes.
Steel Plant Carbon Footprint Reduction: Scope 1, 2 & 3 Emissions Tracking Guide
Measure, verify, and reduce your steel plant's carbon intensity — covering Scope 1/2/3 tracking, CO₂ intensity benchmarking, EU CBAM preparation, and ESG reporting.
Carbon Abatement Stack — Which Levers Deliver the Most CO₂ Reduction
Not all decarbonisation actions are equal. iFactory helps prioritise the highest-impact abatement actions — tracking carbon saved per initiative for sustainability reporting and capital allocation decisions.
Asset-Level CO₂ — Where Your Plant's Emissions Actually Come From
iFactory calculates CO₂ intensity per asset, per production line, and per process step — so plant engineers can see exactly which equipment is driving emissions and where maintenance-driven efficiency projects have the most carbon impact.
Why Carbon Tracking Is Now a Business-Critical Function for Steel Plants
Steel production accounts for approximately 7–9% of global CO₂ emissions. Individual steel plants are now being asked — by regulators, customers, investors, and banks — to quantify, verify, and reduce that contribution. The financial stakes are significant: EU CBAM will add €40–100 per tonne to the cost of exported steel that cannot prove low embedded carbon. Schedule a CBAM readiness assessment to understand your plant's carbon exposure before the 2026 full implementation date.
- Coke combustion in blast furnace
- BOF steelmaking offgases
- Natural gas combustion — reheating furnaces
- Captive power plant fuel combustion
- Process CO₂ from limestone calcination
- Grid electricity emission factor × kWh consumed
- Purchased steam from third-party utilities
- Market-based vs location-based reporting
- Renewable energy certificate (REC) adjustments
- Power purchase agreement (PPA) tracking
- Iron ore and coal mining upstream emissions
- Logistics and transport to plant
- Processing of sold steel at customers
- End-of-life treatment — scrap recycling
- Business travel and employee commuting
What iFactory's Carbon Tracking Platform Does
Five modules covering the full carbon management lifecycle — from real-time emission factor calculation to board-ready ESG reporting and EU CBAM certificate preparation.
Real-Time CO₂ Intensity
tCO₂/tcs calculated continuously — per heat, per shift, per unit — against internal benchmarks and IPCC sector averages. Instant visibility into whether today's production is above or below target.
ESG Report Generation
GRI 305, CDP Climate questionnaire, TCFD metrics, and BEE GHG inventory reports generated automatically — with data lineage and audit trail for third-party verification.
EU CBAM Preparation
Embedded carbon calculation per product category in CBAM-prescribed methodology — direct and indirect emissions per tonne of steel, export-route specific, ready for EU declarant submission.
Carbon Credit Management
Tracks renewable energy credits, carbon offset retirements, and PAT Energy Saving Certificates (ESCerts) — maintaining a consolidated carbon asset register aligned to actual emissions data.
AI Digital Twin — Decarbonisation Scenarios
Model the carbon impact of technology transitions — coal injection reduction, DRI substitution, renewable electricity sourcing, waste heat to power — with cost-per-tCO₂ avoided for each investment scenario.
Where Do Steel Plants Stand? — CO₂ Intensity Benchmark Table
Understanding your plant's position against industry benchmarks is the starting point of any credible carbon reduction programme. iFactory measures your actual intensity in real time — and shows exactly which process areas offer the highest reduction potential.
A Practical Steel Plant Decarbonisation Roadmap — Where iFactory Fits
Carbon reduction in steel is a multi-decade journey — but the data infrastructure has to be built now. iFactory provides the measurement and intelligence layer that makes every phase of decarbonisation measurable, reportable, and fundable.
Measure & Baseline
Deploy iFactory carbon tracking — real-time Scope 1, 2, 3. Establish verified baseline tCO₂/tcs. Begin CDP/GRI reporting. Prepare CBAM embedded emissions data.
Optimise & Reduce
AI identifies highest-impact levers — coke rate, WHR, renewable electricity. iFactory Digital Twin models interventions before capital is committed. Target −15–25% intensity.
Transition Route
DRI integration, green electricity, hydrogen trials — tracked and verified by iFactory across all three scopes. Carbon credits managed in-platform against actual verified reductions.
EU Carbon Border Adjustment Mechanism — What Steel Exporters Must Track
The EU CBAM requires steel exporters to report embedded carbon per tonne of product — verified to European standard methodology — from 2026 onward. Exporters who cannot provide compliant carbon data face tariffs equivalent to the EU carbon price (currently €50–70/tonne CO₂). iFactory generates CBAM-ready reports automatically from production and energy data. Request a CBAM readiness assessment for your export volumes.
- Embedded Scope 1 + 2 CO₂ per product category (tonnes CO₂e/t)
- Verified methodology aligned with EU Implementing Regulation 2023/1773
- Quarterly reporting via EU CBAM declarant portal from 2026
- Auditor access to underlying production & energy data on demand
- Penalty: EU carbon price × unverified embedded emissions
- Heat-level carbon intensity calculated per product category automatically
- EU Regulation 2023/1773 methodology — calculation audit trail archived
- One-click CBAM quarterly report in EU portal-ready format
- Full data room access for verifiers — timestamped, read-only, auditable
- Cost: ₹0 in tariffs for verified compliant exporters
The Four Levers of Steel Plant Decarbonisation — iFactory Tracks All Four
No single intervention decarbonises a steel plant. World-class carbon reduction combines four independent levers — each delivering measurable CO₂ reduction independently, but adding up to 40–60% Scope 1 reduction when implemented together with iFactory tracking.
What a Sustainability Director Said
Our CDP submission used to take six weeks and two consultants. With iFactory, the data is continuously verified — Scope 1 and 2 with full IPCC emission factor traceability. Last year's CDP submission took four days internally. And when our automotive customer asked for embedded carbon data per product category for their CBAM analysis, we produced it within 48 hours. That's a commercial advantage.
Frequently Asked Questions
How does iFactory calculate Scope 1 emissions for a BF-BOF steel plant?
iFactory applies IPCC Tier 2/3 methodology — real-time fuel consumption (coke, coal, natural gas) multiplied by verified emission factors — calculated per heat and aggregated to shift, monthly, and annual GHG inventory.
Is iFactory's carbon data accepted for CDP and GRI reporting?
Yes. iFactory maintains full data lineage and audit trail for all emission calculations — accepted by third-party verifiers for CDP Climate, GRI 305, and TCFD disclosures. Supported verification bodies include Bureau Veritas, SGS, and DNV.
How does iFactory prepare steel plants for EU CBAM requirements?
iFactory calculates embedded direct and indirect emissions per product tonne in CBAM-prescribed methodology — product category specific, with the traceability required for EU declarant submission from 2026.
Can iFactory model different decarbonisation pathways and their costs?
Yes. The AI Digital Twin models carbon reduction scenarios — DRI substitution, renewable electricity, waste heat recovery — with projected tCO₂ reduction, investment required, and cost per tCO₂ avoided for each pathway.
How long does carbon tracking go live after implementation?
Scope 1 real-time tracking is live within 4–6 weeks of data integration. Scope 2 and Scope 3 inventory calculations and ESG report templates are operational by Week 10–12.
See Carbon Tracking & ESG Reporting Live
Demo built around your production route, reporting obligations, and CBAM exposure.