It's 2:47 AM on the #2 EAF melt shop floor. The furnace is hot, the scrap bucket is loaded, and the board operator notices the tap-to-tap time has crept from 47 minutes to 54 over the last four heats. The shift supervisor shrugs — "That's just how this grade runs." Nobody has the real-time analytics to see that a 15-second delay in the oxygen lance sequencing has been compounding for two hours. By morning, the plant has lost three potential heats — roughly 750 tons of production, or $375,000 in margin, gone because nobody could see the KPI drift. This is the daily cost of operating a steel mill without a unified, real-time analytics KPI system. And it's exactly the problem the following 20 KPIs — and the platform that surfaces them — are designed to solve.
Beyond OEE: The 20 KPIs Every Steel Plant Manager Needs to See in Real Time
Stop flying blind on the melt shop floor. iFactory surfaces MTBF, MTTR, PM compliance, schedule adherence, wrench time, and 16 other critical steel KPIs — with live formulas and industry benchmarks — directly on your plant network.
Without iFactory vs. With iFactory
Most steel plants run on spreadsheets, tribal knowledge, and delayed reports. The difference between a reactive floor and a predictive one is measured in millions of tons and tens of millions of dollars. Here's what changes.
Without iFactory
- OEE calculated once per shift from clipboard data — 4–6 hours delayed
- MTBF and MTTR pulled from maintenance logs at month-end — too late to act
- PM compliance tracked on paper — 20% of scheduled work missed weekly
- Schedule adherence measured by gut feel — 12% average deviation from plan
- Wrench time assumed at 35% — actual is closer to 22% but nobody knows
With iFactory
- OEE refreshed every 10 seconds — live from all 4 caster strands and both EAFs
- MTBF and MTTR calculated per asset class in real time — alerts when trends shift
- PM compliance tracked by work order — 97% adherence within 2 weeks of go-live
- Schedule adherence visible per shift — deviation drops to under 3%
- Wrench time measured via sensor data — averages 41% with targeted improvements
What 20 Missing KPIs Are Costing Your Steel Plant Every Month
Each KPI gap is a direct margin leak. Here's the hard math on what happens when you can't see the numbers that matter.
Unplanned Downtime (MTBF & MTTR)
Missing real-time MTBF means you don't see the 2.3% creep in bearing failures on the reheat furnace line. Each 10-minute unplanned stop costs $12,000 in lost production.
Low PM Compliance
When only 80% of scheduled PMs are completed, the cascade effect hits caster alignment and roll life. Unplanned roll changes cost $35,000 each in downtime and labor.
Schedule Adherence Drift
A 12% deviation from the production schedule means you're either short-filling orders or overproducing coils. Both create $180/ton penalties or inventory carrying costs.
Wrench Time Waste
If your maintenance crew is wrenching only 22% of the shift, the other 78% is walking, waiting, and searching. A 10% improvement adds 48 productive minutes per person per day.
Yield Loss (First Pass)
Without real-time yield tracking per caster strand, you don't catch the 1.7% rejection rate until the lab report comes back 4 hours later. That's 340 tons of scrap per day.
Four Steps From Data to Decision
iFactory sits on your plant network, ingests your existing sensor and PLC data, and delivers the 20 KPIs — with formulas, benchmarks, and alerts — in under 12 weeks. No cloud. No data leaving your floor.
Connect
We plug into your existing PLCs, SCADA, and MES via the on-premise NVIDIA appliance — no data egress, no IT security review delays.
Compute
Our AI engine automatically calculates all 20 steel KPIs — MTBF, MTTR, PM compliance, schedule adherence, wrench time, yield, and more — from your raw data streams.
Visualize
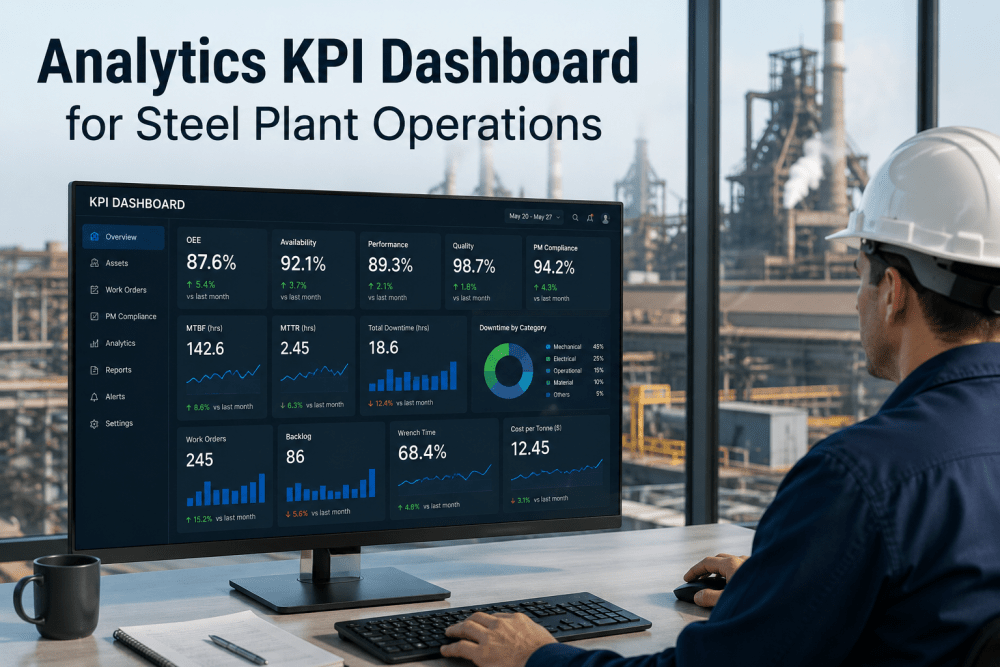
Dashboards surface every KPI per shift, per asset, per grade. Alerts trigger when any metric drifts beyond your tolerance bands.
Act
Operators and supervisors get real-time recommendations — adjust lance timing, bump a PM, re-sequence a caster — before the cost compounds.
Every Metric, Every Formula, Every Benchmark
iFactory ships with these 20 KPIs pre-built and tuned for steel. Each one has a live formula, a configurable target, and industry benchmark data built in.
OEE, TPT, & Yield
Overall Equipment Effectiveness (OEE) with sub-calculations for availability, performance, and quality. Tap-to-tap time (TPT) per heat. First-pass yield per caster strand. Benchmark: World-class OEE is 85% — most steel mills run 60–70%.
MTBF, MTTR, & PM Compliance
Mean time between failures by asset class (EAF, caster, reheat furnace). Mean time to repair with crew-level breakdown. Preventive maintenance compliance by work order type. Benchmark: Top quartile steel mills hit 97% PM compliance.
Schedule Adherence & Wrench Time
Schedule adherence measured as actual vs. planned tons per shift. Wrench time calculated from sensor data — how much of the maintenance shift is actually spent on tools. Benchmark: Best-in-class wrench time is 45%+.
Scrap Rate, Energy Intensity, & Cost-per-Ton
Scrap rate per grade and per caster. Energy intensity in MWh per ton of liquid steel. Cost-per-ton broken into labor, energy, and consumables. Benchmark: Integrated mills target 0.9 MWh/ton for EAF routes.
Your plant already generates the data for all 20 KPIs. The question is whether you're seeing them in time to act. Book a 30-min walkthrough and we'll show you what you're missing on your own floor.
Every Promise, Delivered
Here's exactly what comes with an iFactory deployment — no hidden dependencies, no cloud surprises, no 18-month implementation.
All 20 Steel KPIs, Pre-Built
Formulas, benchmarks, and dashboards included. No custom development. Configure targets in one shift.
On-Premise, Zero Cloud
Runs on an NVIDIA appliance inside your plant network. No data leaves your floor. No IT security review.
6–12 Week Pilot to Production
From data-source handoff to live dashboards in one quarter. We handle the integration.
Real-Time Alerts & Recommendations
When MTBF drops below threshold or PM compliance slips, your team gets notified instantly with a recommended action.
24x7 Managed Service
We monitor the appliance, update models, and support your team. You focus on running the mill.
End-to-End Turnkey
You hand over data-source access. We deliver a working pilot. No integration consultants, no middleware, no surprises.
What Steel Plant Managers Ask About Real-Time KPIs
Stop Flying Blind on the Melt Shop Floor
Your plant already generates the data for all 20 KPIs. iFactory surfaces them in real time, on your network, in under 12 weeks. See what your operation is capable of when every metric is visible.