In a modern integrated steel plant, the difference between top-quartile profitability and chronic margin erosion often comes down to maintenance effectiveness. Yet, when asked about the true cost of asset reliability, many plant managers still rely on trailing financial indicators or gut feelings rather than leading operational metrics. Tracking the right analytics KPIs — such as Mean Time Between Failures (MTBF), Mean Time To Repair (MTTR), Planned Maintenance Percentage, and Wrench Time — transforms maintenance from a reactive cost centre into a predictable, strategic value driver. iFactory's Analytics Dashboard digitises this entire process. Automatically extracting live data from your CMMS, SCADA, and SAP systems, it delivers real-time, actionable insights directly to the boardroom, eliminating data silos and spreadsheet errors to ensure every maintenance dollar directly impacts mill uptime.
Analytics KPIs Every Steel Plant Manager Should Track
From MTBF and MTTR to Maintenance Cost per Ton — how live, automated dashboarding turns reactive operations into predictable equipment reliability.
The Problem: KPIs that Arrive 30 Days Too Late
In legacy plants, engineers spend hours at the end of each month compiling manual spreadsheets from fragmented software to calculate their MTBF and PM compliance. By the time the plant manager sees the data, the opportunity to prevent a cascade failure has already passed. Schedule an analytics audit to discover the value of real-time operational visibility.
Decisions based on 30-day-old spreadsheet data rather than live conditions.
SAP MM knows part costs, SCADA knows run hours, but neither talks directly to CMMS.
Reliability engineers functioning as data entry clerks instead of problem solvers.
iFactory’s standard: Live, correlated metrics streamed continuously via standard APIs.
15 Essential Analytics KPIs Powered by iFactory
Through direct integrations, the iFactory platform automatically tracks the leading and lagging indicators that dictate your plant's reliability performance — categorising them into equipment health, worker productivity, and financial efficiency.
| Equipment Reliability Asset-focused Metrics |
Execution & Productivity Workforce-driven Metrics |
Financial Efficiency Cost-oriented Metrics |
|
|---|---|---|---|
| Leading Indicators Predictive & Planning |
PM Compliance %
Percentage of planned maintenance completed on schedule. World-class benchmark: >85%.
|
Schedule Adherence
The accuracy of estimated task durations vs actual execution time.
|
Wrench Time Planner %
Ratio of planned productive hours against total scheduled shift limits.
|
| Live Action Tracking Operational Reality |
MTTR (Mean Time to Repair)
Speed of breakdown resolution. Directly impacted by iFactory mobile tools.
|
Work Order Backlog
Total estimated hours of pending work. Targets 2-4 weeks of buffer flow.
|
Spare Part Stockout %
Frequency of stalled repairs due to unavailable critical stores items.
|
| Lagging Results Performance Outcomes |
MTBF (Mean Time Between Failures)
The ultimate reliability metric. Rising MTBF equals rising uptime.
|
Rework Percentage
Jobs repeated within 30 days due to poor initial execution quality.
|
Maintenance Cost / Ton
Total maintenance spend divided by verified steel tonnage output.
|
How iFactory Makes KPI Tracking Actionable
Raw data is only as good as the response it drives. iFactory’s Analytics module bridges the gap between historical reporting and live, operational decision-making. View a live dashboard environment tailored to your facility.
Automated Data Aggregation
No more manual entries. Running hours pull from SCADA, spare parts values pull from SAP MM, and repair durations log automatically as field technicians scan and close work orders via the mobile application.
Predictive Anomaly Alerting
Using AI, the platform detects when KPI variances breach normal ranges — such as unexpected micro-stoppages on a cold rolling mill — triggering immediate investigative work orders before a catastrophic failure.
Drill-Down Root Cause Visibility
If MTTR spikes by 40% in a specific zone, the dashboard allows managers to click through the metric to the exact work orders, seeing whether the delay was due to missing spares or permit wait times.
Impact of Shifting from Reactive to Leading KPIs
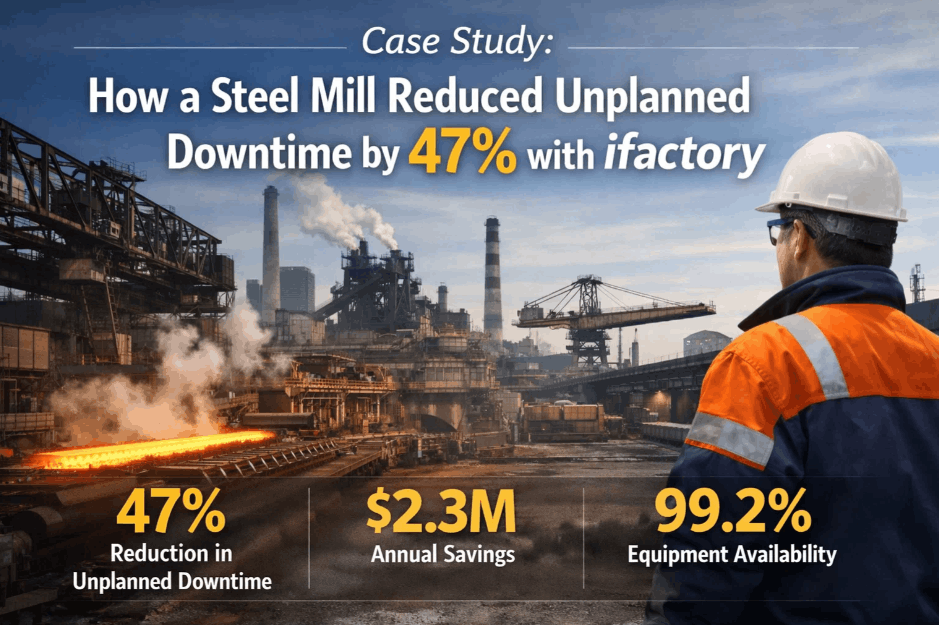
Verified results from a 3.8 MTPA flat products mill transitioning from end-of-month manual KPI reviews to iFactory's automated live dashboard tracking over an 18-month deployment period.
What the General Manager Said
Our monthly KPI meetings used to be post-mortem forensics. We’d dissect why PM compliance was 50% three weeks ago, long after the associated equipment had already broken down. When we implemented iFactory's Analytics Dashboard, the veil was lifted. Being able to see live schedule adherence every morning completely shifted our accountability culture. By tracking leading indicators, our overall maintenance cost per ton naturally dropped by 14% over a single financial year without arbitrary budget cuts.
Frequently Asked Questions
Does the dashboard integrate with our legacy CMMS?
Yes. iFactory features out-of-the-box API integrations for deep connection to SAP PM, IBM Maximo, and Oracle eAM, pulling and returning data without requiring a full rip-and-replace of your core infrastructure.
How does it accurately measure MTTR?
MTTR calculations are inherently flawed when manually tracked. iFactory uses field mobile apps to clock exact timestamps—when the job card is downloaded vs when the final safety permit is closed—capturing true wrench time.
Can we configure custom KPIs for specific departments?
Yes. While we provide 15 essential pre-mapped KPIs, the control limits and formulas can be edited. A rolling mill department easily customises their analytics to track roll degradation metrics separately from the primary dashboard.
Who actually owns and views the dashboard?
Access is role-based. Shift supervisors see detailed 24-hour compliance grids; reliability engineers view predictive component trends; and the Plant Head gets an aggregated weekly overview of the facility’s risk profile.
See Your Live Analytics Dashboard in Action
Book a guided sandbox demonstration to see how fast legacy metrics map to live iFactory insights.