Quality managers in textile mills spend a disproportionate share of their week compiling reports rather than acting on what those reports reveal — pulling defect counts from inspection logs, cross-referencing them against machine and shift data, and writing narrative summaries that repeat much of the same structure week after week. That time spent formatting spreadsheets is time not spent walking the floor or investigating why a particular defect keeps recurring on a particular machine. Mills looking to reclaim that time can Book a Demo to see how automated quality reporting handles the compilation work so quality teams can focus on the analysis.
The Hidden Cost of Manual Quality Reporting
Manual quality reporting feels like a routine administrative task, but its true cost shows up in two places most mills underestimate: the hours quality staff spend compiling data rather than analyzing it, and the delay between a defect trend emerging and someone actually noticing it. A quality inspector filling out a shift report by hand, then a supervisor compiling those shift reports into a daily summary, then a quality manager compiling daily summaries into a weekly report, introduces multiple manual handoffs where errors creep in and where the underlying data — which machine, which shift, which operator, which defect type — gets progressively flattened into summary numbers that lose the detail needed to actually diagnose a root cause.
Three Report Types, Three Different Jobs to Do
Shift, daily, and weekly quality reports are not simply the same information at different levels of aggregation — each serves a distinct operational purpose and needs to be optimized for the decision it supports. A shift report needs to flag anything urgent enough for the next shift or the current supervisor to act on immediately. A daily report needs to give plant leadership a clear picture of whether the day's production met quality targets and where attention is needed the following day. A weekly report needs to surface trends that are invisible at the shift or daily level — a defect rate creeping upward gradually on one specific machine over several days, for example, that no single shift report would flag as unusual on its own.
Shift Reports
Real-time defect counts by type and location, flagged against shift-specific thresholds, with immediate escalation for any defect rate spike that could indicate a machine or process issue requiring urgent attention.
Daily Reports
Aggregated defect summary across all shifts, correlated against production volume and machine assignments, giving plant leadership a same-day view of quality performance against daily targets.
Weekly Reports
Trend analysis across the full week, machine-level and operator-level correlation, and AI-generated improvement suggestions based on recurring patterns that only become visible at this longer time horizon.
How AI Defect Summarization Actually Works
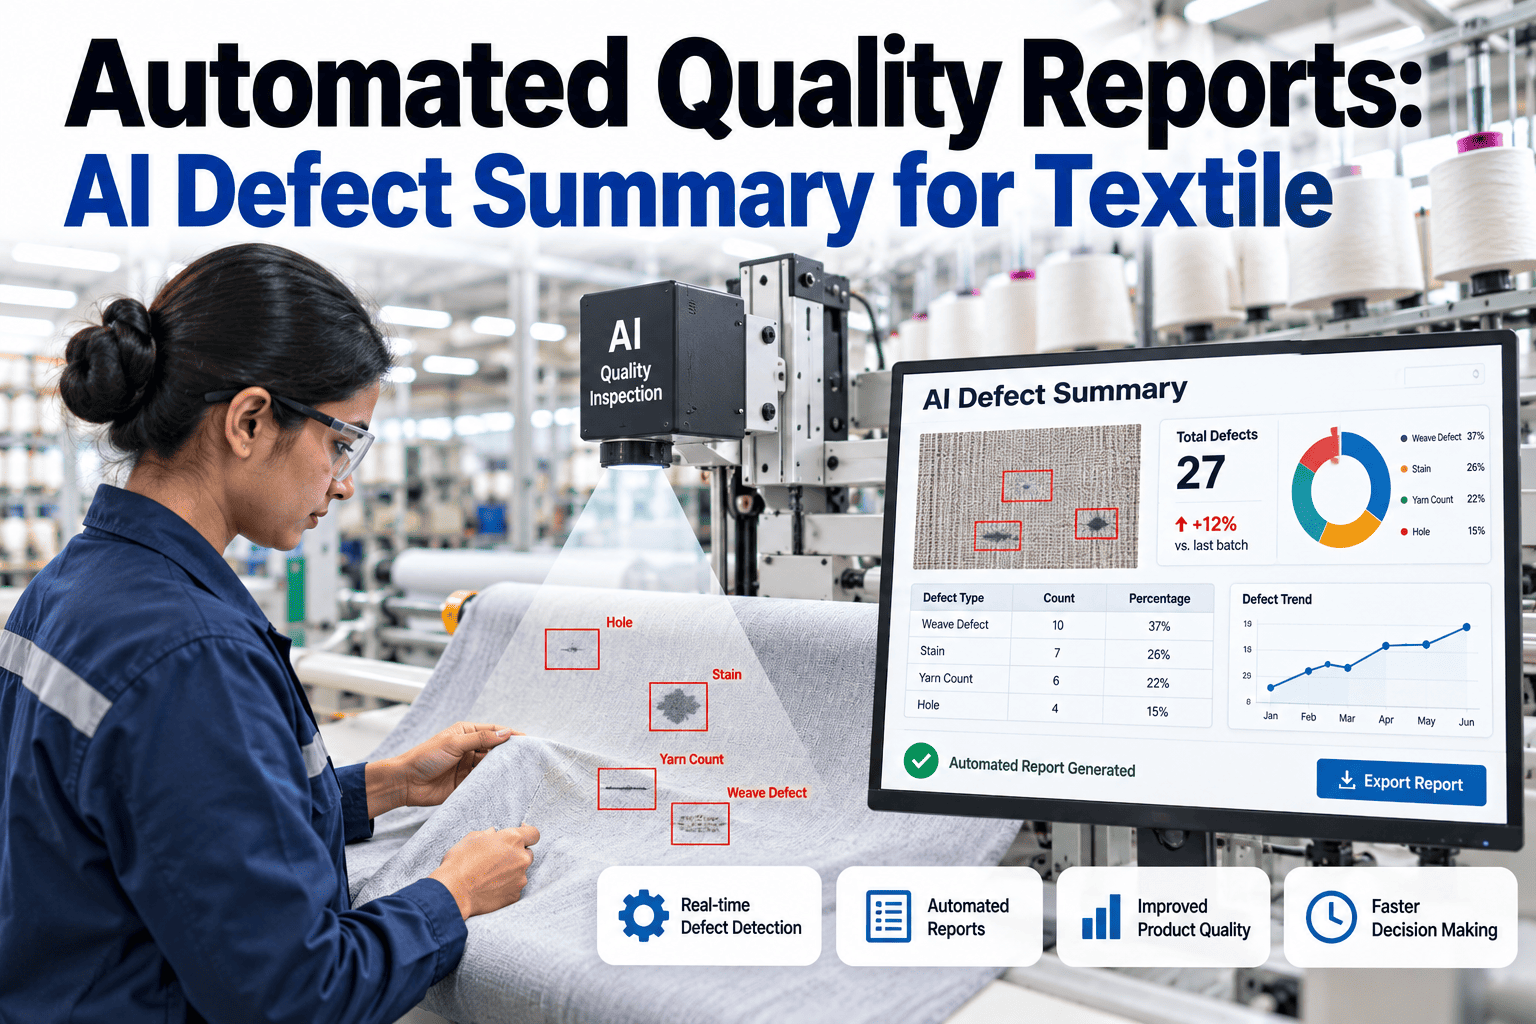
AI-generated defect summaries pull from the same underlying inspection data a manual report would use, but the automation eliminates the manual aggregation steps where detail gets lost and delay accumulates. Defect records logged at the point of inspection — whether entered through a digital inspection form or captured through automated vision-based detection — feed directly into a summarization layer that identifies patterns a human compiling numbers by hand would need considerable time to spot: a specific defect type clustering around a specific time of day, a correlation between defect rate and a particular raw material lot, or a gradual upward trend on one machine that only becomes statistically meaningful once several days of data are viewed together.
The summarization layer does more than just present numbers faster — it generates natural-language explanations of what the data shows, translating a table of defect counts into a narrative that highlights what actually changed and why it might matter. This matters because quality reports are read by people across different roles with different levels of statistical fluency, and a narrative summary that says defect rate on Loom 14 increased 22 percent over the past three shifts, concentrated in weft break defects communicates the finding far more effectively to a production supervisor than a raw data table requiring interpretation.
| Reporting Task | Manual Process | AI-Automated Process |
|---|---|---|
| Data aggregation across shifts | Manual spreadsheet compilation, hours per week | Automatic, continuous aggregation in real time |
| Trend detection across machines | Dependent on analyst noticing patterns manually | Automated correlation and anomaly flagging |
| Report narrative writing | Written manually, inconsistent detail level | AI-generated narrative summary, consistent format |
| Improvement suggestions | Based on analyst's personal experience | Pattern-based suggestions from historical outcomes |
Machine Correlation: Finding the Signal Hidden in Aggregate Numbers
One of the most valuable capabilities automated quality reporting brings is machine-level correlation performed consistently across every reporting cycle, something manual reporting processes rarely sustain because it requires cross-referencing defect logs against machine assignment records for every single defect entry. When a mill runs dozens of machines producing similar fabric, a defect rate that looks stable at the aggregate mill level can be masking a serious problem concentrated on two or three specific machines — a pattern that only becomes visible when defects are consistently tagged and correlated against machine identity rather than reported as a single mill-wide number.
This correlation capability extends naturally to operator, shift, and even raw material lot correlation, each revealing a different category of root cause. A defect pattern that correlates strongly with a specific operator across multiple machines points toward a training gap rather than an equipment issue. A pattern that correlates with a specific raw material lot regardless of which machine processed it points toward an incoming material quality issue that needs to be raised with the supplier rather than investigated as a production problem. Automated reporting surfaces these correlations as a standard part of every report cycle rather than requiring a quality manager to think to run a special investigation, which means patterns get caught faster and by more people across the organization, not just the analyst with the time and statistical background to dig for them manually.
Rolling Out Automated Reporting Without Losing Trust in the Data
Quality teams are understandably cautious about automating a process that directly informs production decisions, and a rollout that asks the team to trust an AI-generated report on day one without validation tends to generate resistance rather than adoption. The most effective rollouts run automated reports in parallel with the existing manual process for several weeks, giving the quality team a direct comparison to build confidence that the automated summaries are catching the same issues a human analyst would catch — and, ideally, demonstrating that the automation catches issues the manual process was missing due to time constraints.
Connect Existing Inspection Data
Integrate digital inspection forms, vision-based detection systems, and any existing manual entry points into a unified data feed the reporting engine can draw from.
Run Parallel Reporting
Generate automated reports alongside the existing manual process for several weeks, comparing outputs to validate accuracy before fully transitioning.
Tune Correlation Sensitivity
Adjust thresholds for what counts as a meaningful trend or correlation, balancing early detection against generating too many low-value flags.
Transition Fully and Redeploy Time
Move quality staff hours freed up by automated compilation into floor investigation, root cause analysis, and proactive process improvement work.
What Quality Teams Do With the Time Automation Returns
The real value of automated quality reporting is not the reporting itself but what quality teams do with the hours it frees up. Mills that successfully automate reporting consistently redirect that reclaimed time toward root cause investigation — actually walking the floor to understand why a flagged defect pattern is occurring rather than just documenting that it occurred. This shift changes the fundamental character of the quality department's work, moving it from a documentation function that records what happened after the fact to an improvement function that actively reduces defect rates going forward.
Building Trust in AI-Generated Narratives
A natural-language summary generated by an AI system carries a different kind of risk than a raw data table — while a table simply presents numbers for the reader to interpret, a narrative summary makes an interpretive claim on the reader's behalf, and if that claim is wrong or misleading, it can send an investigation in the wrong direction faster than a raw table ever would. This is why the strongest automated reporting implementations pair every narrative claim with the underlying data it draws from, letting a quality manager verify the summary's conclusion against the actual defect counts, machine assignments, and time-series data rather than accepting the narrative at face value.
Building this transparency into the reporting format from the start also accelerates trust-building during the parallel validation period discussed earlier. When a quality manager can see both the AI-generated statement and the specific data points supporting it side by side, discrepancies are easy to spot and correct quickly, whereas a narrative presented without its supporting evidence forces the reader to either trust it blindly or independently reconstruct the underlying analysis — neither of which builds the kind of confidence a quality department needs before relying on automated summaries for decisions that affect production scheduling or supplier relationships, and both of which slow down the very time savings the automation was meant to deliver in the first place.
Integrating Quality Reports With the Rest of the Plant
Quality reports deliver more value when they connect to the systems that act on their findings rather than existing as a standalone document that gets emailed around and then filed away. A defect trend flagged in an automated weekly report that correlates strongly with a specific machine becomes far more actionable when it links directly into that machine's maintenance history, letting a quality manager see at a glance whether the defect pattern coincides with a recent repair, a missed preventive maintenance interval, or an unaddressed condition monitoring alert on that same equipment. This kind of cross-system visibility turns a quality report from a historical record into a diagnostic tool that shortens the path from noticing a problem to understanding its likely cause.
The same integration principle applies to raw material and supplier data. A defect pattern that automated correlation traces back to a specific incoming material lot becomes actionable immediately when the report links to that lot's supplier record and receiving inspection history, giving the quality team what they need to raise a specific, evidence-backed issue with the supplier rather than a vague complaint about inconsistent material quality. Mills that build these connections across maintenance, materials, and quality data consistently report faster root cause resolution than mills where each department's data remains siloed in its own separate system, even when each individual system is well-automated on its own, because the value of automation compounds fastest at the connection points between departments rather than within any single department's isolated workflow.
Frequently Asked Questions: Automated Quality Reporting
Does automated reporting replace the need for a quality manager to review the data?
No — automated reporting replaces the manual labor of compiling and formatting data, but the judgment involved in deciding what a flagged trend means and what action to take in response still requires an experienced quality manager's review. What changes is the starting point for that review: instead of spending hours building the report before any analysis can begin, the quality manager starts directly with a structured summary and can spend their time on interpretation and action planning. Mills can Book a Demo to see how the automated summaries are structured for manager review.
How accurate are AI-generated improvement suggestions compared to an experienced quality manager's judgment?
AI-generated suggestions are strongest at identifying patterns and correlations across large volumes of historical data that would take a human analyst considerable time to find manually, but they work best as a starting point for investigation rather than a final recommendation to act on without review. Experienced quality managers bring contextual knowledge — recent process changes, known equipment quirks, supplier relationship history — that the automated system does not have access to, which is why the most effective deployments pair AI-surfaced patterns with human judgment rather than replacing one with the other entirely.
What data sources does the reporting system need to generate accurate defect summaries?
The system draws from whatever inspection data sources a mill already has in digital form, including digital inspection forms, automated vision-based defect detection, and manually entered shift logs, and it can incorporate multiple sources simultaneously as long as each defect record is tagged with basic context like machine identity, shift, and timestamp. Mills still relying primarily on paper inspection records will get the most value by digitizing inspection data capture first, since accurate machine and shift correlation depends on having that context attached at the point of inspection rather than reconstructed later.
Can the reporting format be customized for different audiences within the mill?
Yes — shift-level reports intended for floor supervisors typically emphasize immediate, actionable flags, while reports intended for plant leadership or corporate quality review emphasize trend analysis and comparison against targets over a longer time horizon, and the underlying data supports generating both formats from the same source without duplicating data entry. Contact iFactory Support for guidance on configuring report formats for your specific organizational structure.
How long does it typically take to fully transition from manual to automated quality reporting?
Most mills complete the transition within six to eight weeks, including the parallel validation period where automated and manual reports run side by side, though the timeline depends heavily on how much of the underlying inspection data is already captured digitally versus needing to be digitized as part of the rollout. Mills that have already digitized inspection forms typically move through the transition faster since the primary work becomes connecting existing data sources rather than changing how inspectors capture information on the floor, and mills starting from a largely paper-based process should plan for the digitization phase to represent the majority of the overall project timeline.
Measuring the Success of an Automated Reporting Rollout
Mills often default to measuring an automated reporting rollout purely by how much time it saves, and while hours reclaimed from manual compilation is a real and easily quantified benefit, it undersells what a well-implemented system actually delivers. The more meaningful measure is whether defect rates themselves improve over the months following rollout, since time saved on compilation only creates value if that time gets reinvested into work that actually reduces defects. Tracking both metrics together — hours reclaimed and subsequent defect rate trend — gives a fuller picture of whether the automation is delivering its intended impact or simply shifting where the team's time goes without changing outcomes.
A second useful measure is how quickly a genuine quality issue gets identified and acted on after automation, compared against the mill's historical baseline before the rollout. Mills that track time-to-detection specifically — measuring from when a defect trend statistically begins to when someone on the quality team takes a documented action in response — often see the clearest evidence of automation's value in this metric, since it captures both the speed improvement from automated trend detection and the behavioral change of the team actually acting on flagged patterns rather than letting them accumulate unaddressed in a report nobody reads closely.