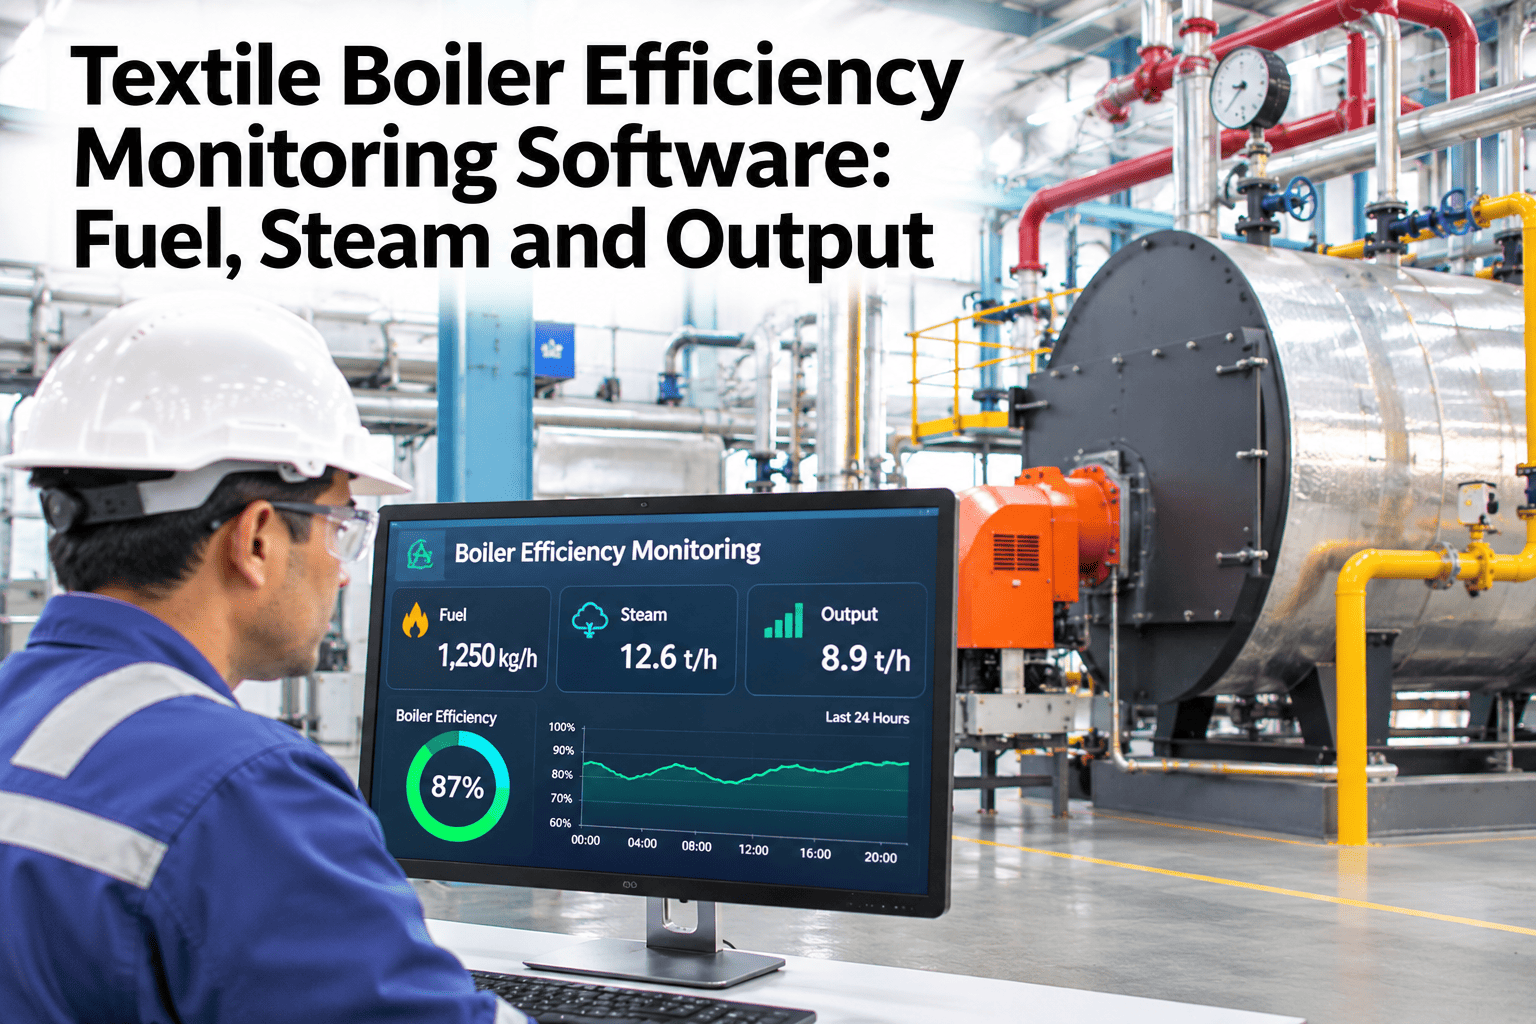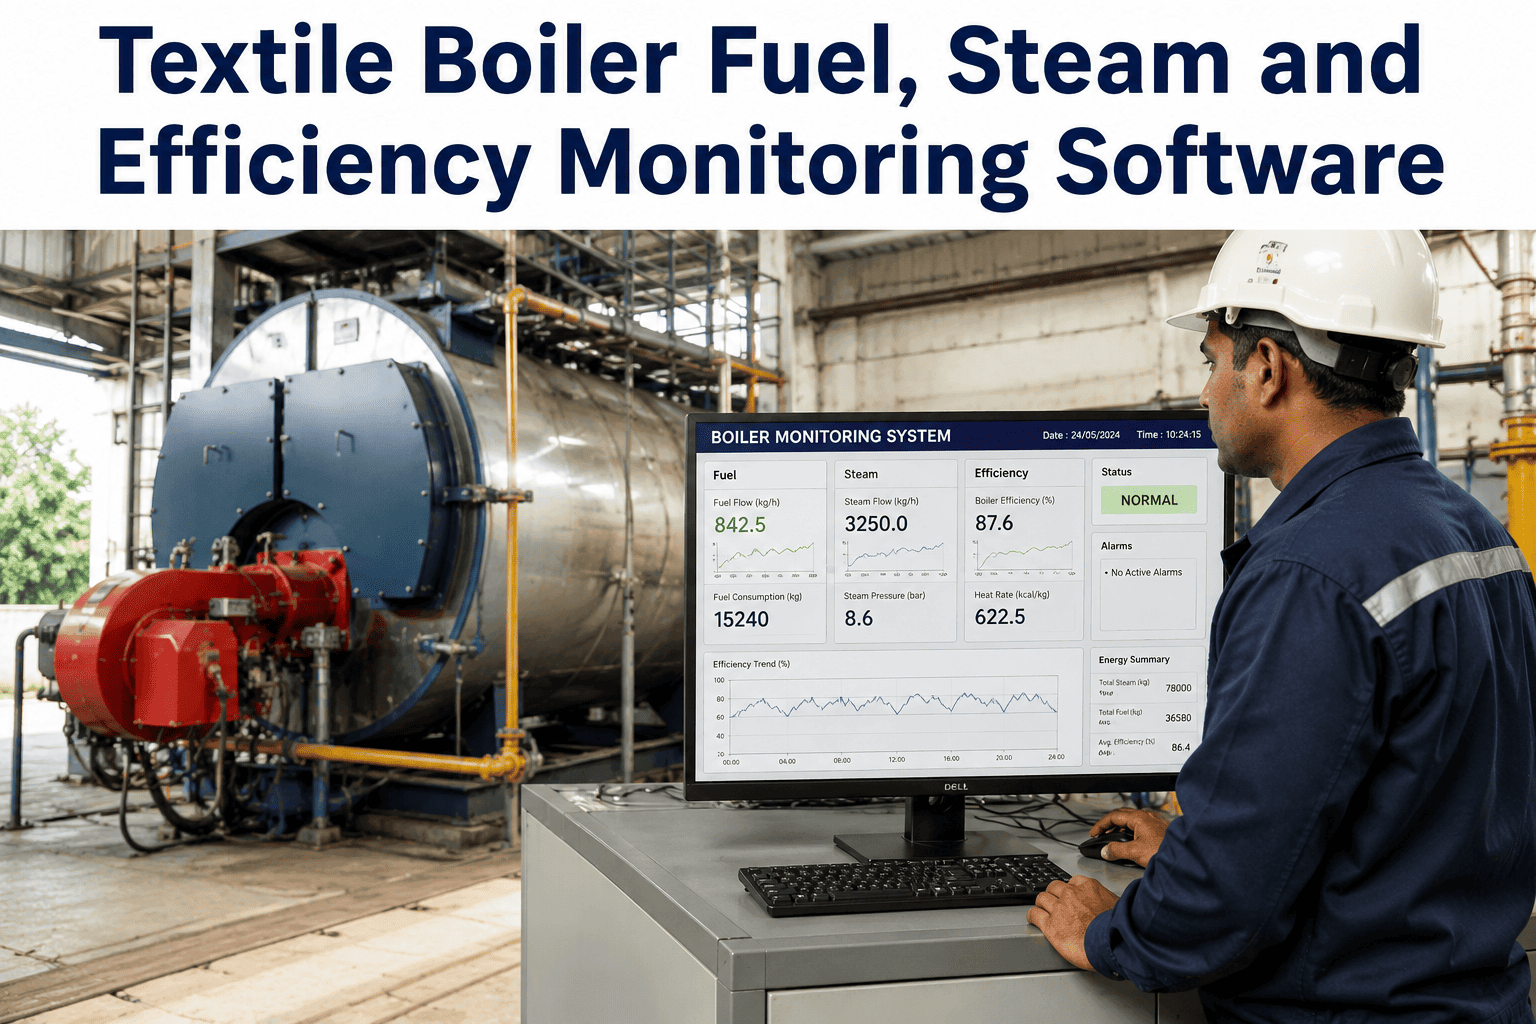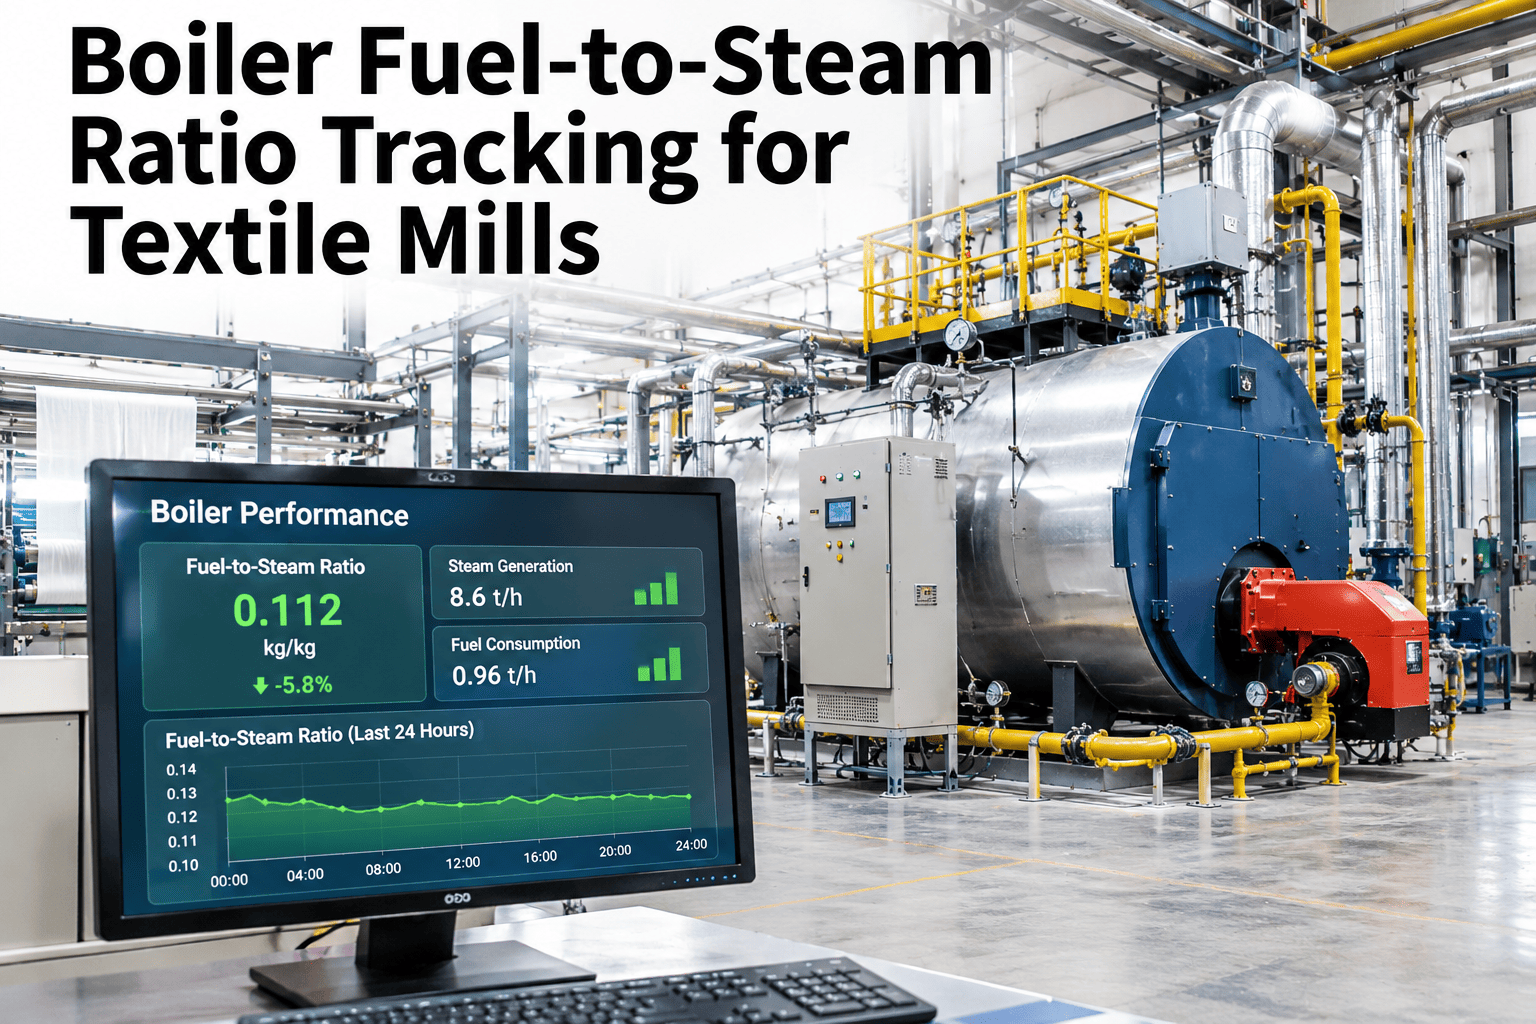
Boiler fuel-to-steam ratio tracking for textile mills means calculating how many kilograms of steam each kilogram of fuel produces, boiler by boiler and shift by shift, then watching the number for drift. A declining ratio is the earliest sign that combustion, fouling, wet steam or feedwater has changed, long before the monthly fuel bill shows it. The Bureau of Energy Efficiency in India treats it as the way to follow day-to-day and season-to-season boiler performance. iFactory, an on-premise industrial AI platform, calculates and trends it from your fuel and steam meters. See it on your boilers in a live demo.
Boiler Fuel-to-Steam Ratio Tracking for Textile Mills
Put every boiler's ratio against its own normal band. Catch the decline the day it starts, not the month the fuel bill arrives.
What is the fuel-to-steam ratio, and why track it?
The BEE defines the evaporation ratio as kilograms of steam generated divided by kilograms of fuel consumed. It works as a daily gauge because every loss in the boiler house lowers it. The facts below show how it connects to efficiency, and this walkthrough applies them to your fuel.
Why does the raw ratio mislead, and what must you normalise?
Two boilers on different fuels or pressures cannot be compared on raw ratio. Normalise the five inputs below before drawing a conclusion.
Fuel calorific value
A richer batch gives more steam per kilogram without any efficiency gain.
Feedwater temperature
Hotter feedwater means less heat needed to raise each kilogram of steam.
Steam pressure and temperature
Higher enthalpy steam takes more heat per kilogram produced.
Steam quality
Water carried over with steam inflates measured steam flow.
Raw ratio says
Kilograms of steam per kilogram of fuel, as metered. Quick to read, but it moves with fuel batch, pressure and load.
Normalised ratio says
Heat delivered to steam per unit of fuel energy. Equivalent evaporation uses 2,257 kJ/kg latent heat, so boilers compare fairly.
How do you calculate the ratio by boiler and period?
Run the BEE direct method each period and keep the raw ratio beside it. The worked case from the BEE guide shows the arithmetic, and the support desk can share the sheet.
How do you read a ratio that moves?
Build a baseline from about 30 days of tuned operation and set a normal band around it. Then read each movement by its shape, as below. The shape usually points to the cause.
Which of your boilers is drifting right now?
Bring a month of fuel and steam readings. iFactory sets each boiler's band and flags the first day it leaves it.
What does a small fall in ratio cost you?
Fuel per tonne of steam is the inverse of the ratio, so small falls add up. A move from 5.0 to 4.6 raises fuel per tonne by 8.7%, while 5.0 to 4.8 raises it 4.2%. The loss repeats every operating hour and compounds across several boilers.
Multi-boiler mills have a second lever. Ratio tracking shows which boiler converts fuel best, so the best-ratio boiler can take the base load and weaker units trim peaks. The gain depends on your fleet, so measure it before promising it.
Which mistakes make ratio tracking unreliable?
Most failed ratio programmes share four faults. Fix them first, because a trend built on poor inputs only produces false alarms. The list below follows the order in which they usually appear.
Estimated fuel weights
Coal and biomass weighed by truck count hide batch moisture. Use weighbridge or feeder data.
Uncompensated steam flow
Flow meters need pressure and temperature compensation or the reading wanders with load.
Mixed load bands
Comparing a 40% load hour with a 90% load hour makes healthy boilers look sick.
One fuel number
Gas boilers need normal cubic metres per tonne of steam, tracked the same way as solid fuel.
Natural gas, oil and solid fuel all follow the same logic. Only the unit changes, so one dashboard can hold every boiler in the mill, and a short support request maps your meters to it.
How do you roll out ratio tracking in four steps?
Meter fuel and steam
Confirm fuel, steam flow and feedwater signals on each boiler.
Set the baseline band
Use about 30 tuned days and normalise for fuel, pressure and feedwater.
Alert on shape
Flag drifts, steps and spikes separately, each with its first check.
Fix and confirm
Act on the cause, then confirm the ratio returns to its band.
How does iFactory deliver ratio tracking on-premise?
iFactory ships a pre-configured NVIDIA AI server, racked and ready, with software pre-loaded. Rack it, plug in power and Ethernet, and the AI is live. Scope covers cabling, network, PLC and SCADA integration, operator training and 24×7 remote monitoring. Ask for a pilot call to size yours.
Ship, network, data
Server arrives; fuel and steam tags connect.
Train and pilot
Bands and alerts validated on one boiler.
Go live and train
All boilers tracked, operators trained.
Frequently asked questions
What is the boiler fuel-to-steam ratio?
It is kilograms of steam produced per kilogram of fuel burned, also called the evaporation ratio. Gas boilers often use normal cubic metres of gas per tonne of steam instead. Tracked by boiler and period, it flags efficiency changes early. Book a walkthrough to see it on your own boilers.
What is a good fuel-to-steam ratio for a textile boiler?
There is no single number, because fuel calorific value, steam pressure and feedwater temperature all move the ratio. Compare each boiler against its own tuned baseline. A short baseline session sets that reference, and the support desk can help normalise it.
Why did my ratio fall when nothing changed?
Common hidden causes are a hotter stack, higher excess air, fouled surfaces, wet steam carrying water over, a new fuel batch or colder feedwater. The ratio shows the symptom, and the cause needs matching signals. Request a demo to see ratio declines traced to causes.
How often should the ratio be calculated?
Calculate it per shift for fast alerts and per day and week for trends, then compare the same load band. Seasonal shifts in air temperature also move it, so keep a seasonal view. iFactory automates all four periods, and a demo session shows them side by side.
How long does iFactory take to go live on a textile boiler house?
A typical turnkey rollout takes 6 to 12 weeks: ship and network, train and pilot, then go live with operator training. The server arrives pre-configured and ready to rack. Plan your pilot or ask the team about your site.
Make every boiler's ratio visible
Get a turnkey on-premise setup that tracks fuel-to-steam ratio per boiler and period, live in 6 to 12 weeks.