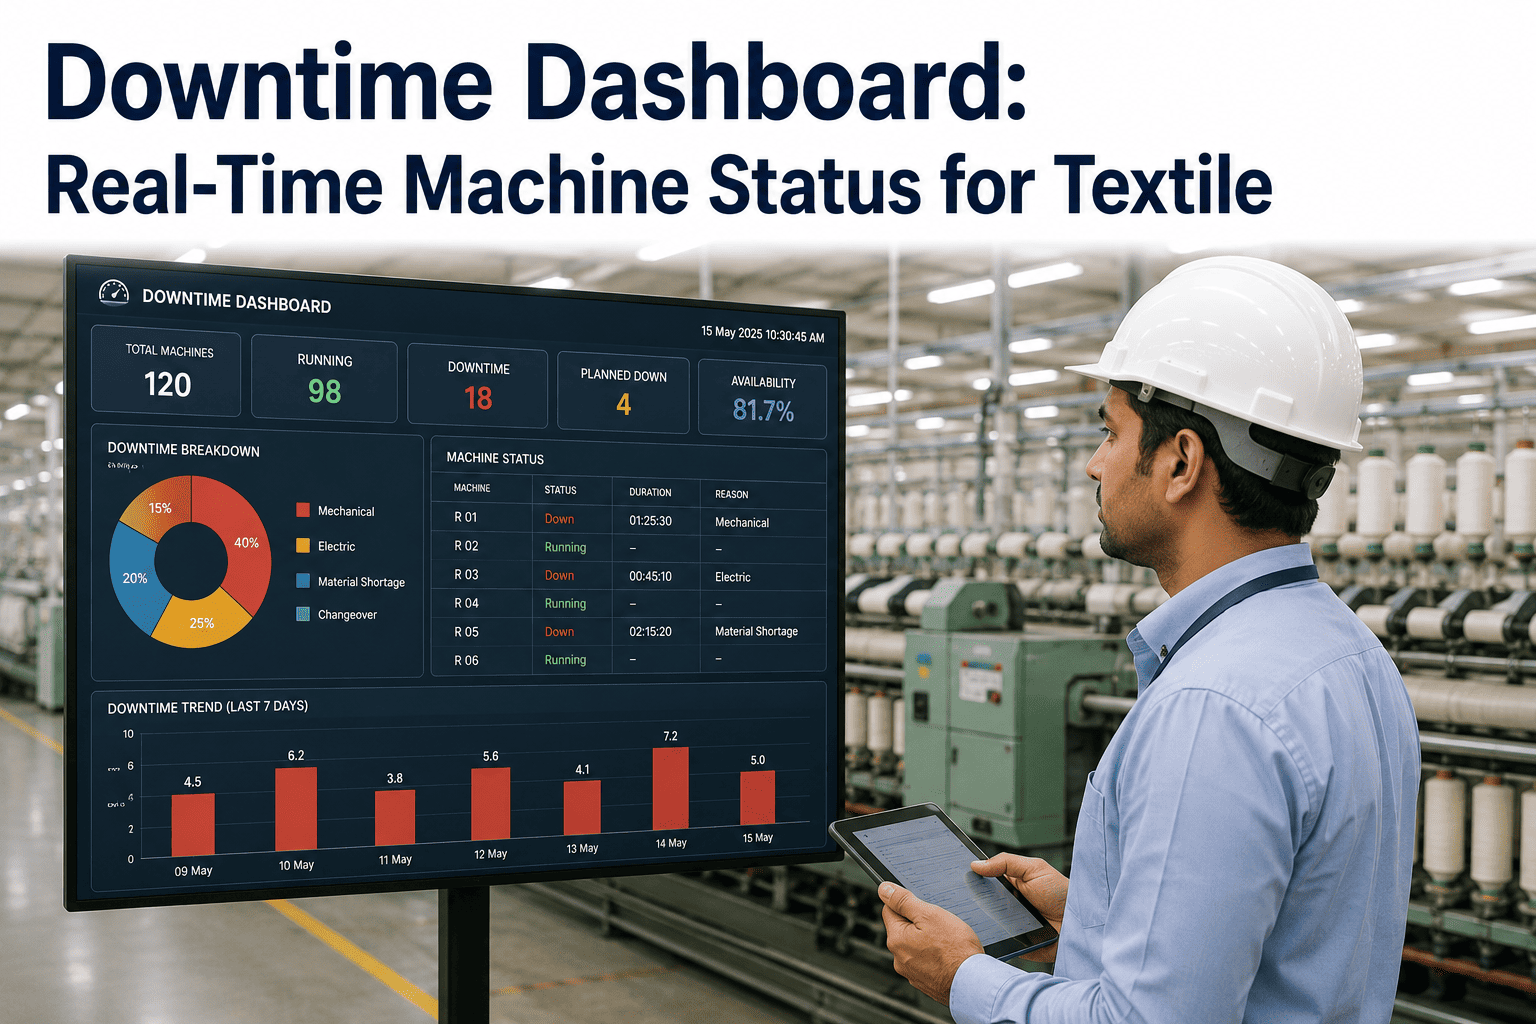
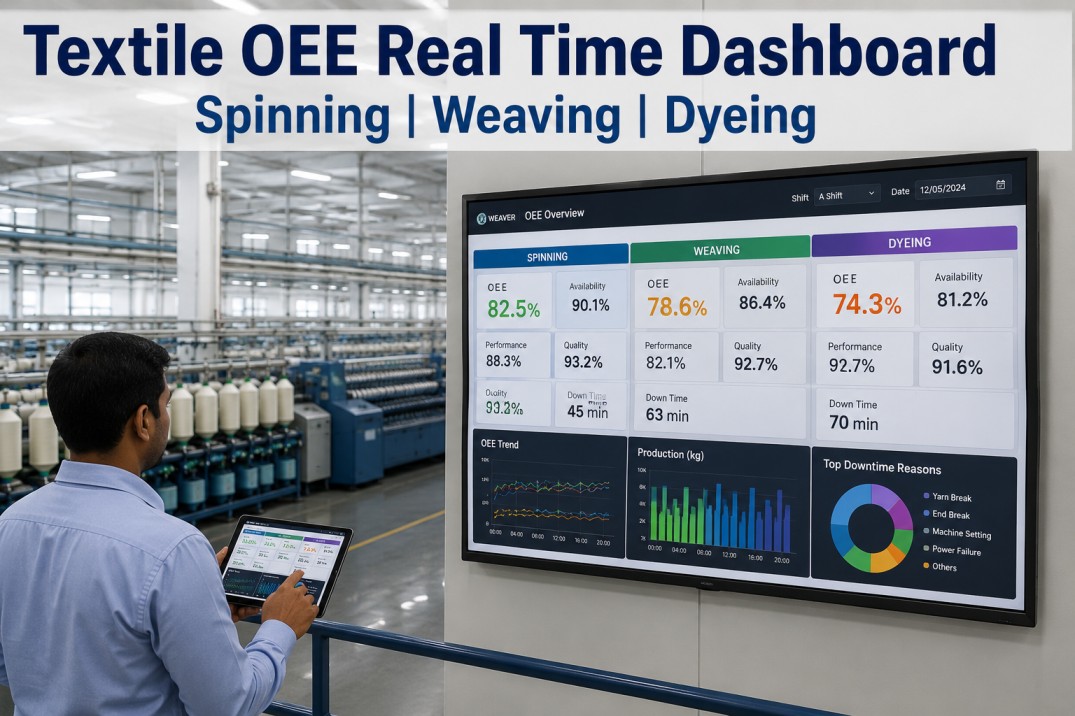
Walk into most textile production floors and you can still find the same tool tracking machine downtime that was used twenty years ago: a whiteboard near the supervisor's desk, updated by hand, usually an hour or two behind whatever is actually happening on the floor. By the time a stopped loom or an idle ring frame gets written up, logged, and escalated, the shift has often already lost the production hours a faster response could have saved. A real-time downtime dashboard replaces that lag with a live view of every machine's status, refreshed automatically as stop and start events happen, so the gap between "a machine went down" and "someone with the authority to fix it knows about it" shrinks from hours to seconds. Mills running multiple departments across spinning, weaving, and finishing who want to see this kind of floor visibility on their own machine data can book a demo before deciding whether it fits their floor.
FLOOR VISIBILITY · TEXTILE PRODUCTION
Real-Time Downtime Dashboards for Textile Production Floors
Live machine status, stop reason tracking, and department-level availability — replacing the whiteboard with data that updates itself.
2–4 hrstypical lag between a stoppage occurring and it reaching a whiteboard log
Livemachine status refreshed automatically as stop and start signals arrive
Dept-Levelavailability visibility instead of shift-level aggregated guesses
Every Shiftsame visibility on night shift as day shift, without a supervisor walking the floor
What a Live Machine Status Board Actually Shows
The core value of a downtime dashboard is simple to describe and hard to replicate manually: every machine on the floor, in one view, colored by its current state, updating the instant that state changes. A supervisor walking a large weaving shed cannot see every loom at once, and a whiteboard cannot update itself — a live status board removes both limitations, turning a floor-wide walk into a five-second glance at a screen.
Weaving Shed — Live Status
Updated continuously
L-04Running
L-05Running
L-06Down — Warp Break
L-07Running
L-08Changeover
L-09Running
L-10Idle — No Operator
L-11Running
L-12Down — Weft Break
L-13Running
Running
Down
Changeover
Idle
Stop Reason Tracking Turns Downtime Into a Diagnosis
A machine status of "down" tells a supervisor something is wrong; a machine status of "down — warp break, station 3" tells them exactly who to send and what to bring. Automatic stop reason capture, tied to the same sensors or PLC signals already reporting machine state, replaces the after-the-fact guessing that happens when a downtime reason gets logged from memory at the end of a shift.
No Operator / Staffing12%
FROM WHITEBOARD TO LIVE DASHBOARD
See Every Machine's Status Without Walking the Floor
Automatic stop and start capture means the dashboard reflects reality, not whatever got written down at end of shift.
Department-Level Availability, Not Shift-Level Guesses
Availability numbers reported at the shift level hide exactly the detail a plant manager needs to act — a shift-average availability of 82% could mean every department is running consistently around that number, or it could mean spinning is running at 94% while weaving is dragging the average down from 65%. Department-level breakdowns turn one vague number into several actionable ones.
Escalation: What Happens After a Machine Goes Down
A dashboard that shows a machine has been down for eleven minutes without prompting anyone to act on it is just a prettier whiteboard. The real value comes from an escalation ladder tied to the live status data — a defined chain that alerts the right person at the right time as a stoppage extends, instead of relying on a supervisor to happen to glance at the screen.
0–5 minOperator NotifiedStop reason prompt appears at the machine or operator handheld for immediate logging.
5–15 minLine Supervisor AlertedDashboard flags the stoppage as extended; supervisor is notified to dispatch support.
15–30 minMaintenance DispatchedIf unresolved, a work order is auto-generated and routed to the maintenance team.
30 min+Shift Manager EscalationExtended stoppages on critical assets escalate to shift leadership for resourcing decisions.
Dashboard vs Whiteboard: What Actually Changes
The comparison below is not about technology for its own sake — it is about which method actually gets a stopped machine back to running faster, and which one produces the data a plant manager can trust when deciding where to invest maintenance resources next quarter.
| Capability | Whiteboard / Manual Log | Live Downtime Dashboard |
|---|
| Update Frequency | End of shift or when someone remembers | Continuous, as events occur |
| Stop Reason Accuracy | Recalled from memory, often generalized | Captured at time of stoppage, specific |
| Night Shift Visibility | Depends on who is writing it down | Identical visibility on every shift |
| Escalation | Manual, depends on someone noticing | Automatic, time-based rules |
| Historical Analysis | Requires manual re-entry into a spreadsheet | Queryable history by machine, shift, reason |
Frequently Asked
Real-Time Downtime Dashboards — Questions From Plant Teams
Does a downtime dashboard require replacing our existing machines or PLCs?
Most textile production equipment already generates signals — a stop/start relay, a PLC status bit, or a counter — that can be tapped for status data without replacing the machine itself. Where equipment predates any electronic signaling, a lightweight sensor addition is usually enough to capture run/stop state, which is a far smaller intervention than a machine or control system replacement. The dashboard layer sits on top of whatever signal source is available, aggregating it into the live view rather than requiring a specific brand or generation of equipment underneath it.
How accurate is automatic stop reason capture compared to an operator writing it down?
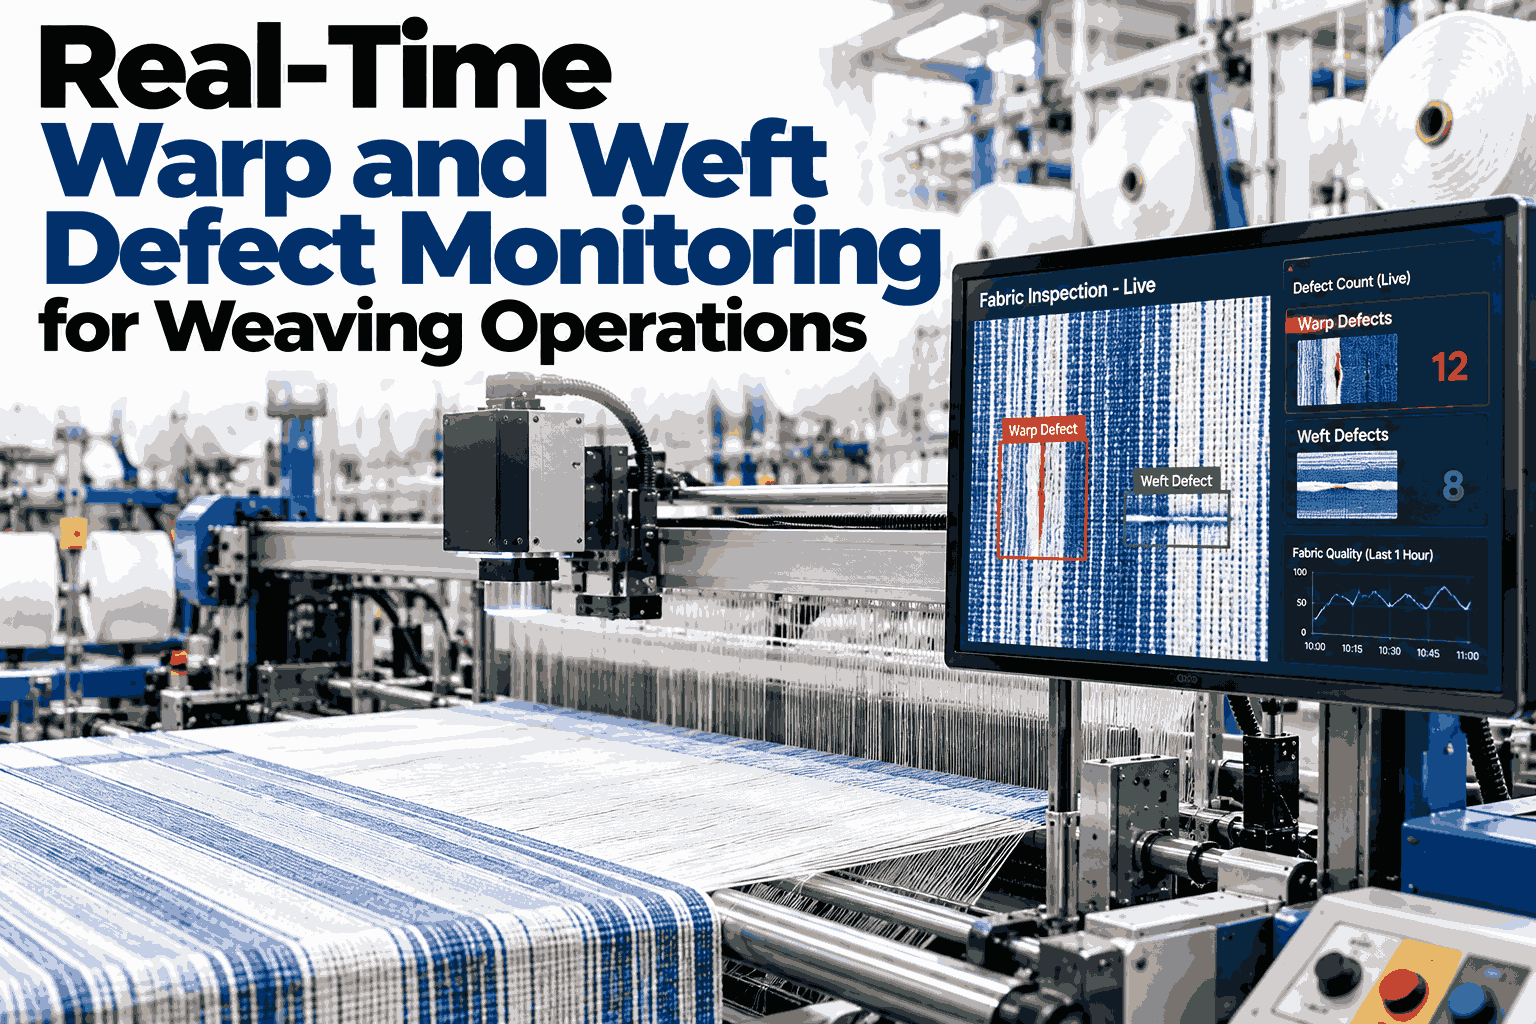
Automatic capture tends to be more accurate for the basic classification — warp break versus weft break versus mechanical fault is usually distinguishable from the machine's own signal pattern — but it benefits from an operator confirmation step for nuance a sensor cannot infer, such as which specific component failed. The combination of automatic detection plus a quick operator prompt at the machine tends to produce more consistent, more timely records than a fully manual log, because the operator is confirming a suggested reason in seconds rather than trying to recall and categorize it accurately at the end of an eight-hour shift.
Can the dashboard show data across multiple departments — spinning, weaving, and finishing — in one view?
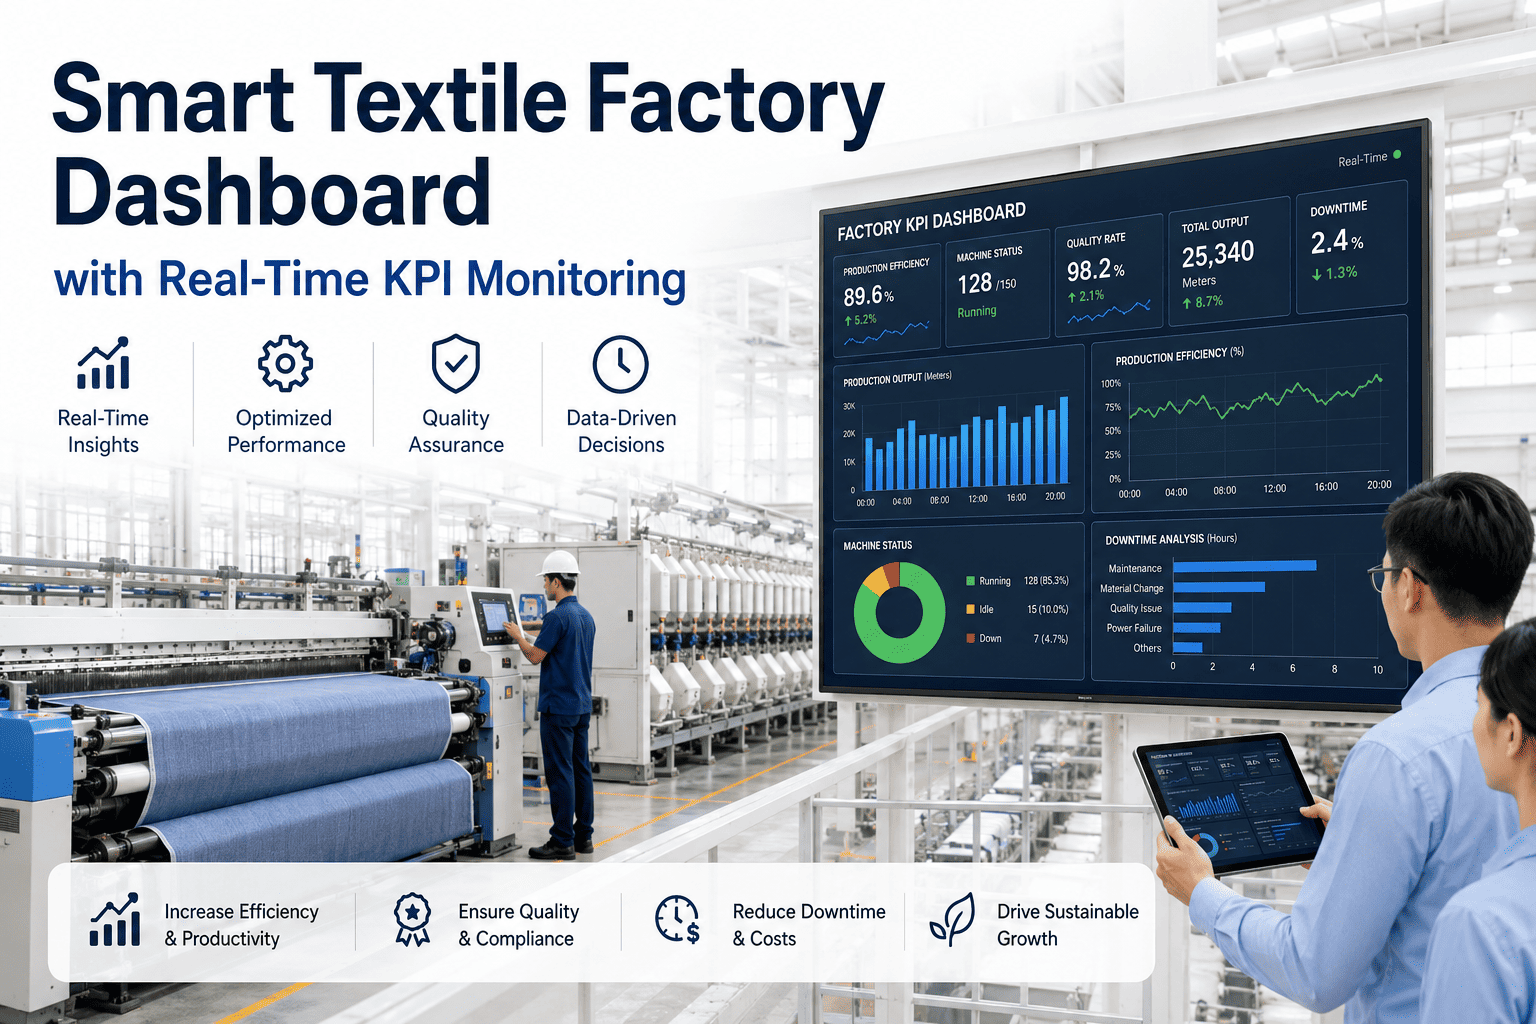
Yes, and this is one of the more valuable uses of a floor-wide system, since textile production is a sequential process where a bottleneck in one department directly limits throughput in the next. A department-level view lets a plant manager see at a glance whether weaving's lower availability is actually the constraint holding back overall output, or whether winding further downstream is the real bottleneck despite looking fine on paper — a distinction that shift-level aggregated reporting tends to obscure entirely.
What happens to historical downtime data — can we analyze trends over weeks or months?
Every status change and stop reason captured in real time is also stored as historical data, which is what makes trend analysis possible without manually re-entering whiteboard logs into a spreadsheet at the end of each week. Being able to query, for example, whether warp breaks on a specific loom are increasing month over month, or whether a particular shift consistently logs more changeover time than others, turns the dashboard from a reactive floor tool into an input for the reliability and process improvement work covered in a broader maintenance program.
How does escalation avoid becoming just another alert people learn to ignore?
Escalation rules that fire on every minor stoppage quickly train people to ignore them, so the useful design tiers the response by duration and asset criticality rather than treating every stop identically — a five-minute changeover on a non-critical machine does not need the same alert as a thirty-minute unplanned stop on a bottleneck loom. Getting these thresholds right usually takes a short calibration period after go-live, adjusting time windows based on what the floor actually finds useful versus noisy. Teams working through this calibration can walk through configuration options with
support to set escalation rules that match their specific floor layout and staffing model.
STOP FINDING OUT ABOUT DOWNTIME AN HOUR LATE
Put Every Machine's Status on One Live Screen
Real-time status, automatic stop reason capture, and department-level availability — see it running on your own floor data.