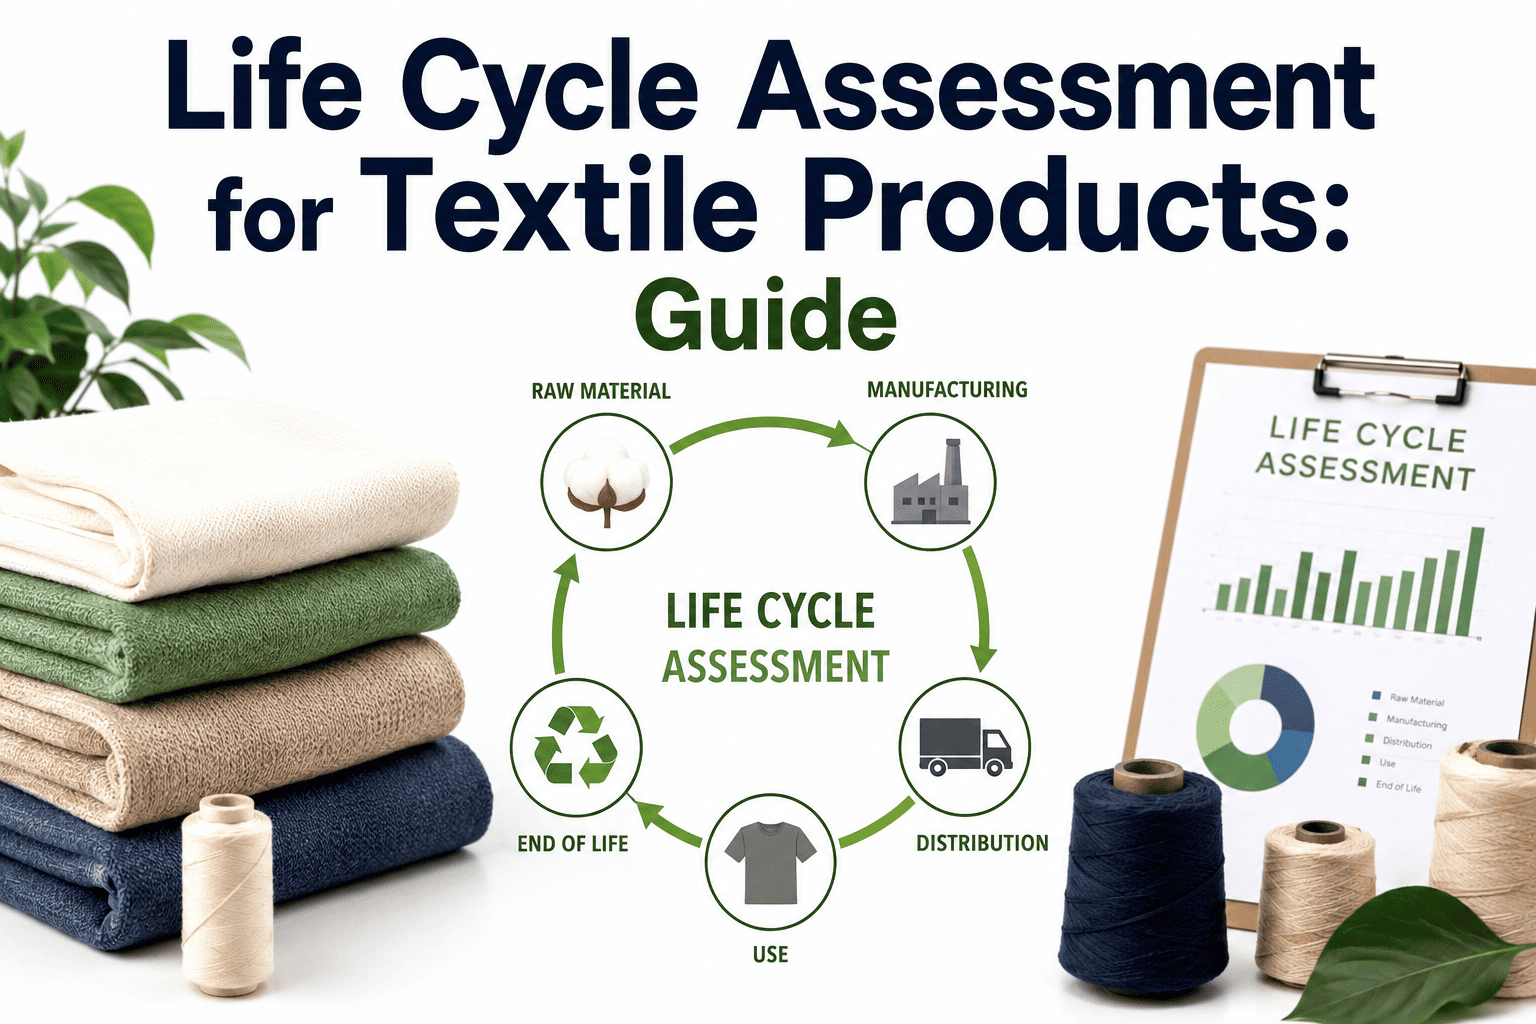
Life Cycle Assessment is the only methodology that quantifies a textile product's environmental impact from raw fiber extraction through consumer use to end-of-life disposal in a single, standardized framework. ISO 14040 and ISO 14044 define the structure. The European Commission's Product Environmental Footprint methodology defines the 16 specific impact categories that must be measured. And the textile-specific Product Environmental Footprint Category Rules define exactly how to apply those standards to apparel and fabric products — from functional unit selection to system boundary decisions to the data sources that qualify as primary versus secondary inputs. For textile manufacturers facing buyer demands for Environmental Product Declarations, EU regulatory requirements under the proposed Ecodesign for Sustainable Products Regulation, and brand sustainability commitments that increasingly require quantified lifecycle data rather than qualitative claims, a properly conducted LCA is no longer optional. It is the foundational dataset on which every other sustainability claim rests. iFactory captures the production-stage data that most textile LCAs struggle to collect — energy consumption per process, water usage per kilogram, chemical inputs per batch, and waste generation per operation — directly from the manufacturing floor, eliminating the data gap that forces most assessments to rely on generic database averages instead of facility-specific measurements. See how your production data feeds directly into LCA calculations with a Book a Demo.
The Environmental Impact of Your Textile Product Is Measurable. You Just Need the Right Data.
iFactory provides the manufacturing-stage lifecycle inventory data that makes textile LCAs accurate, auditable, and facility-specific — replacing generic database estimates with actual production measurements from your spinning, weaving, dyeing, finishing, and assembly operations.
Four Phases of a Textile Life Cycle Assessment
Every LCA conducted under ISO 14040 and ISO 14044 follows four mandatory phases, each building on the previous one. Skipping or rushing any phase produces results that cannot withstand third-party verification, buyer scrutiny, or regulatory audit — and for textile manufacturers, the consequences of a non-compliant LCA include rejected EPD applications, retracted sustainability claims, and loss of credibility with buyers who increasingly require quantified environmental data as a condition of vendor selection. The four phases are sequential but iterative — findings in the impact assessment phase routinely trigger revisions to the scope definition and inventory data collection, and the interpretation phase may reveal data gaps that require additional inventory work before the study can be finalized.
Goal and Scope Definition
Define why the LCA is being conducted (internal improvement, EPD publication, regulatory compliance, buyer requirement), what product is being assessed, the functional unit that normalizes the comparison, and the system boundary that determines which lifecycle stages are included. For textiles, this phase also requires specifying the geographic scope of production (because energy mixes and water stress vary dramatically by region) and the reference flow — typically expressed as one garment, one kilogram of fabric, or one square meter of finished textile at a defined weight.
Life Cycle Inventory (LCI)
Quantify every material input, energy input, water input, emission output, and waste output at each lifecycle stage within the defined system boundary. For a cotton t-shirt, the LCI includes irrigation water and fertilizer at the agricultural stage, electricity and steam at the spinning and knitting stage, water and chemical inputs at the dyeing and finishing stage, packaging and fuel at the distribution stage, energy for washing and drying at the use stage, and emissions at the disposal or recycling stage. This is the phase where most textile LCAs fail — because primary data from the actual manufacturing facility is unavailable, and the study defaults to generic database averages that may not reflect the specific production conditions of the assessed product.
Life Cycle Impact Assessment (LCIA)
Convert the raw inventory data into environmental impact scores across defined impact categories. The PEF methodology specifies 16 impact categories for textile products, including climate change (measured in kg CO2 equivalent), water use (measured in m3 world equivalent), eutrophication (freshwater and marine, measured in kg P and N equivalent), acidification (measured in mol H+ equivalent), and ecotoxicity (measured in CTUe). Each inventory flow — every kilogram of chemical, every kilowatt-hour of electricity, every liter of water — is multiplied by a characterization factor that converts it into the relevant impact unit.
Interpretation
Analyze the impact assessment results to identify hotspots — the lifecycle stages and processes responsible for the largest share of environmental impact in each category. For most textile products, the hotspot analysis reveals that raw material production dominates water use and land use categories, the manufacturing stage (particularly dyeing and finishing) dominates chemical toxicity and eutrophication categories, and the consumer use phase (washing and drying) dominates the climate change category — contributing up to 46% of a cotton t-shirt's total carbon footprint over its assumed lifetime of 52 wash cycles.
Cradle-to-Gate, Cradle-to-Grave, or Gate-to-Gate — Choosing the Right Scope
The system boundary determines which lifecycle stages are included in the assessment. Different business objectives require different boundary choices, and using the wrong boundary produces results that answer the wrong question. The table below clarifies when each boundary type is appropriate for textile LCA studies.
Cradle-to-Gate
Raw material extraction through finished product leaving the factory gate
Used when the manufacturer controls the production process but not distribution, retail, consumer use, or disposal. This is the most common boundary for textile manufacturers producing EPDs or reporting to brand sustainability teams, because it captures the environmental impact the manufacturer can directly influence and improve.
Does not capture use-phase impacts (washing, drying) or end-of-life impacts (landfill, incineration, recycling) — which for some textile products represent 40% to 50% of total lifecycle carbon footprint.
Cradle-to-Grave
Raw material extraction through consumer use and end-of-life disposal
Required by the PEF methodology for public environmental claims and product comparisons. This is the full lifecycle scope specified by the PEFCR for Apparel and Footwear, including consumer use modeling (number of wash cycles, drying method, ironing) and end-of-life scenarios (landfill, incineration, recycling split). Brands making public sustainability claims on product labels or marketing materials need this boundary to comply with EU Green Claims Directive requirements.
Requires assumptions about consumer behavior (washing frequency, drying method, product lifetime) and end-of-life treatment that introduce modeling uncertainty beyond the manufacturer's data.
Gate-to-Gate
Facility input to facility output — manufacturing stage only
Used for internal process optimization when the manufacturer wants to compare the environmental performance of different production methods, equipment configurations, or chemical recipes within their own facility. This boundary is appropriate for operational improvement decisions — for example, comparing the water and energy impact of two different dyeing processes on the same fabric.
Cannot be used for product-level environmental claims, EPDs, or brand reporting because it excludes upstream raw material impacts that typically dominate several impact categories.
Your Manufacturing Data Is the Missing LCI Input. iFactory Captures It Automatically.
Energy per process, water per batch, chemical inputs per operation — the gate-to-gate data that turns a generic LCA into a facility-specific one.
16 Environmental Impact Categories That the PEF Methodology Requires for Textile Products
The Product Environmental Footprint methodology specifies 16 impact categories, each with a defined unit of measurement and characterization method derived from the EF 3.1 impact assessment framework. Unlike a standard ISO 14044 LCA where the practitioner selects which categories to assess based on the study's goal, PEF requires all 16 categories to be evaluated — and for textile products, the categories most heavily influenced by manufacturing-stage data, and therefore most improved by facility-specific measurement versus generic database estimates, are highlighted below. Understanding which categories your production process dominates is the foundation of any credible improvement strategy.
Categories highlighted indicate those most sensitive to manufacturing-stage data quality — where facility-specific measurement from iFactory replaces generic database averages with the highest impact on result accuracy.
The Single Decision That Determines Whether Your LCA Produces Useful Results
The functional unit defines what is being assessed and normalizes results for comparison. Choosing the wrong functional unit produces results that are technically correct but strategically misleading — for example, comparing two fibers on a per-kilogram basis when one requires 30% less material to achieve the same garment functionality. The PEFCR for Apparel and Footwear defines the functional unit as one product used for its expected lifetime, including a defined number of care cycles.
Per Kilogram of Fiber or Fabric
Used for raw material comparisons, supplier benchmarking, and internal process optimization at the fiber or fabric level.
Does not account for differences in fabric weight, durability, or garment design efficiency. A heavier fabric scores worse per kg but may require less material per garment due to superior drape or strength properties — making the per-kg comparison misleading at the product level.
Per Garment (one unit)
Used for brand-level product comparisons, consumer communication, and internal portfolio assessment.
Does not account for garment lifetime or durability. A $5 t-shirt worn 10 times and a $30 t-shirt worn 100 times have identical per-garment impact if made from the same fabric — but the per-use impact differs by 10x. The PEFCR addresses this by incorporating expected lifetime into the functional unit.
Per Use (PEFCR Standard)
Required for PEF compliance and public environmental claims under the EU framework. The PEFCR defines product lifetime as a number of care cycles (e.g., 52 washes for a cotton t-shirt) and divides total lifecycle impact by the number of uses.
Requires assumptions about consumer behavior (washing temperature, drying method, ironing frequency) and product durability that are modeled rather than measured. However, this is the only functional unit that captures the full environmental value of product longevity — rewarding durable products over disposable ones.
LCA Impact Data by Fiber Type — Why No Single Fiber Wins Across All Categories
One of the most important insights from textile LCA studies is that no fiber type is environmentally superior across all 16 impact categories simultaneously. Cotton has the lowest carbon footprint at the cultivation stage but the highest water demand and significant eutrophication impact from fertilizer runoff. Polyester is water-efficient and land-efficient but fossil-resource intensive, generates microplastic pollution during consumer washing, and carries a high end-of-life burden in landfill scenarios. Viscose offers a renewable feedstock but involves carbon disulfide emissions that create human toxicity concerns. Lyocell reduces toxicity through closed-loop solvent recovery but carries a higher carbon footprint when produced in coal-dependent energy regions where the electricity mix overwhelms the process efficiency gains. The data below, aggregated from published peer-reviewed cradle-to-gate LCA studies, illustrates why single-metric sustainability claims about fiber choice — such as claiming one fiber is simply the most sustainable option — are inherently misleading without specifying which impact category is being prioritized.
| Impact Category | Cotton (conventional) | Polyester (virgin) | Viscose | Lyocell |
|---|---|---|---|---|
| Climate Change (kg CO2 eq/kg) | 14.1 | 9.6 | 18.4 | 21.6 |
| Water Use (m3/kg) | 2.9 | 0.1 | 0.4 | 0.3 |
| Plastic Accumulation (kg/kg) | 0.0 | 1.0 | 0.1 | 0.1 |
| Freshwater Ecotoxicity | Moderate (pesticides) | Low | High (CS2 emissions) | Low (closed-loop) |
| Fossil Resource Depletion | Low | High | Moderate | Moderate |
| Land Use Impact | High (agriculture) | Negligible | Moderate (forestry) | Moderate (forestry) |
| Eutrophication Risk | High (fertilizer runoff) | Low | Moderate | Low |
Data aggregated from peer-reviewed LCA studies (cradle-to-gate, per kg fiber). Values represent typical ranges and are significantly influenced by geographic production location, regional energy mix, agricultural practices, and processing technology vintage. Region-specific LCA using your actual production data via iFactory produces far more accurate and defensible results than these generic averages.
We spent four months trying to complete an LCA for our EPD program using data from our dyeing and finishing operations. The consultant kept asking for energy consumption per batch, water volume per kilogram of fabric, and chemical input quantities per process step — and we had none of it in a form that was audit-ready. After deploying iFactory on three finishing lines, we had six weeks of facility-specific LCI data that replaced every generic database estimate in our study. The consultant said it was the first time a textile manufacturer had provided primary data at that granularity without a dedicated sustainability engineering team.
Frequently Asked Questions
Q: What specific manufacturing data does iFactory capture that is relevant to a textile LCA study?
iFactory captures the gate-to-gate lifecycle inventory data that represents the manufacturing stage of a textile LCA: electricity consumption per machine and per process step (in kWh), thermal energy consumption (steam, gas) per batch, water intake and effluent volume per kilogram of fabric processed, chemical input quantities and types per dyeing or finishing recipe, solid waste generation per operation, and direct air emissions where monitoring equipment is connected. This data is logged continuously and timestamped, so it can be aggregated to the product level — not just the facility level — producing LCI data at the granularity that ISO 14044 requires for primary data classification. Discuss your LCA data requirements through Support Contact.
Q: Does using iFactory production data instead of generic database estimates actually change the LCA results significantly?
Yes, and the magnitude of change depends on how far the facility's actual performance deviates from the database average for that process. Generic databases like ecoinvent and GaBi provide average values that represent a statistical mean across many facilities, often from different countries with different energy mixes. A dyeing facility in a region powered by hydroelectric energy will have a fundamentally different climate change impact per kilogram than the database average, which may be weighted toward coal-dependent production regions. Studies consistently show that substituting primary manufacturing data for generic database estimates changes the manufacturing-stage impact score by 20% to 60% in the impact categories most sensitive to energy and water inputs — precisely the categories where textile manufacturers have the greatest ability to improve. Start capturing your facility-specific data with a Book a Demo.
Q: Is iFactory data compatible with standard LCA software tools like SimaPro, openLCA, and GaBi?
iFactory exports manufacturing-stage inventory data in formats compatible with the major LCA software platforms. The data is structured as process-level input-output flows — energy inputs in kWh, water inputs in m3, chemical inputs in kg, emissions in kg — that can be imported directly into SimaPro, openLCA, or GaBi to replace the generic database processes for the manufacturing stage of the textile product model. The export includes the metadata required for data quality assessment under ISO 14044 — geographic coverage, temporal coverage, and technological representativeness — which is the documentation that distinguishes primary data from secondary data in the completeness evaluation.
Q: How does the PEF methodology differ from a standard ISO 14044 LCA for textiles?
PEF builds on ISO 14044 but removes much of the methodological flexibility that standard LCA allows. Under ISO 14044, the practitioner chooses the impact categories, the characterization method, the allocation approach, and the system boundary details. Under PEF, all of these decisions are prescribed by the Product Environmental Footprint Category Rules. For textiles, the PEFCR specifies the 16 mandatory impact categories, the EF 3.1 characterization factors, the functional unit definition (including product lifetime in number of care cycles), the use-phase modeling parameters, and the end-of-life scenario splits. The result is an assessment that is far more comparable across companies but also more demanding to execute correctly, because the practitioner cannot make simplifying assumptions that deviate from the PEFCR specifications. Contact Support Contact to discuss PEF compliance requirements.
Q: Our buyers are asking for Environmental Product Declarations — does iFactory data support EPD development?
EPDs are the primary format through which LCA results are communicated to buyers, specifiers, and certification bodies in a standardized, third-party-verified format. The manufacturing-stage data that iFactory captures is the primary data input that EPD development requires for the production phase of the product lifecycle. Most EPD program operators (such as the International EPD System and EPD Italy) require that the manufacturing stage of the underlying LCA use primary data from the actual production facility wherever possible — which is exactly what iFactory provides. The platform's continuous data collection also supports EPD updates and renewals, which typically require refreshed manufacturing data every three to five years to maintain the declaration's validity. Schedule a Book a Demo to see how the data export maps to EPD requirements.
Generic Database Averages Are Not Your Production Reality. Replace Them with Measured Data.
iFactory captures the energy, water, chemical, and waste data from your textile manufacturing operations at the process level — the LCI input that turns a generic LCA into a credible, facility-specific assessment.