Ask five production managers how their spinning department performed last shift and most will answer in tons produced — a number that says almost nothing on its own, since a ton of 10s count and a ton of 60s count represent wildly different amounts of actual spindle work. Production per spindle-shift, kilograms per spindle per eight hours, and counts-per-spindle-speed conversion are the metrics that let a mill compare performance fairly across products and actually plan capacity instead of guessing at it. See how live productivity tracking normalizes across count changes with Book a Demo.
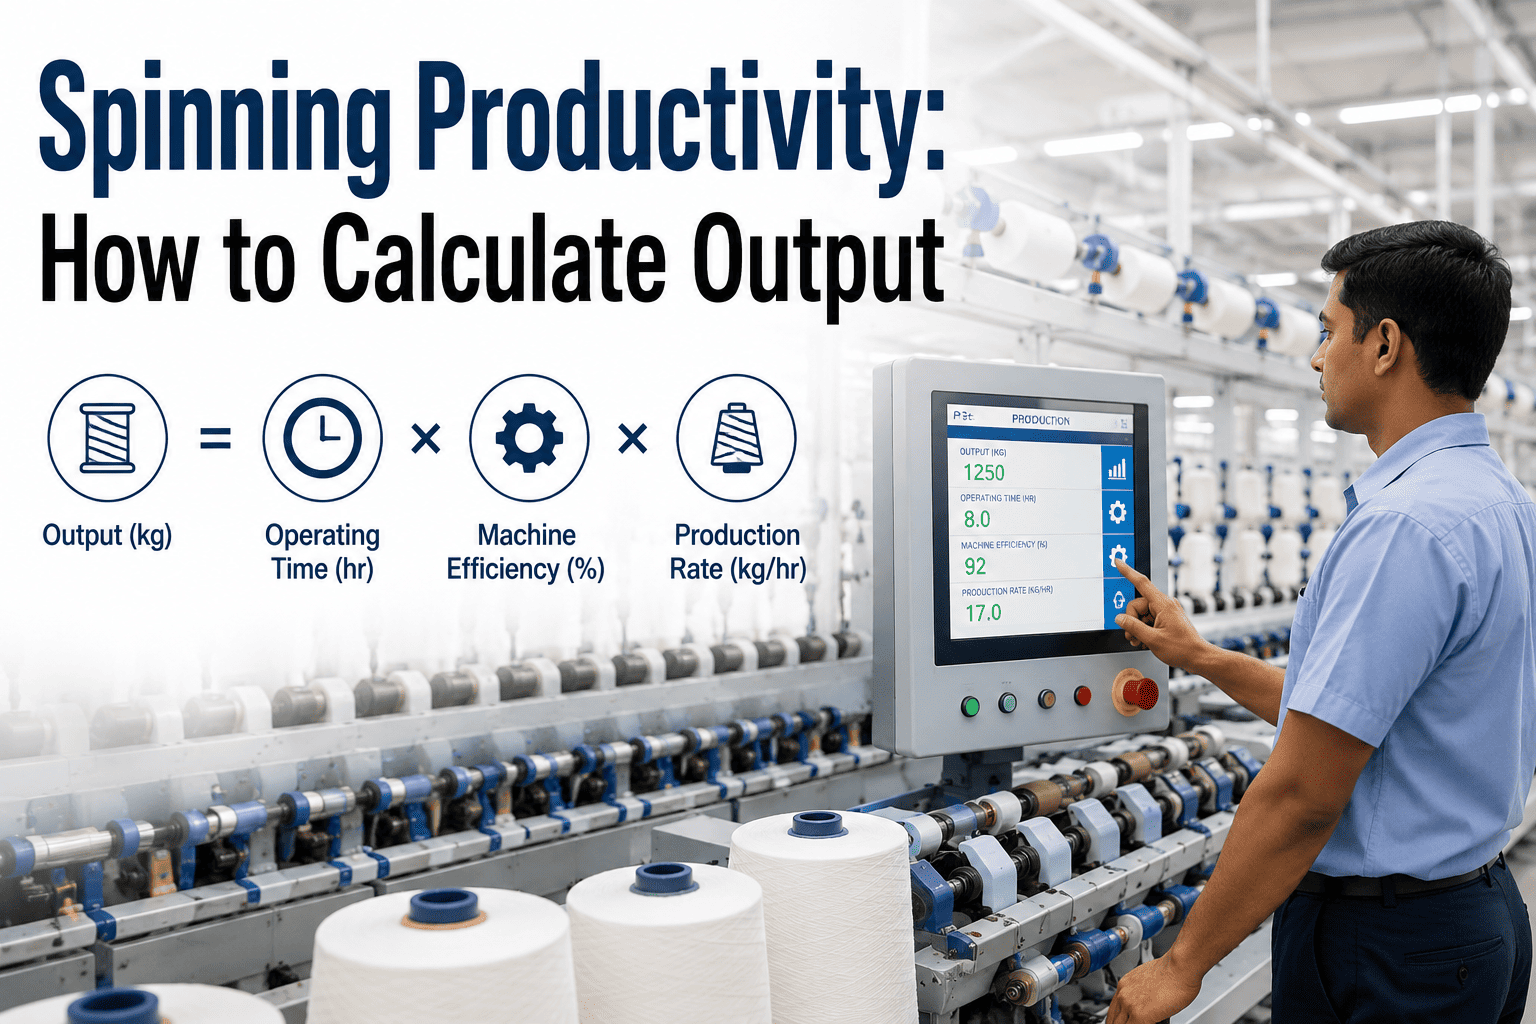
Spinning Productivity: How to Calculate Output
The core formulas behind production per spindle-shift, kilograms per spindle per eight hours, and counts-per-spindle-speed conversion, and how to use them for honest capacity planning.
Three Calculations Every Production Report Should Include
Raw output tonnage hides more than it reveals. These three normalized metrics make performance comparable across counts, shifts, and machines.
Production per Spindle-Shift
Normalizes output against both spindle count and shift duration, making it the most reliable baseline for comparing two different production runs.
Kilograms per Spindle per 8 Hours
Derives theoretical output directly from spindle speed and yarn hank, giving a target figure to measure actual performance against.
Counts-per-Spindle-Speed Conversion
Links spindle speed and twist multiplier to actual yarn delivery rate, the figure that ultimately determines production per hour for a given count.
Stop Comparing Tons Across Different Counts
See how automated productivity tracking normalizes output across every count your mill runs.
Calculating Theoretical Output for a 30s Count Run
Start with spindle speed of 18,000 rpm and a target twist multiplier of 3.8 for the 30s count being produced.
Divide spindle speed by twist per inch to derive delivery speed in meters per minute at the front roller.
Multiply delivery speed by shift duration in minutes to get theoretical length produced per spindle per shift.
Convert length to weight using the count-to-hank relationship, giving theoretical kilograms per spindle per shift.
Compare theoretical output against actual logged production to calculate efficiency percentage for that run.
Approximate Theoretical Output by Count and Spindle Speed
| Yarn Count (Ne) | Spindle Speed (rpm) | Approx. Delivery (m/min) | Theoretical kg/Spindle/Shift |
|---|---|---|---|
| 20s | 16,000 | 21.5 | 0.048 |
| 30s | 18,000 | 19.0 | 0.032 |
| 40s | 19,000 | 17.0 | 0.021 |
| 60s | 20,000 | 14.5 | 0.012 |
The Gap Between Theoretical and Actual Output
End Break Downtime
Every end break stops that spindle position until an operator restores it, directly subtracting from theoretical running time.
Doffing Time
Scheduled doffing stops the full frame temporarily, a planned efficiency loss that still needs to be accounted for honestly.
Speed Derating
Frames often run below rated spindle speed for quality reasons, reducing theoretical output below the nameplate maximum.
Changeover Loss
Count and product changeovers consume productive time that a simple theoretical formula does not capture at all.
Frequently Asked Questions
Q: What is a realistic efficiency percentage for a well-run ring spinning department?
Most well-maintained ring spinning departments achieve efficiency between 90 and 95 percent of theoretical output, with the gap primarily accounted for by end breaks, doffing time, and minor stoppages. Departments running below 85 percent efficiency typically have an identifiable root cause worth investigating, whether that is elevated end break rates, excessive doffing time, or unplanned maintenance stoppages eating into running time. Ask about live efficiency tracking against theoretical output with Book a Demo.
Q: Why does production per spindle-shift matter more than total daily tonnage for capacity planning?
Total daily tonnage conflates the effect of count changes with the effect of actual machine performance, making it impossible to tell whether a lower tonnage day reflects a genuine productivity problem or simply a shift to finer counts that inherently produce less weight per spindle. Production per spindle-shift, when tracked alongside the count being run, separates these two factors and gives a genuinely comparable performance figure across different product mixes. This distinction matters most when planning capacity commitments for orders spanning multiple counts.
Q: How does twist multiplier affect theoretical production output?
Twist multiplier and spindle speed together determine delivery speed, since a higher twist multiplier at a fixed spindle speed requires slower fiber delivery to achieve the target twist per inch. This means two runs at identical spindle speed but different twist multipliers will produce meaningfully different theoretical output, which is why productivity comparisons need to account for twist settings rather than spindle speed alone. Reach out through Support Contact to review productivity calculations for your specific count and twist combinations.
Q: Should doffing time be counted as downtime when calculating actual efficiency?
Doffing time should be tracked separately from unplanned downtime since it represents necessary, scheduled production time rather than a fault, but it still needs to be subtracted from available running time to calculate a meaningful efficiency percentage. Mills that fail to separate planned doffing time from unplanned stoppages in their reporting often struggle to identify which category is actually driving efficiency loss, since both show up as the same generic downtime figure in a simplified report.
Q: How often should theoretical output benchmarks be recalculated?
Theoretical benchmarks should be recalculated whenever spindle speed, twist multiplier, or count changes on a given frame, since the formula is directly dependent on all three variables. Mills running frequent product changeovers benefit from maintaining a pre-calculated reference table across their common count and speed combinations, rather than recalculating manually after every changeover, which introduces both delay and room for calculation error.
Calculate Efficiency Automatically, Every Shift
See live theoretical-versus-actual productivity tracking running against your own spinning data.