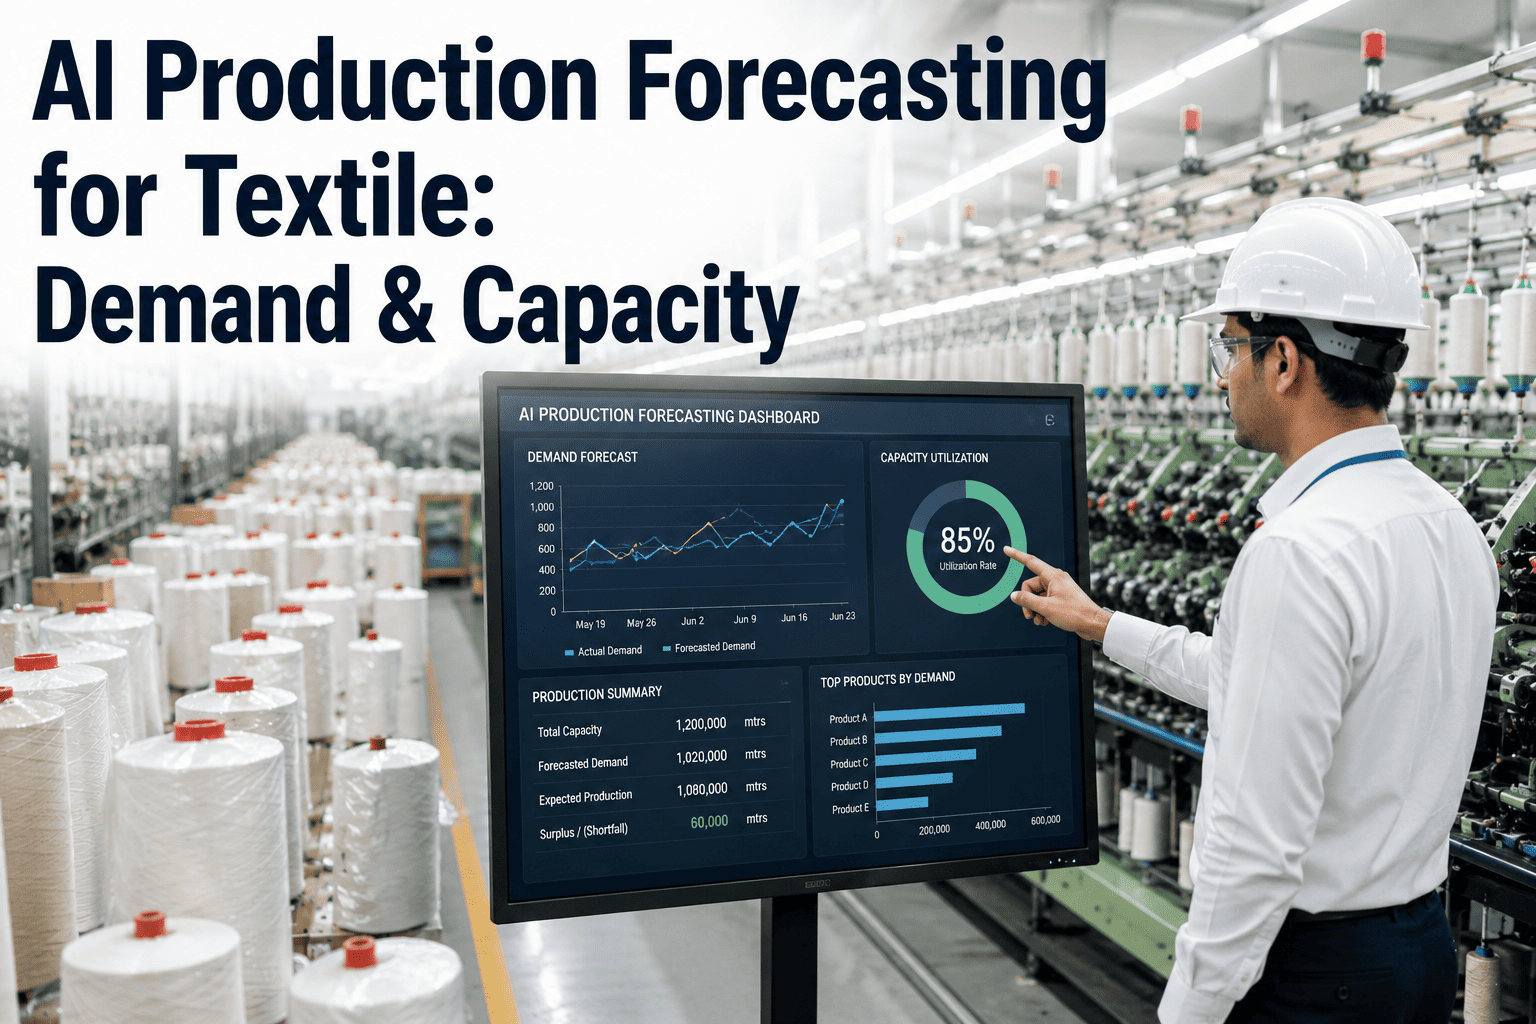
Overproduction is one of the most expensive and least discussed costs in textile manufacturing — not because mills don't notice it, but because it hides inside a dozen smaller decisions rather than showing up as one obvious mistake. A production plan built on last year's numbers plus a manager's gut feeling about this season either runs a line at full capacity making fabric nobody ordered, or runs it too conservatively and turns away business when demand spikes. Both failure modes are expensive, and both are largely preventable once forecasting stops depending on a spreadsheet and someone's memory of how last spring went. iFactory builds forecasting models around your actual order and market data, not a manual estimate refreshed once a quarter.
A Forecast That Can't Show Its Work Is a Guess Wearing a Spreadsheet
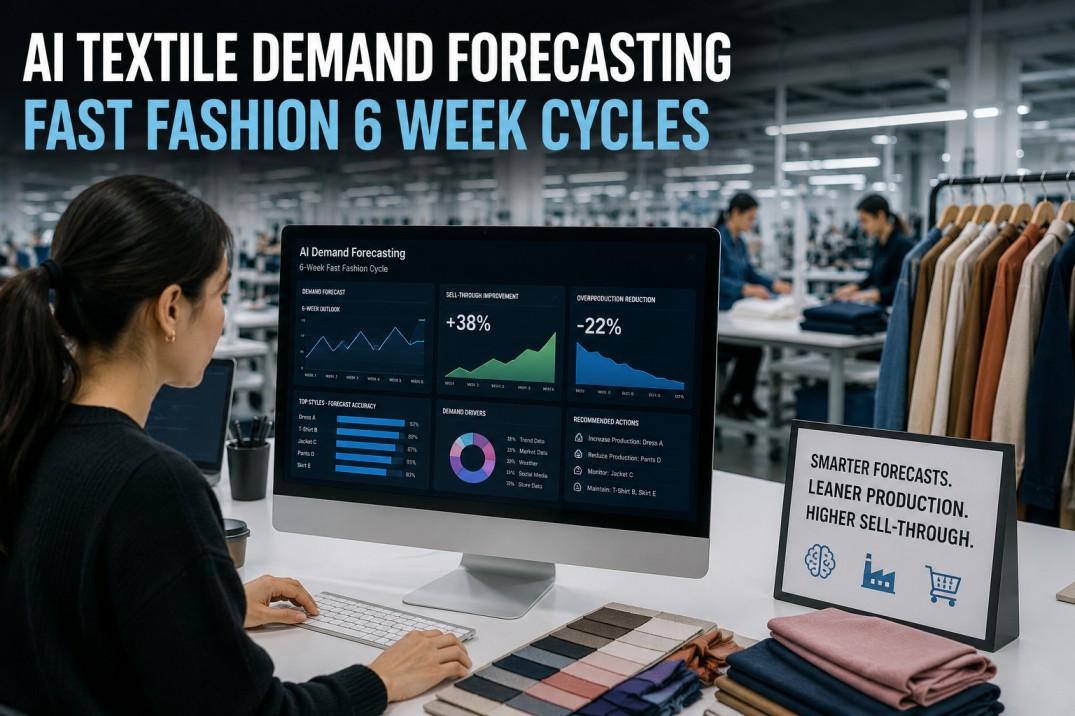
AI production forecasting for textile combines historical order data, seasonal patterns, and market signals into a traceable demand model — replacing a manager's gut feeling with a number the whole planning team can actually interrogate.
Why Textile Demand Is Genuinely Hard to Forecast Manually
Textile demand isn't a single smooth curve — it's the sum of a stable base demand layered with sharp seasonal peaks, fashion cycle shifts, and buyer-specific ordering patterns that don't always follow the calendar the same way twice. A manual planning process built on spreadsheets and one planner's institutional memory struggles precisely because that complexity doesn't compress well into a formula a person can hold in their head.
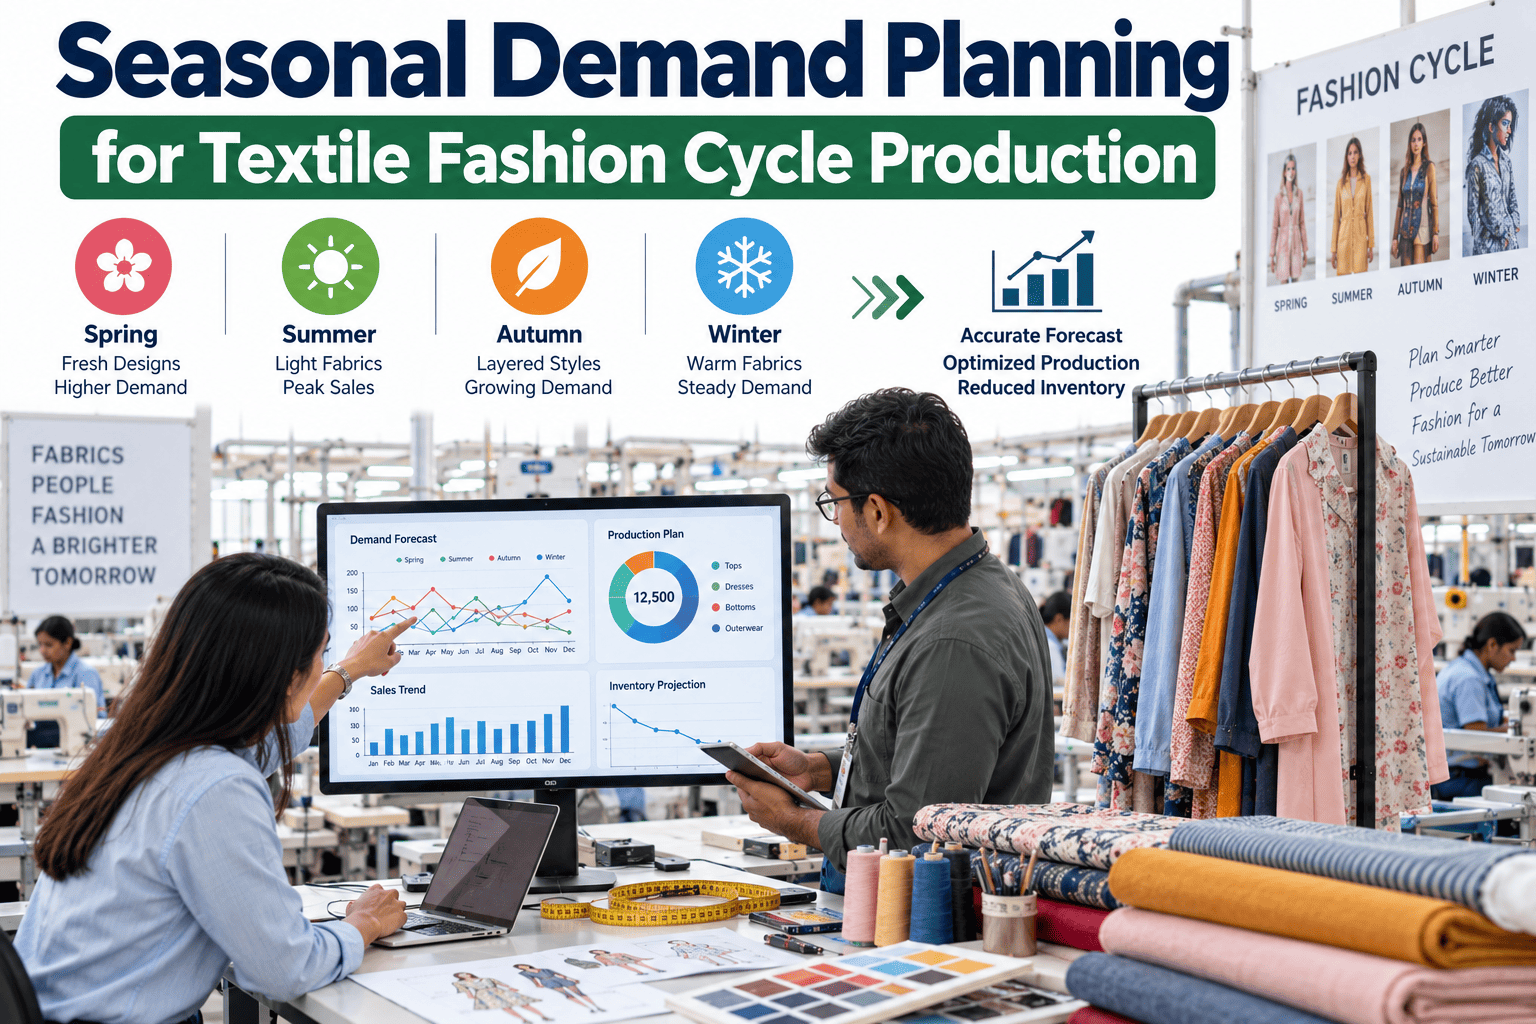
The industry most affected by this complexity is one where medium-sized enterprises still dominate, and where seasonal fluctuation is a defining feature rather than an occasional disruption. Terry cloth and home textile manufacturers, for instance, routinely face sharp seasonal peaks in spring, the holiday season, and year-end — on top of a stable base demand that never fully disappears — and continuing to plan that combination with Excel and individual employee calculations leaves real accuracy on the table that a properly trained model could capture instead.
Seasonal Peaks Layered on Base Demand
Spring, holiday, and end-of-year peaks stack on top of a stable underlying demand curve, and separating the two accurately is difficult without a model built specifically to decompose them.
Fashion Cycles Shift Independently
Style and trend cycles move on a timeline that doesn't track neatly with calendar seasons, adding a second layer of variability manual planning rarely accounts for explicitly.
Buyer-Specific Ordering Patterns
Individual buyer behavior — order timing, volume consistency, program versus spot orders — varies enough between accounts that a single blended demand curve smooths over signal a per-buyer model would catch.
Three Data Sources a Forecasting Model Actually Needs
An accurate forecast isn't built from one dataset — it's built from combining several distinct sources, each contributing information the others can't provide on their own. Skipping any one of the three leaves a real, predictable gap in forecast accuracy.
Neural network approaches applied specifically to sales and order data have shown they can uncover the complex relationships within historical demand patterns that a simple trend line or year-over-year percentage adjustment misses entirely. The value isn't in the algorithm choice alone, though — it's in feeding that algorithm a genuinely complete picture, since a sophisticated model trained on incomplete data still produces an incomplete forecast, just with more confidence attached to it than the underlying data actually supports.
What Actually Happened Before
Multiple years of order history by style, buyer, and season gives the model a genuine baseline to learn seasonal and cyclical patterns from, rather than extrapolating from a single recent period.
What's Happening Right Now
Retail sell-through data, trend indicators, and broader market movement give the model context historical data alone can't provide about where demand is heading next.
What's Actually Achievable
A demand forecast disconnected from real production capacity produces a plan nobody can execute — capacity data keeps the forecast grounded in what the plant can actually deliver.
Overproduction and Underproduction: Two Failure Modes, One Root Cause
Forecasting errors don't always announce themselves as an obvious miss — they show up as excess inventory quietly aging in a warehouse, or as a rush order nobody can fulfill because capacity was already committed elsewhere. Both outcomes trace back to the same underlying problem: a demand estimate that wasn't accurate enough to plan capacity against confidently.
Overproduction carries a sustainability cost that goes beyond the immediate financial hit, and that cost is increasingly under scrutiny from buyers and regulators alike. Producing the wrong specification at the wrong volume means water, energy, dye, and raw fiber consumed for fabric that never reaches full-value sale, and every meter dyed and finished unnecessarily represents resource consumption a more accurate forecast would have avoided entirely — not a marginal efficiency gain, but genuinely unnecessary environmental cost.
Producing more of a specific style or quantity than actual demand supports
Excess inventory ties up working capital and often ends up discounted or liquidated at a loss
Wasted raw material, water, and energy on fabric that never reaches a customer at full value
Producing less than actual demand, missing sales or straining buyer relationships with late fulfillment
Rush capacity, if available at all, typically costs more than planned production would have
Repeated stockouts damage a buyer relationship's reliability reputation over time
Neither failure mode is really about production execution — both are downstream consequences of a demand number that wasn't precise enough to plan against. Improving forecast accuracy addresses the root cause behind both simultaneously, rather than treating them as two separate problems needing two separate fixes.
From Forecast to Schedule: Closing the Loop Into Actual Production Planning
A forecast that sits in a report and never reaches the production schedule delivers none of its potential value. The real gain comes from connecting the demand model directly to capacity planning, so a forecast update automatically reshapes what gets scheduled rather than requiring someone to manually translate a report into a revised plan.
This closing of the loop is where digital twin technology increasingly enters the picture alongside forecasting. Simulating a proposed schedule change against a virtual model of the production line before committing it physically lets a planning team test the consequences of a forecast-driven adjustment — a shifted line allocation, an added shift, a reprioritized style — without the risk of discovering a bottleneck only after the physical change is already underway.
Demand Forecast Generated
The model combines historical, market, and capacity data into a demand projection by style, buyer, and time period, updated continuously rather than on a fixed quarterly cadence.
Capacity Allocated Against the Forecast
Line and machine capacity gets allocated proportionally against the projected demand mix, rather than a fixed production plan that assumes last period's mix holds steady.
Schedule Adjusts as New Data Arrives
New orders, market signal shifts, or capacity changes feed back into the forecast automatically, keeping the production schedule current rather than static until the next manual planning cycle.
A Forecast That Doesn't Reach the Production Schedule Is Just an Interesting Report
iFactory connects demand forecasting directly to capacity planning, so a shift in projected demand reshapes the actual schedule automatically.
What Forecast Precision Is Actually Worth in Practice
The value of improved forecast accuracy isn't abstract — it shows up in specific, trackable line items across a mill's operations, and understanding which levers move which costs helps justify the investment beyond a general sense that "better forecasting is good."
Working Capital Efficiency
Less capital tied up in excess finished-goods inventory means that capital is available for other uses rather than sitting on a warehouse shelf awaiting a discount sale.
Raw Material and Resource Efficiency
Producing closer to actual demand reduces the water, dye, energy, and fiber consumed on fabric that never sells at full value, directly supporting sustainability goals many buyers now require documentation for.
Buyer Relationship Reliability
Consistently meeting delivery commitments, rather than alternating between overcommitting and scrambling, builds the kind of reliability reputation that supports long-term buyer relationships and repeat business.
None of these gains require abandoning existing planning expertise — they require giving that expertise a more accurate baseline to apply judgment against, rather than asking experienced planners to compensate for a forecasting method that was never built to handle the actual complexity of textile demand.
A Composite Scenario: The Seasonal Peak That Stopped Being a Guess
A composite home textile manufacturer supplying terry cloth and bedding products to several regional retailers had historically planned its spring production run using the prior year's volume plus a manual adjustment based on the sales team's read of early order signals. That approach had produced a pattern of overshooting the spring peak by a meaningful margin in some years and undershooting it badly enough in others to miss delivery windows on a portion of retail orders.
The mill implemented an AI forecasting model trained on several years of order history alongside retail sell-through signals from its largest accounts, decomposing the stable base demand from the seasonal spring peak rather than treating the whole curve as one number to eyeball. The following spring cycle, the model's forecast tracked meaningfully closer to actual order volume than the prior manual method had in any of the preceding three years, and the mill adjusted line allocation mid-season based on the model's updated projection rather than waiting for the full season to close before recognizing the miss.
Assumptions That Undermine Textile Demand Forecasting
Last year's volume plus a manual adjustment is close enough for a mature, stable product line.
Even stable product lines carry seasonal and market variation that a simple prior-year-plus-adjustment method systematically misses, particularly at the peaks and troughs where the cost of a miss is highest.
A forecasting model needs a huge, perfectly clean historical dataset before it can produce anything useful.
A few years of reasonably organized order history is often enough to produce a directionally useful model, with accuracy improving as more data and market signal inputs accumulate over time.
Forecasting and capacity planning can stay as two separate processes without losing much value.
A forecast that doesn't feed directly into the production schedule delivers only a fraction of its potential value, since the gap between forecast and plan is exactly where manual translation errors and delay creep back in.
A Checklist Before Trusting a Forecasting Model's Output
Historical order data spans enough seasons to capture real cyclical patterns
A single year of data can't distinguish a genuine seasonal pattern from a one-off anomaly, so multiple cycles matter more than sheer data volume.
Market signal inputs are relevant to the specific product categories being forecast
Generic market trend data adds less value than signals specific to the buyer segments and product types the mill actually serves.
The forecast updates continuously rather than on a fixed quarterly cycle
Demand signals change faster than a quarterly refresh can capture, and a static forecast between updates loses accuracy the further it gets from its last refresh.
The forecast connects directly to capacity planning, not just a standalone report
A forecast sitting disconnected from the actual production schedule requires manual translation that reintroduces the delay and error the model was meant to remove.
Frequently Asked Questions
How much historical data does a textile mill need before an AI forecasting model becomes useful?
Several years of reasonably organized order history by style, buyer, and season is typically enough to produce a directionally useful model, since that span allows the model to distinguish genuine seasonal and cyclical patterns from one-off anomalies. Visit support to review what historical data is available and how it maps to a forecasting model.
Can AI forecasting account for a genuinely new product line with no order history?
A new product line can be forecast using comparable historical categories and current market signal data as a starting proxy, with the model refining its specific projection as real order data for the new line begins accumulating.
Does improved forecast accuracy actually reduce inventory costs in practice?
Yes — more accurate demand projections reduce both the excess inventory tied up by overproduction and the rush costs associated with underproduction, since both failure modes trace back to the same underlying forecast imprecision. Book a demo to see the inventory impact modeled against a specific product mix.
How often should a production forecast actually be updated?
A forecast tied to a continuous data pipeline can update as new order and market signal data arrives, which is meaningfully more responsive than the fixed quarterly or seasonal refresh cycle most manual forecasting processes rely on.
Does AI forecasting replace the judgment of experienced planning staff?
No — the model provides a data-driven baseline that experienced planners can review, adjust for context the data doesn't capture, and apply their own judgment against, rather than eliminating the planning function entirely. Contact support to see how forecasting output integrates into an existing planning team's workflow.
Plan Production Against a Forecast You Can Actually Trace
iFactory combines your historical order data, market signals, and real capacity constraints into one forecasting model connected directly to your production schedule.