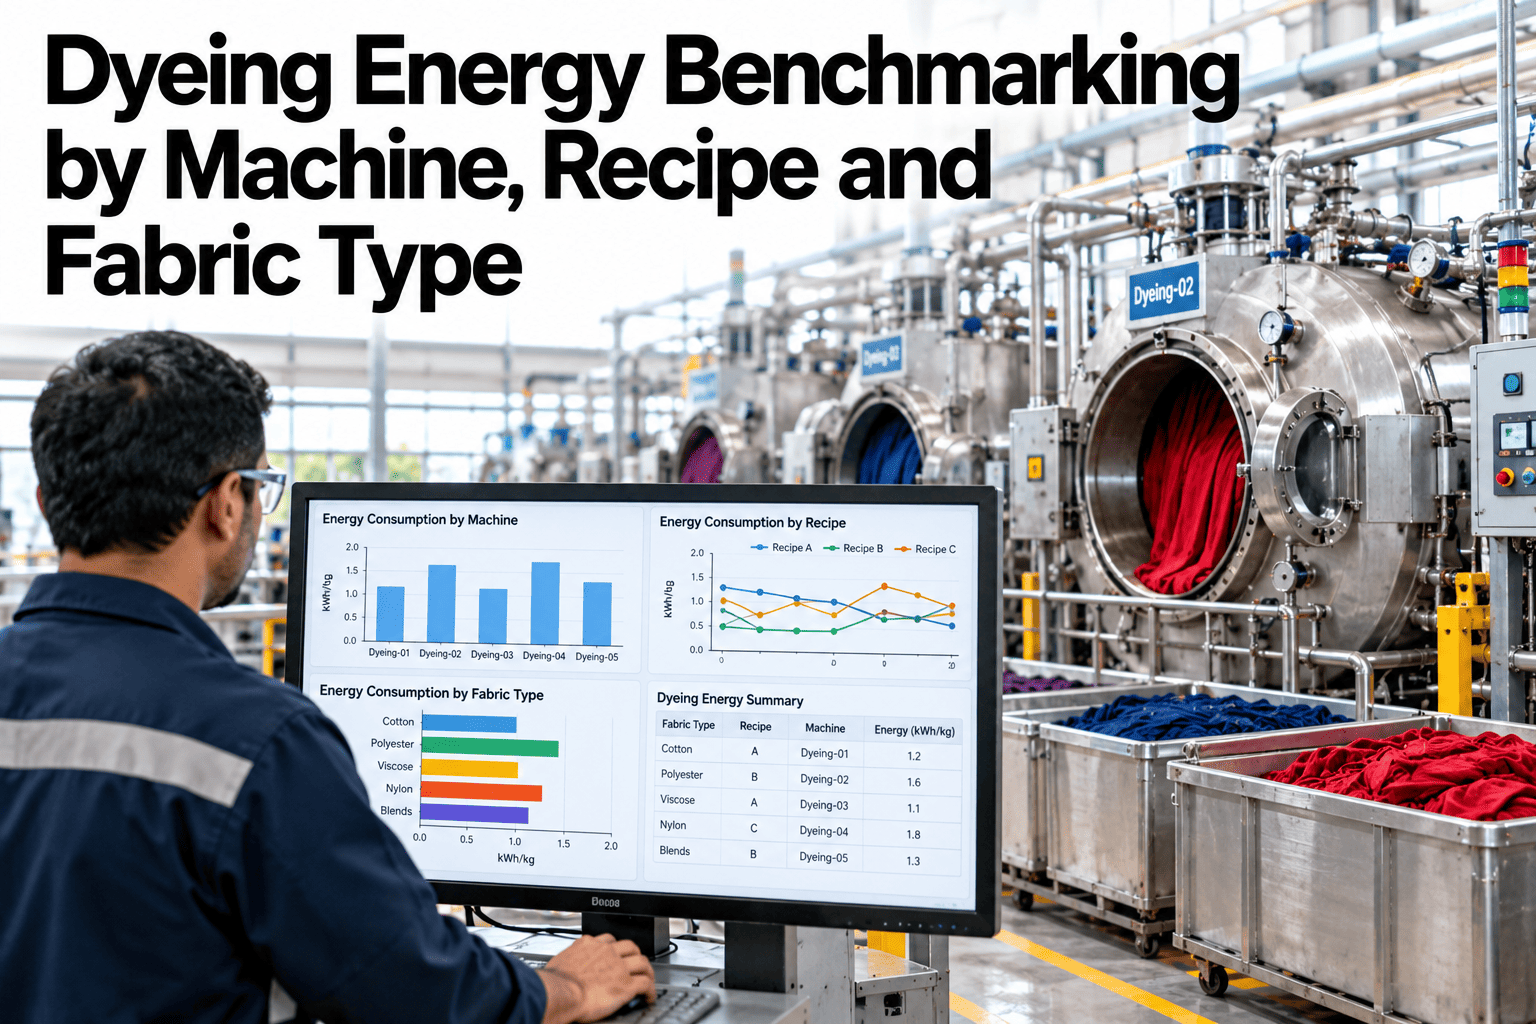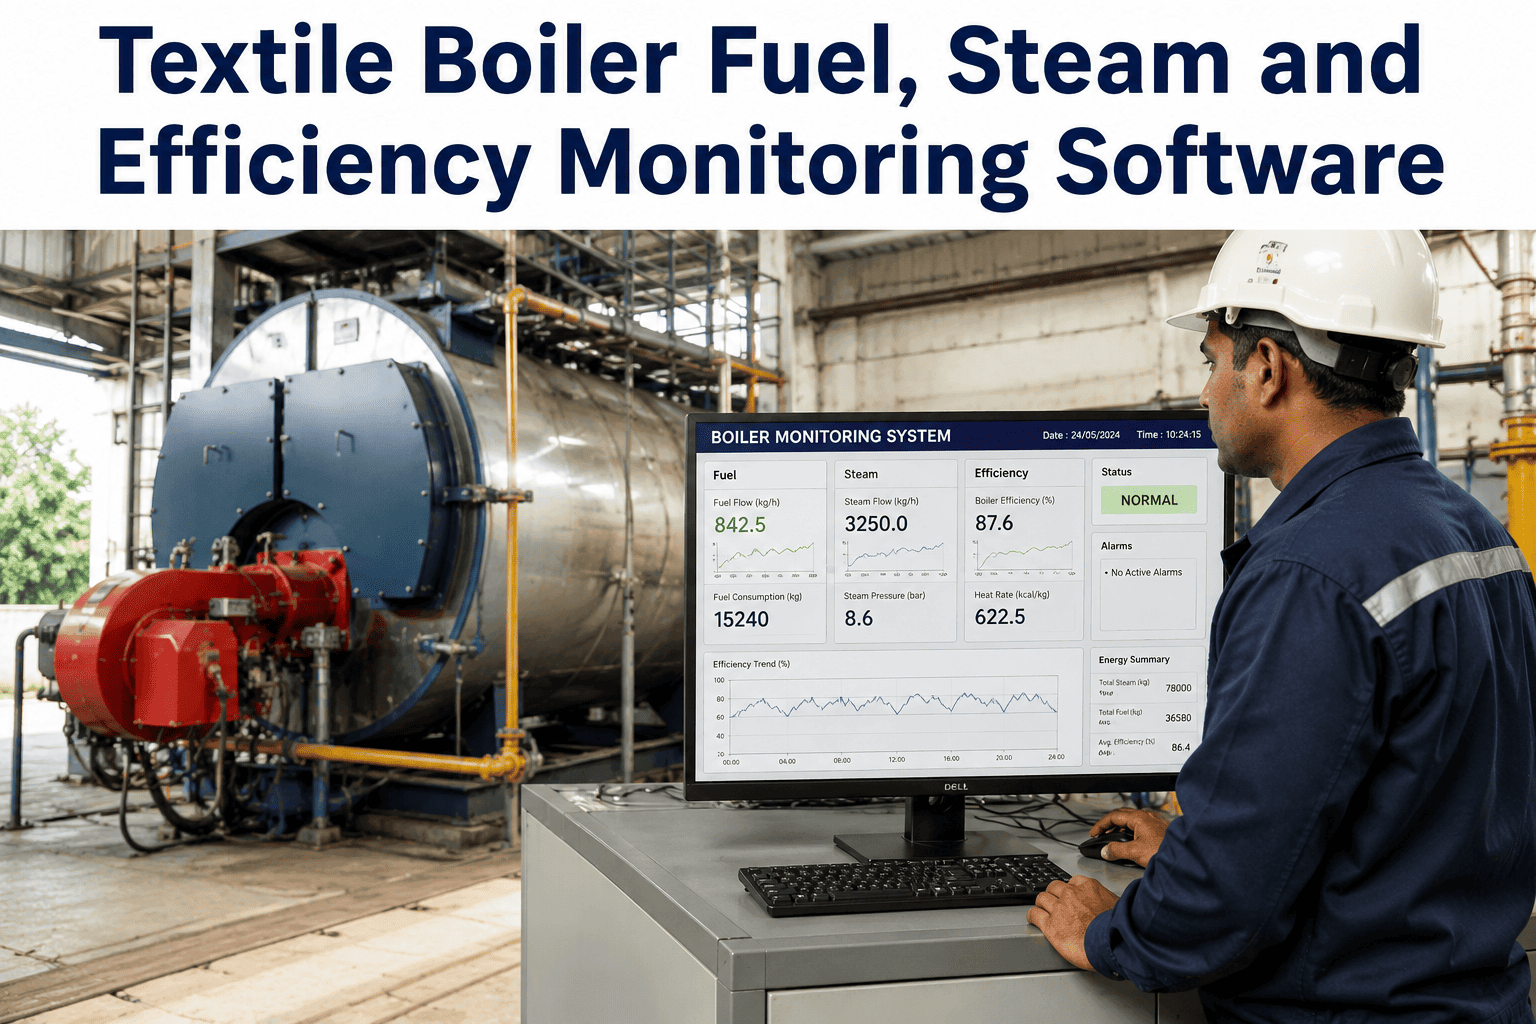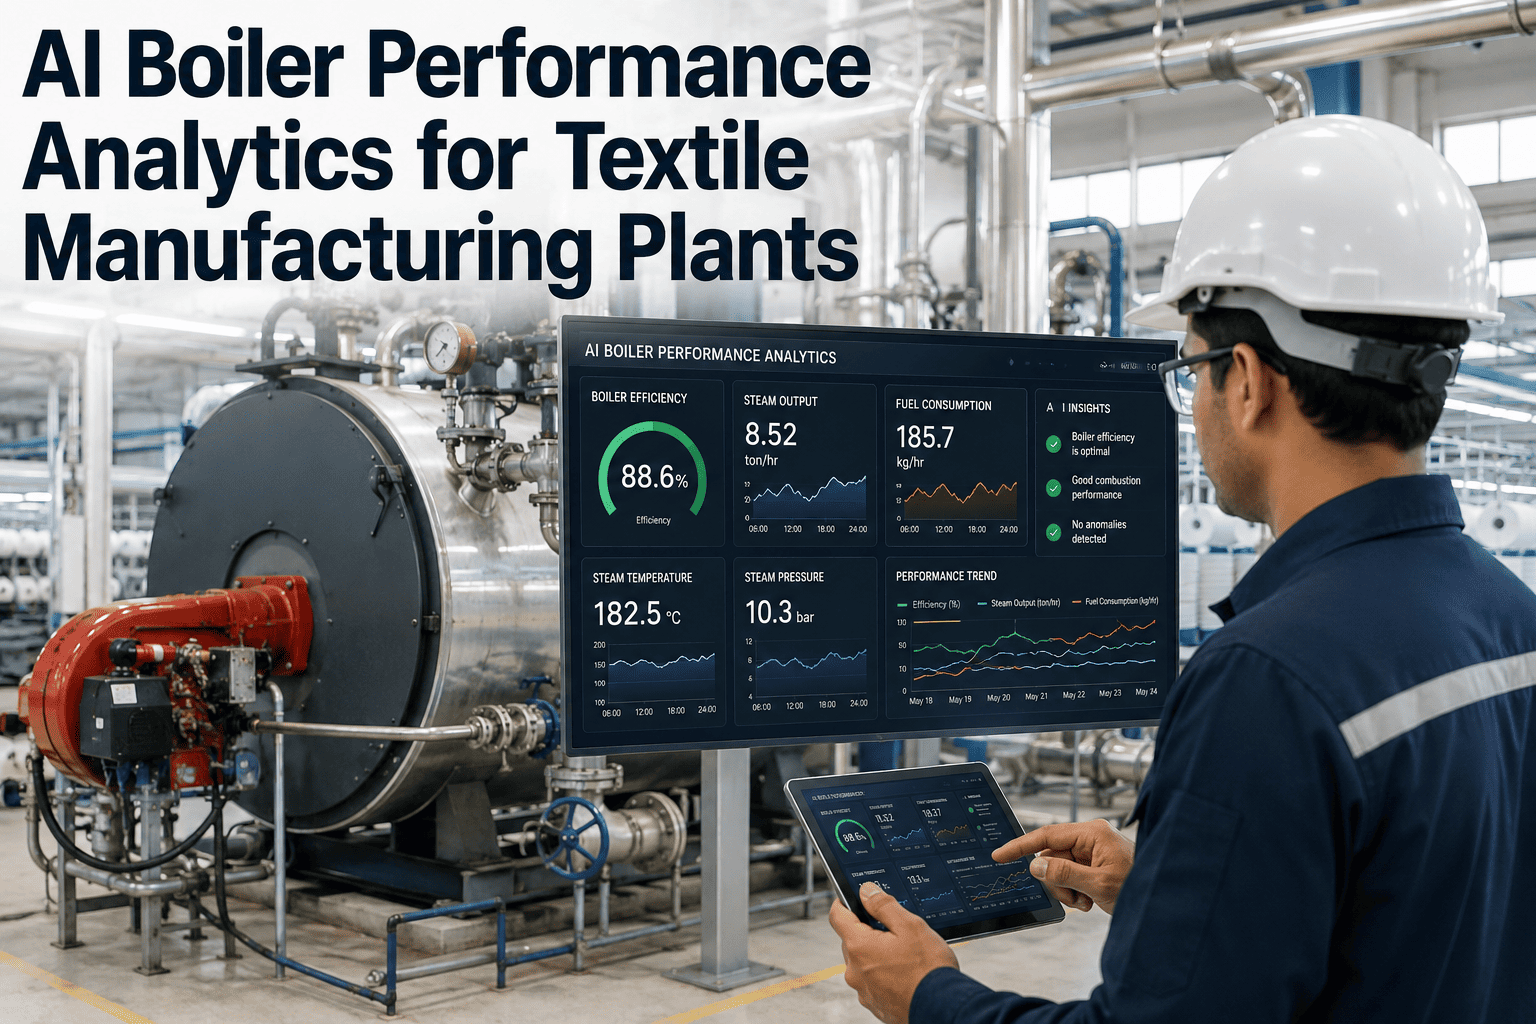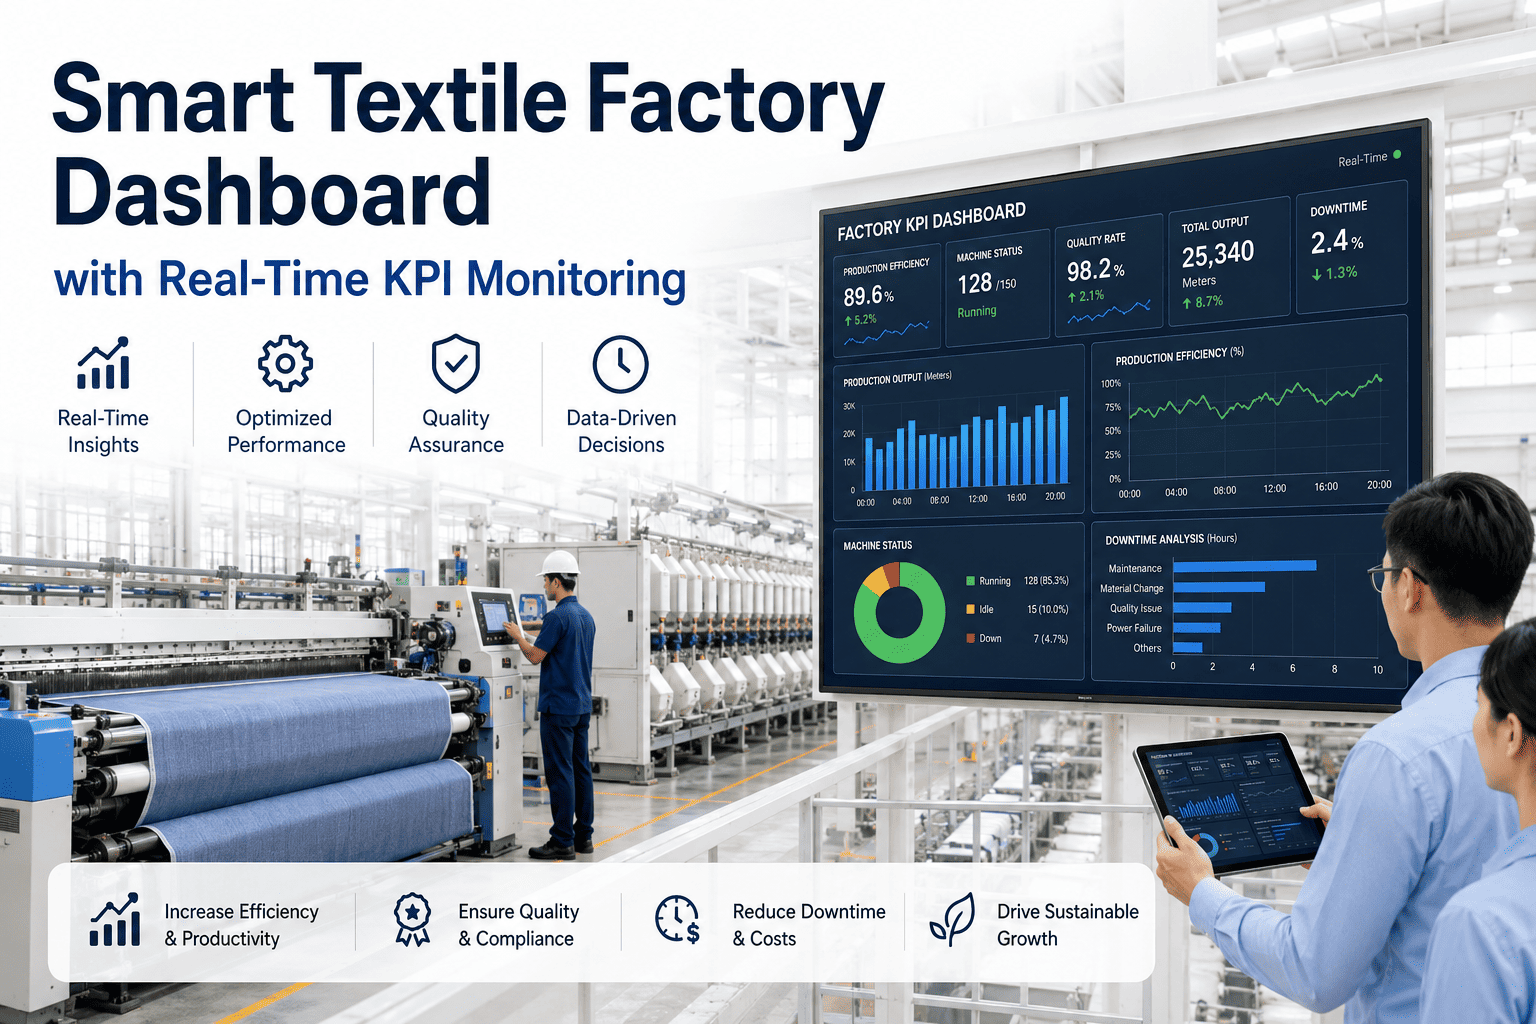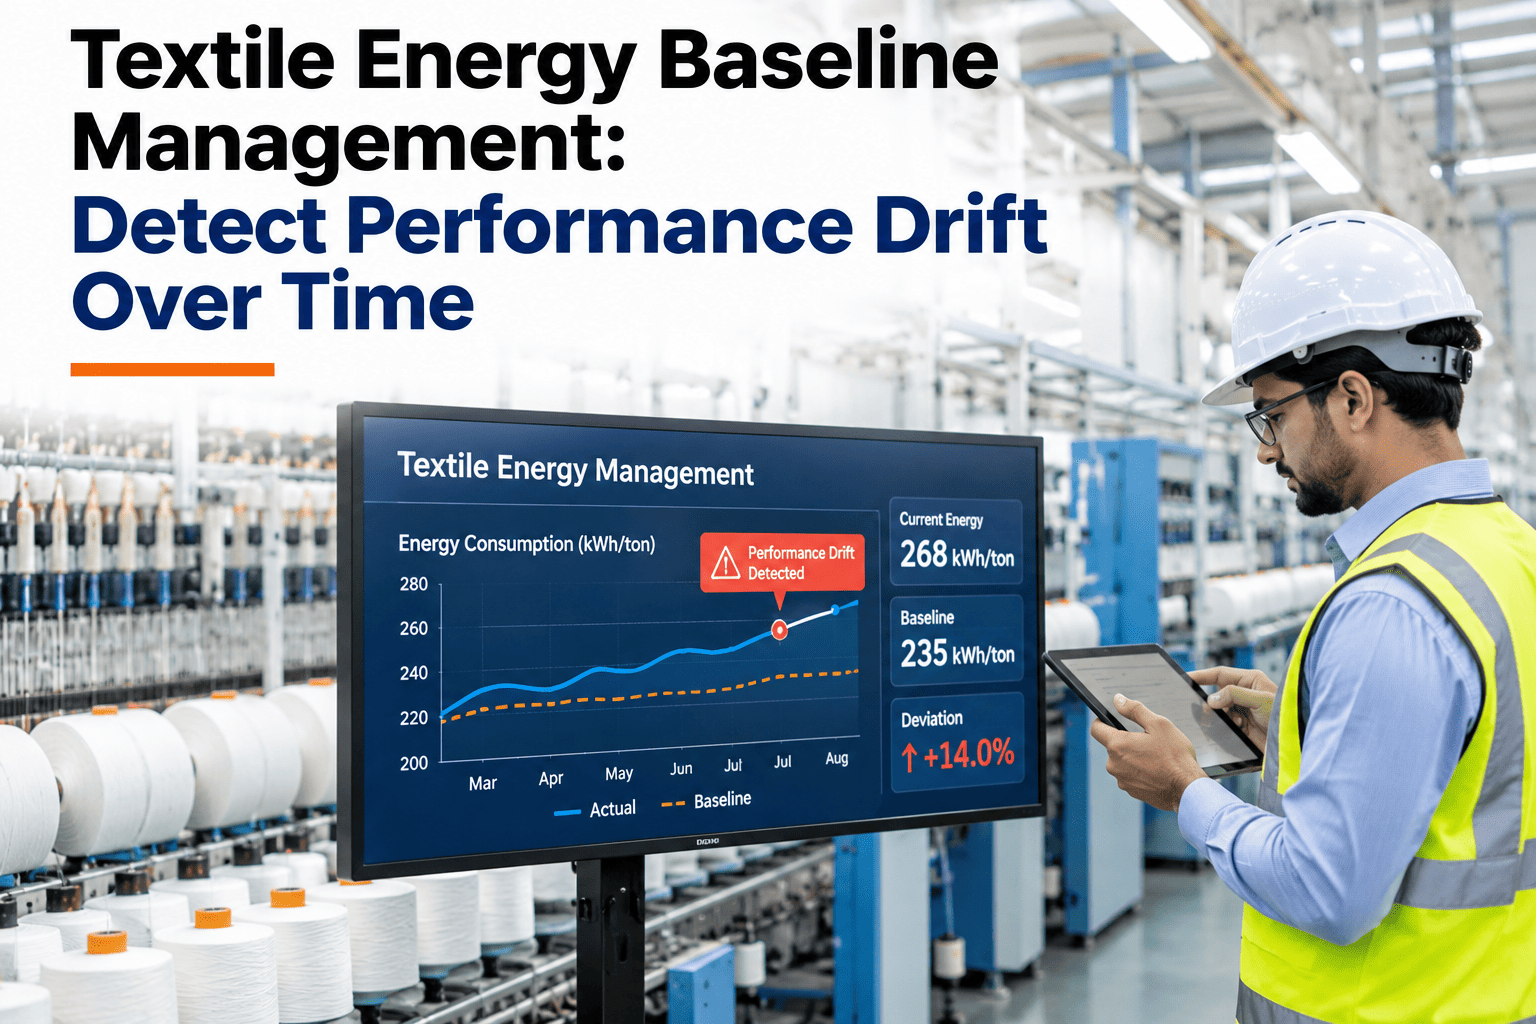
An energy baseline answers a simple question: how much should this process consume, given what it is making today? Without a reliable answer, every efficiency conversation in a textile mill turns into a debate about whether consumption is high because the product mix changed, the machines are degrading, operators are leaving equipment idle, or the process parameters drifted. Each explanation points to a completely different fix. iFactory AI builds per-process, per-product energy baselines from your live sensor and production data so engineers can separate the real signal — a machine consuming 18% more than its baseline — from the noise of a heavier batch mix or a cold morning shift. Teams who want to see how drift detection works on their own mill data can run a baseline gap analysis with our textile energy specialists.
If You Don't Know What Your Process Should Consume, You Can't Know When It's Drifting
iFactory AI creates dynamic energy baselines by process, machine, and product — then tracks drift automatically so you act on real inefficiency, not noise.
What Is an Energy Baseline in Textile Manufacturing?
An energy baseline is a statistically derived model of expected energy consumption for a specific process, machine, or production unit — expressed as kWh per kg, kWh per metre, or GJ per tonne — given the current operating conditions such as product weight, machine speed, and ambient temperature. It is different from a simple average or a budget number. A baseline adjusts for the variables that legitimately change energy consumption so that only genuine inefficiency shows as a gap.
Why Does Energy Performance Drift in Textile Processes?
Drift is the gradual, unnoticed deterioration in energy efficiency over days, weeks, or months. It is distinct from a sudden fault. In textile mills, drift has four main root causes, and each requires a different intervention.
Nearly half of all energy input in an average textile facility is lost to inefficiency, according to a 2026 industry analysis (iFactory Energy). The majority of this loss is not from large, visible faults — it is from accumulated drift that no single meter catches. Teams who want to identify which of these four mechanisms is active on their machines can review a drift classification analysis on their actual meter data.
Know When Your Machines Are Drifting — Before the Energy Bill Arrives
iFactory AI builds per-machine, per-product energy baselines from your live data and flags drift automatically. No spreadsheets, no manual comparison — just a clear signal when performance is falling away from where it should be.
How Are Textile Energy Baselines Built?
A reliable baseline requires three things: sufficient historical data to identify the efficiency envelope, production variables to control for mix effects, and a statistical method that separates normal variation from genuine drift. iFactory AI uses a regression-based approach that takes production rate, fabric weight, ambient conditions, and machine load as inputs — producing an expected kWh/kg or kWh/m value for every operating hour.
| Process | Primary energy form | Baseline metric | Key control variables | Typical drift signal |
|---|---|---|---|---|
| Ring spinning | Electricity | kWh per kg yarn | Count, speed, humidity | +8–15% on worn rings/travellers |
| Exhaust dyeing | Steam + electricity | kg steam per kg fabric | Substrate, liquor ratio, batch size | +10–20% from over-hold or poor insulation |
| Stenter finishing | Thermal (gas/steam) | GJ per tonne | Fabric weight, speed, moisture | +15–25% from fouled air circulation |
| Sizing | Steam + electricity | kWh per kg | Count, sizing recipe, speed | +10% from steam trap failure |
| Weaving (air jet) | Electricity (air compressor) | kWh per metre | Count, density, pick rate | +20–40% from compressed air leaks |
What Does Drift Detection Actually Look Like in a Mill?
In practice, drift detection produces a daily signal for each monitored machine: within baseline, early drift, or significant drift. The signal is calibrated to trigger at a threshold that is large enough to be worth investigating but small enough to catch the drift before it becomes a major cost. For a stenter consuming 500 GJ per month, a 10% drift signal represents roughly 50 GJ of avoidable consumption — a figure that justifies a maintenance check the same day it appears.
Textile Energy Baseline Management vs Utility Metering — Key Differences
Utility metering tells you how much energy your mill used. Baseline management tells you how much of that was necessary, given what you were making. The gap between those two numbers is the efficiency opportunity — and it is invisible without a baseline.
Where iFactory AI Fits in Textile Energy Baseline Management
iFactory AI is an on-premise AI platform for textile manufacturing that runs on NVIDIA GPU servers inside the mill, integrating with existing energy meters, PLC data, and production management systems through OPC-UA, Modbus, and 50+ standard connectors. The energy baseline module builds models by machine and substrate from the first weeks of data and continues updating them as production mix evolves — no annual recalibration exercise required.
Frequently Asked Questions
How much historical data is needed to build a reliable energy baseline?
For most textile processes, four to eight weeks of production data covering the main product variants running on each machine provides enough statistical coverage to build a first working baseline. Processes with high mix variability — like dyeing with many substrates — need more data to capture all operating regimes. iFactory AI starts alerting on outliers from day one using an initialisation model, then refines the baseline as data accumulates. Discuss your process mix and data readiness with our team.
Can a baseline handle different products on the same machine without false alarms?
Yes, provided the baseline model is built with product type or fabric weight as a control variable — which is the standard approach in iFactory AI's energy module. When a heavier fabric moves through the stenter, the expected consumption rises accordingly, and only consumption above that adjusted expectation triggers a drift alert. This is precisely the mechanism that makes baseline management more useful than a simple kWh/kg average. Ask our support team how baseline segmentation works for your product portfolio.
What happens to the baseline when a machine is overhauled or upgraded?
A major maintenance intervention or equipment upgrade should trigger a baseline reset — the new, better-condition machine should establish a lower energy envelope. iFactory AI marks a maintenance event in the data record and begins re-learning the baseline from post-overhaul production data while retaining the pre-overhaul history for comparison. This makes the energy benefit of the maintenance work directly measurable. See how maintenance events are managed in the baseline module.
How is textile energy baseline management different from ISO 50001?
ISO 50001 is a management system standard that requires an organization to establish energy performance indicators and baselines — but it does not specify the technical method. iFactory AI's baseline module provides the technical implementation that satisfies the ISO 50001 EnPI and baseline requirements. The continuous drift monitoring and documented historical records directly support the measurement, analysis, and improvement cycle that ISO 50001 auditors look for. Ask how the baseline module supports your ISO 50001 documentation.
How quickly does a drift alert translate into a maintenance action?
The alert generation is immediate — within the same shift that the drift crosses the threshold. What determines response time is the maintenance workflow. iFactory AI integrates the energy drift alert directly with the CMMS work order module so a maintenance inspection request is created automatically, assigned to the right team, and tracked to completion. The energy KPI on that machine continues to be monitored after the work order is closed to confirm the drift was corrected. See the drift-to-work-order workflow in a 30-minute demo.
Your Machines Are Drifting. The Question Is Whether You're Measuring It.
iFactory AI builds per-process, per-product energy baselines for textile mills and detects drift in real time — so the team acts on data, not gut feel. Book a session to see how your own energy meters can feed a live baseline model.