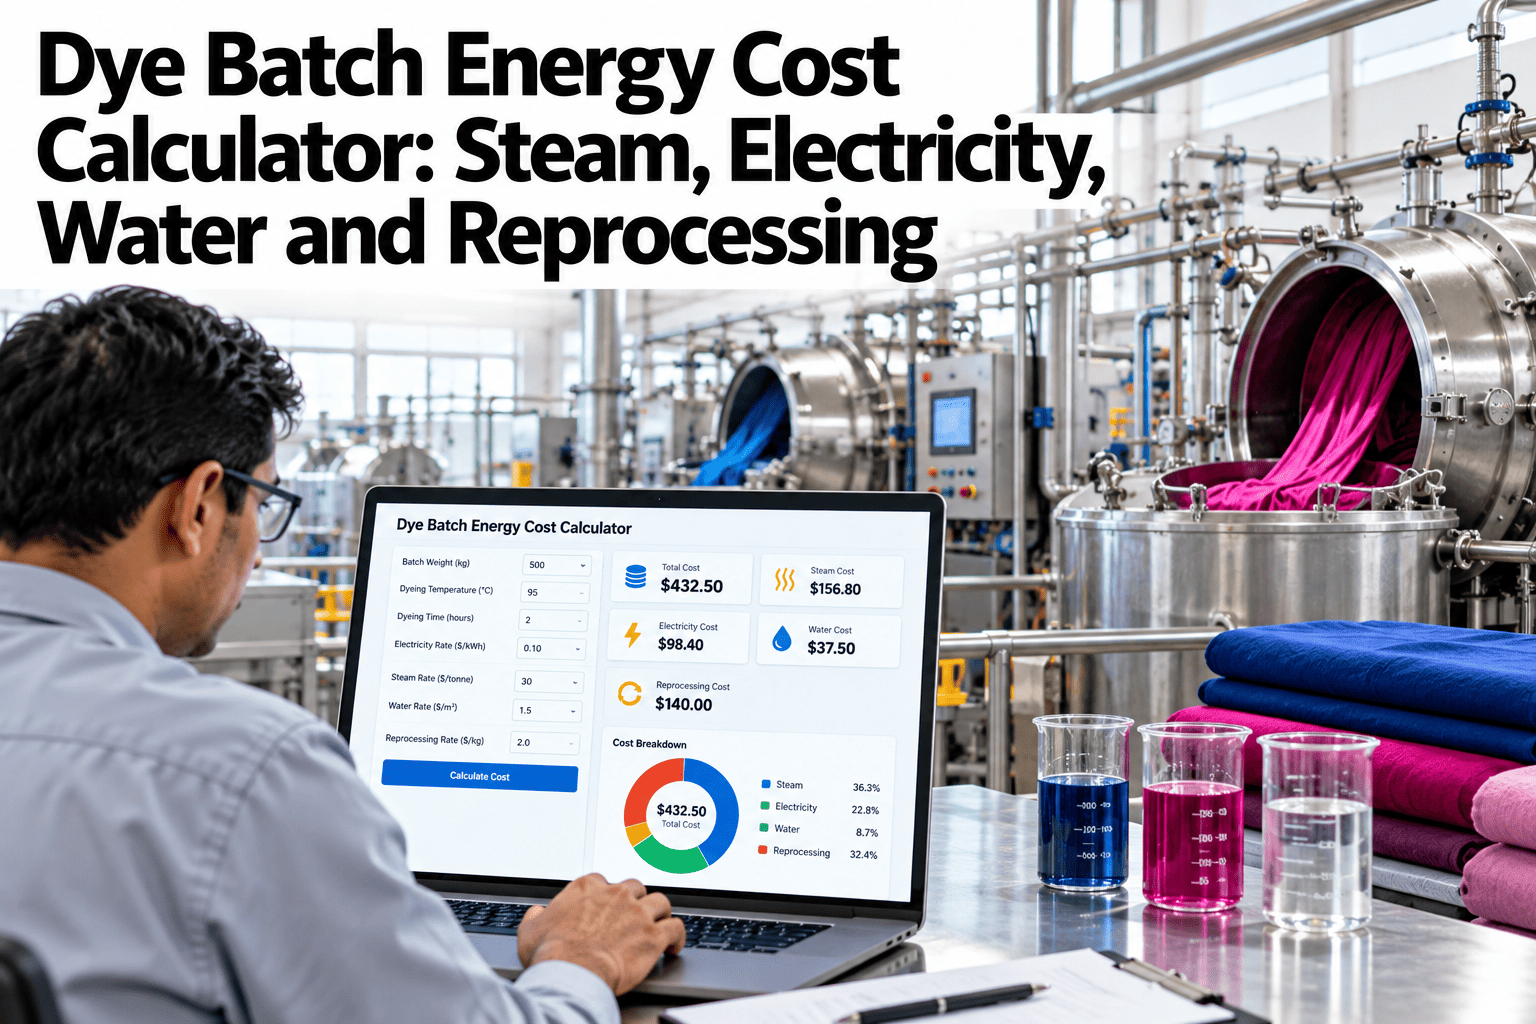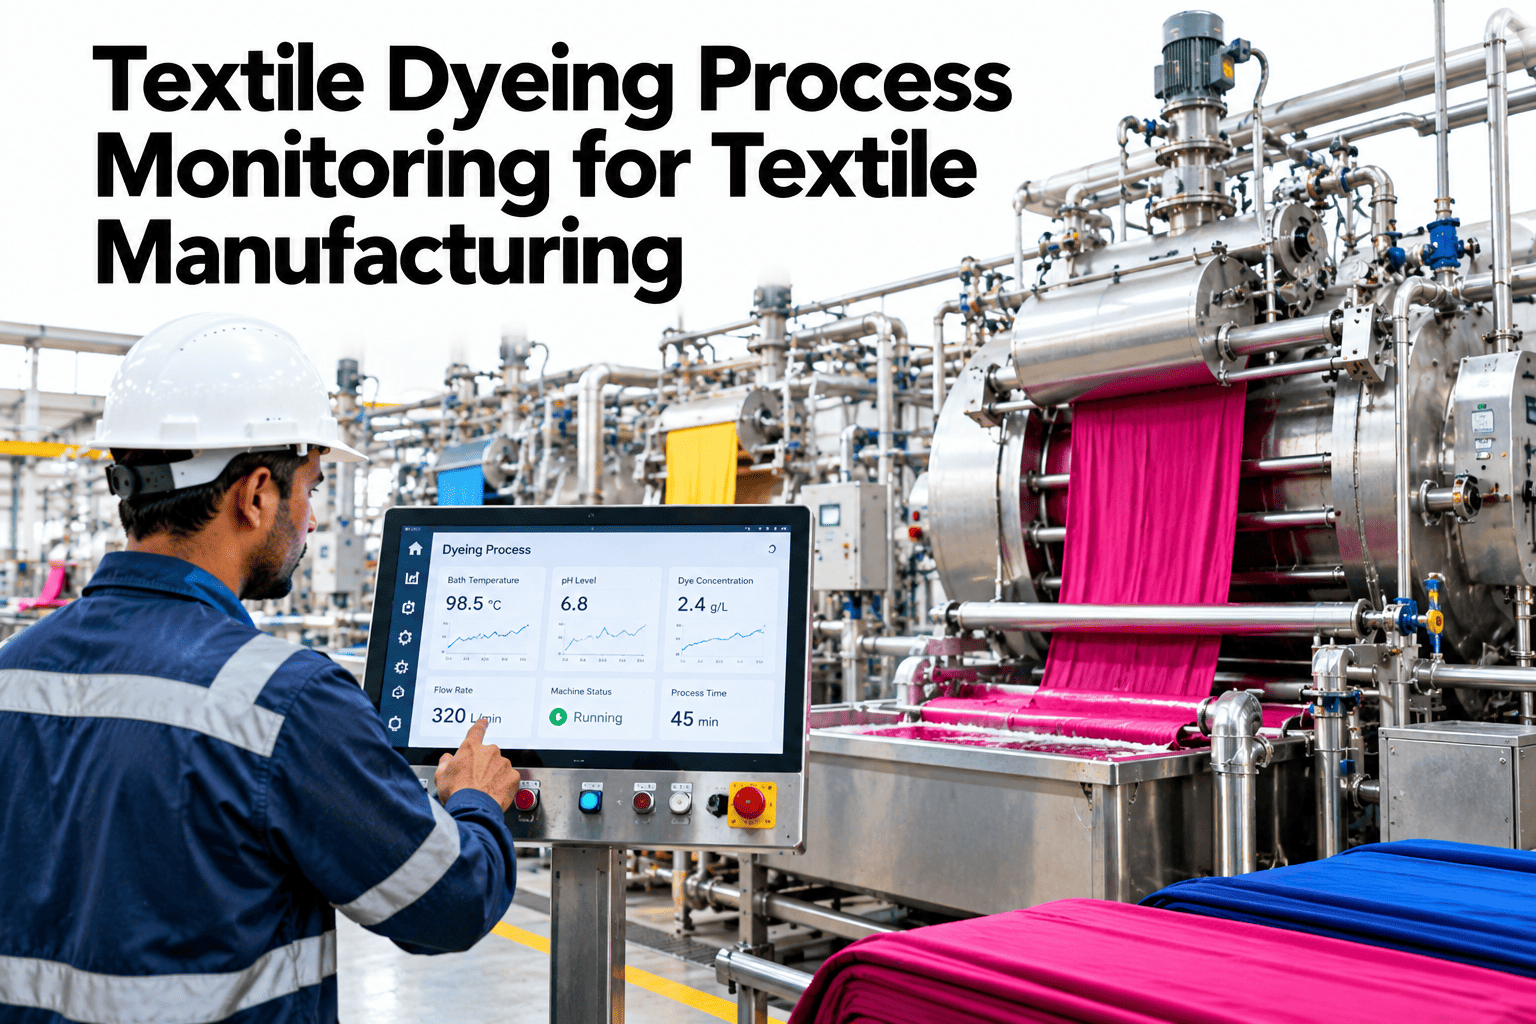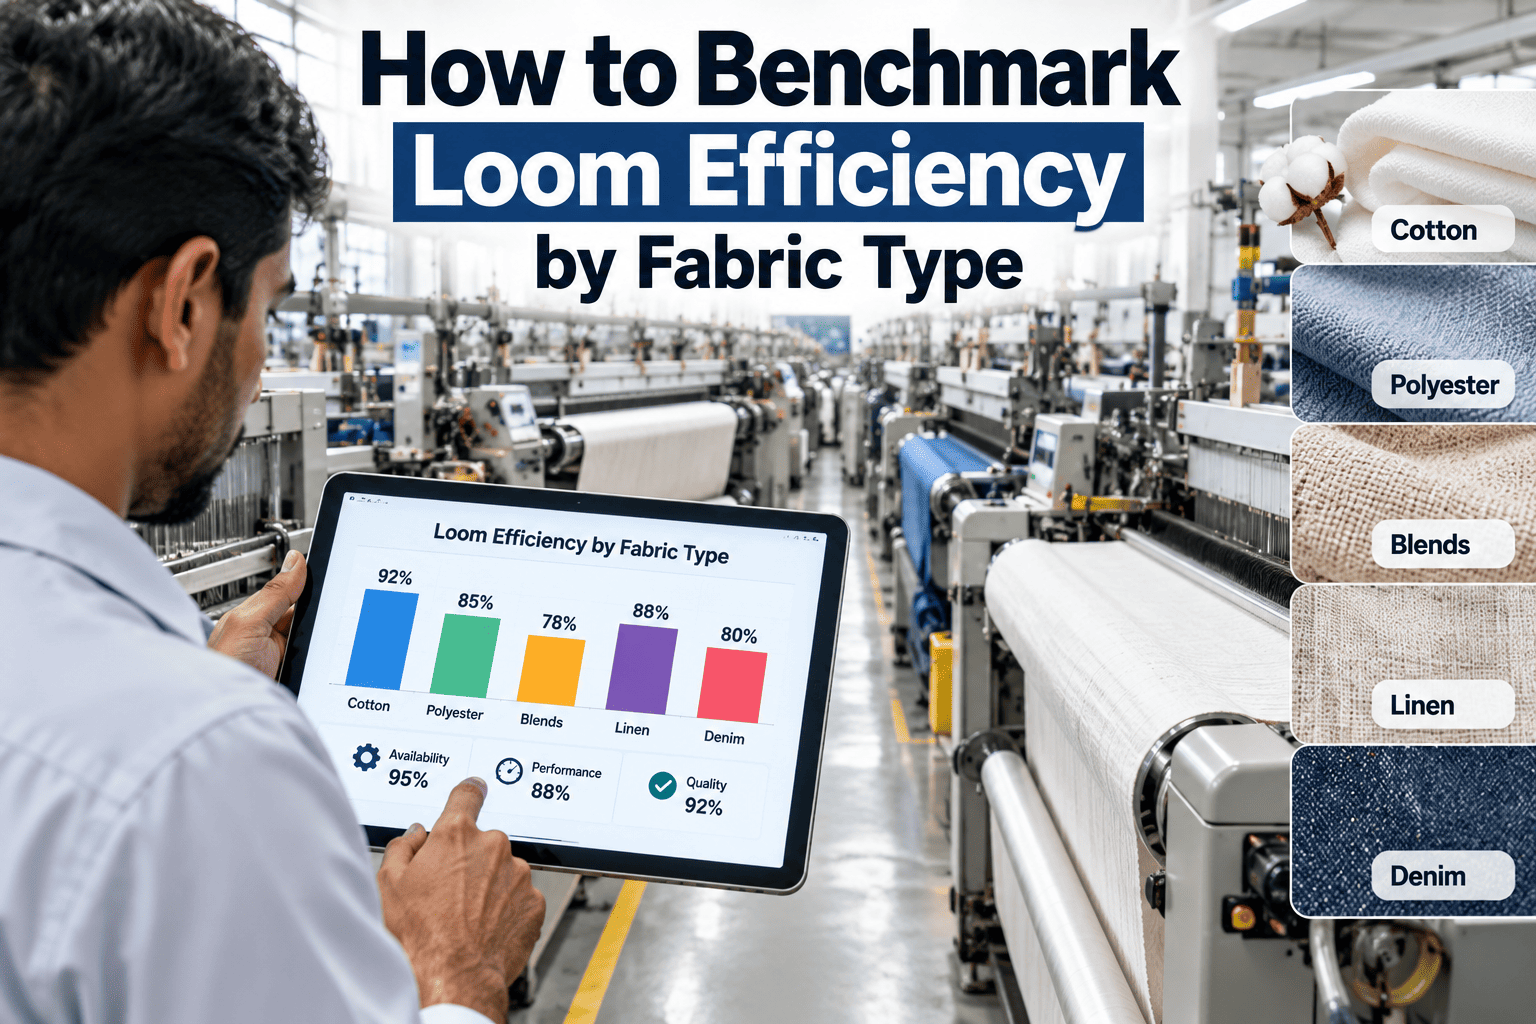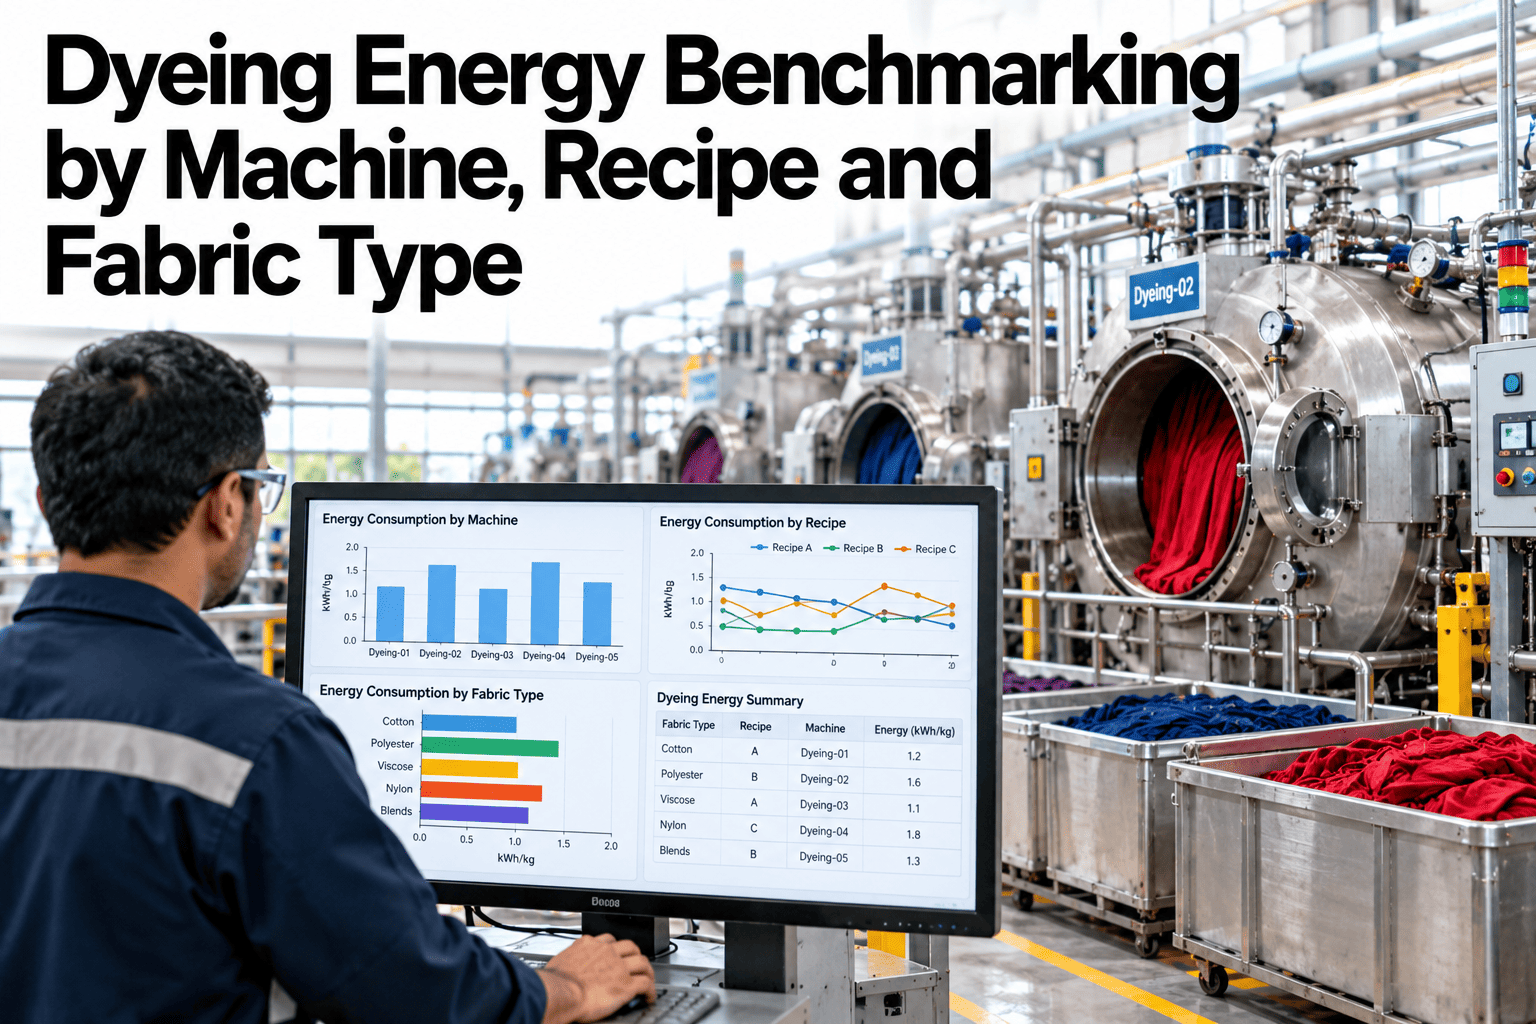
Two dye machines running the same fabric can use noticeably different energy per kilogram, and without benchmarking nobody notices until the utility bill forces the question. A dye house typically has dozens of machine, recipe and fabric combinations running every week, each with its own heating profile and cycle time, but almost none of it gets compared side by side. This guide covers how to benchmark dyeing energy intensity by machine, recipe and fabric type, so the combinations quietly costing the most finally stand out. Dye houses ready to see their own machines benchmarked can book a demo with the iFactory AI team.
Dyeing Energy Benchmarking by Machine, Recipe and Fabric Type
Benchmark energy intensity by machine, recipe, fabric type and batch to find the high-consumption processes hiding in plain sight.
Why Machines That Look Identical Perform Differently
Two machines of the same make and model can still diverge in energy use because of heat exchanger fouling, insulation condition, or a recipe that has drifted from its original design over time.
Without benchmarking, that gap stays invisible, since each machine's energy use is usually reviewed on its own rather than stacked against its peers running the same fabric.
Three Dimensions to Benchmark
Energy intensity varies along three dimensions, and comparing on only one of them hides the real story.
| Dimension | What Varies | Typical Driver |
|---|---|---|
| Machine | Same fabric, different machine, different kWh/kg | Age, insulation, heat recovery |
| Recipe | Same fabric, different dye recipe, different cycle length | Temperature profile, hold times |
| Fabric type | Same machine, different fabric, different energy demand | Liquor ratio, heat-up requirement |
Building the Benchmark
The benchmark is built in a short sequence that joins batch records with meter data, so every batch carries its own energy figure.
Find the Machine Quietly Costing You the Most
Book a 30-minute walkthrough and see your own machines, recipes and fabric types benchmarked side by side.
A Sample Benchmark Finding, Illustrative
The figures below are invented to show the shape of a finding, not to benchmark your dye house.
Common Benchmarking Mistakes
The same mistakes repeat across dye houses building their first benchmark.
Where the Benchmark Gets Used
Once energy intensity is benchmarked, the ranking feeds decisions well beyond the energy team's own reporting.
Production planners route high-volume orders to the most efficient machine for that fabric. Maintenance uses a persistently high-ranking machine as a signal to investigate before a full breakdown occurs.
Frequently Asked Questions
Do we need new meters on every machine?
Not always. Many dye houses already meter steam and electricity at the machine level, and the benchmarking work is mainly in joining that data with batch records rather than adding new hardware. Ask support what your current metering supports.
How often should the benchmark be refreshed?
Monthly is a common cadence, since it is frequent enough to catch drift from fouling or recipe changes while still giving enough batches per combination for a reliable comparison.
Can this account for water heating costs too?
Yes, water heating energy can be included alongside steam and electricity, giving a more complete intensity figure for processes where water heating is a significant cost. Book a demo to see water heating included.
Does this connect to our existing dye house MES?
In most cases, yes. iFactory AI reads batch and recipe data from existing MES systems and joins it with meter data automatically. Ask support which MES platforms connect.
Stop Treating Every Machine as Equally Efficient
iFactory AI benchmarks energy intensity by machine, recipe and fabric to surface your real outliers. Book a walkthrough built around your dye house.