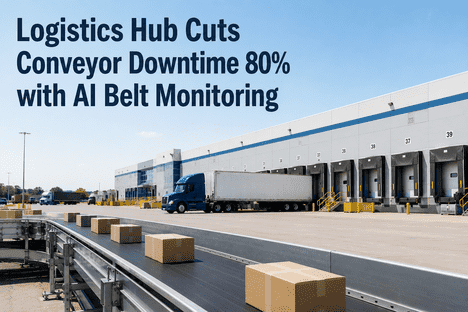
Logistics Hub Cuts Conveyor Downtime 80% with AI Belt Monitoring
By Christopher Hayes on June 18, 2026
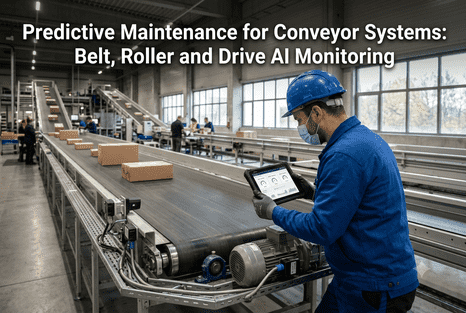
Belt conveyor systems are the circulatory network of modern logistics and distribution — moving parcels, cases, totes, and pallets across sortation loops, merge lanes, induction belts, and shipping spurs that collectively span 4 km or more in a single large hub. A 500,000 sq ft e-commerce distribution center processes 250,000–500,000 units per day across 12–15 km of conveyor, supported by 8,000–12,000 idler rollers, 200+ drive motors, and hundreds of belt splices operating 20–22 hours per day. The failure physics is well documented: belt splice degradation propagates from pinhole initiation to full separation over 200–400 operating hours; idler roller bearing fatigue follows the classic L10 life curve with contamination accelerating failure by 3–5×; drive motor winding degradation from current imbalance develops over weeks before thermal overload protection trips the circuit. Traditional conveyor maintenance relies on daily visual walk-downs, weekly roller temperature checks via infrared gun, and quarterly belt tension inspections — a regimen that samples under 0.01% of the conveyor's operating condition. AI-native conveyor belt monitoring eliminates this gap by ingesting continuous sensor data — belt alignment via laser profiling, roller bearing vibration via accelerometer arrays, motor current via clamp-on CTs, splice health via magnetic flux leakage sensors, and belt tension via strain gauge telemetry — applying machine learning models to detect belt mistracking, idler bearing degradation, splice elongation, and drive system fatigue 14–30 days before functional failure. iFactory AI's industrial software platform, including its Shift Logbook and predictive maintenance engine, enables reliability teams to deploy AI-driven conveyor monitoring without replacing existing CMMS, WMS, or SCADA infrastructure. Book a Demo to see how iFactory applies AI conveyor belt failure prediction across logistics and distribution center fleets. This guide covers conveyor failure mode physics, AI sensor fusion architectures, belt splice and idler bearing degradation mechanisms, and the practical deployment path for distribution center reliability engineers evaluating modernization.
Distribution Centers · Conveyor Belt AI · 2026
Logistics Hub Cuts Conveyor Downtime 80% with AI Belt Monitoring
Continuous belt tracking · idler roller AI prognostics · drive system anomaly detection — reducing unplanned conveyor outages, eliminating emergency sortation stops, and optimizing spare parts inventory across multi-kilometer conveyor networks.
Why Periodic Conveyor Inspection Is Hitting Its Ceiling in Distribution Centers
The traditional approach — daily visual walk-downs, weekly roller temperature checks via infrared gun, monthly belt alignment inspections, quarterly splice measurements, and annual idler replacement campaigns — was designed for smaller sortation systems with lower throughput demands. A modern logistics hub with 4 km of conveyor, 10,000+ idler rollers, and 200 drive motors operating 6,000+ hours per year produces 58 million roller bearing operating hours annually. A maintenance technician walking the system with an IR gun can physically inspect roughly 120 rollers per hour; a full temperature audit of a 10,000-roller system requires 83 technician-hours and is typically completed once per week at best. The four specific ceilings are well documented in conveyor reliability research.
01
Inspection Coverage Gap
Weekly IR temperature checks cover 0.1% of roller operating hours. Idler bearing spalls that initiate and progress to seizure over 50–100 hours are invisible between weekly inspection cycles. A single seized idler can damage 15–20 m of belt before detection.
Gap: Sparse vs Continuous
02
Splice Degradation Blindness
Belt splice condition is assessed via quarterly manual measurement of splice elongation. A mechanical fastener splice loses 60–70% of its tensile strength before elongation exceeds measurable thresholds. Catastrophic splice separation occurs without warning between inspections.
Gap: Periodic vs Real-time
03
Human Detection Variability
Belt mistracking detection relies on operator visual observation of edge fraying or material spillage. Detection accuracy varies from 40% for junior operators to 75% for experienced supervisors. AI vision models detect tracking deviations of 2 mm with 96%+ consistency.
Gap: Subjective vs Automated
04
Reactive Spare Parts Strategy
Without degradation trajectory data, spare belt sections, idler roller assemblies, and drive motors are stocked based on generic OEM recommendations. Actual failure rates vary by 5–8× depending on load profile, contamination, and installation quality.
Gap: Generic stocking vs Data-driven
What AI Conveyor Monitoring Actually Adds to Distribution Center Reliability Programs
The misconception some logistics reliability managers carry: AI conveyor monitoring replaces existing PLC logic, VFD telemetry, or SCADA systems. It doesn't. Your existing control system, motor control center data, and WMS integration remain. What changes is the data ingestion density and the pattern recognition capability. Continuous sensor streams — belt alignment laser profilers, roller accelerometer banks, motor current transducers, magnetic flux leakage splice sensors, and strain gauge belt tension arrays — feed AI models that compute belt tracking deviation trends, idler roller bearing fault frequencies, splice degradation rates, and drive system anomaly scores. The existing CMMS receives higher-quality input — not just "belt system fault" but "belt tracking deviation of 8 mm detected at merge 4-L — 94% confidence — estimated 12 days to edge damage threshold — recommended action: schedule belt re-track during next shift change window." iFactory AI's Shift Logbook provides operators and reliability engineers with a unified interface for conveyor status updates, shift handovers, and AI-generated belt maintenance recommendations integrated with existing CMMS and WMS workflows. Book a Demo to see how iFactory's Shift Logbook unifies conveyor health data with shift operations.
Capability
Periodic Conveyor Inspection
AI Continuous Conveyor Monitoring
Data collection
Weekly visual + IR temperature walk-downs
Continuous 24/7 multi-sensor telemetry ingestion
Belt tracking
Operator visual observation of edge fraying
Laser profiling with 2 mm deviation detection
Roller bearing condition
Quarterly IR temperature + manual rotation check
Accelerometer-based envelope spectrum analysis
Splice integrity
Manual quarterly splice length measurement
Magnetic flux leakage + continuous elongation trend
Conveyor Failure Modes — What AI Detects at Each Stage of Degradation
Conveyor systems fail through well-characterized degradation processes across four primary subsystems, each with distinct sensor signatures. AI models trained on these signatures detect degradation at Stage 1 — the window that separates planned replacement during maintenance windows from catastrophic belt tear, roller seizure, or drive system failure that stops sortation for extended periods. Understanding the detection physics is essential for evaluating conveyor monitoring vendors.
B
Belt Tracking & Edge Wear
Tracking deviation develops from idler misalignment, belt tension imbalance, or structural settlement. Edge fraying progresses at 0.5–3 mm per week depending on belt speed and material. AI laser profiling detects deviation trends from 2 mm, providing 14–21 day lead time before edge damage requires belt section replacement.
Predictive lead time: 14–21 days
R
Idler Roller Bearing Failure
Idler bearing spalls generate vibration signatures at BPFO (outer race), BPFI (inner race), and BSF (rolling element) frequencies. A seized idler generates heat exceeding 80°C within 2–4 hours of lockup, damaging belt bottom cover over 10–20 m. Accelerometer arrays detect bearing degradation 14–30 days before seizure.
Predictive lead time: 14–30 days
S
Splice & Belt Joint Degradation
Mechanical fastener splices fail through sequential fastener pullout — each rivet carries load until fatigue fracture transfers load to adjacent fasteners. Magnetic flux leakage sensors detect ferrous fastener fatigue crack initiation. Vulcanized splices develop edge separation at 1–2 mm per week before catastrophic failure.
Predictive lead time: 10–20 days
D
Drive Motor & Gearbox Faults
Motor winding degradation from current imbalance develops over 4–8 weeks before thermal overload protection trips. Gearbox bearing faults propagate through vibration signature changes. VFD harmonics analysis detects electrical anomalies before mechanical failure. Current signature + vibration fusion provides 14–21 day lead time.
Predictive lead time: 14–21 days
The Keep / Retire / Transform / Replace Decision Matrix
Migration discipline starts here. Every conveyor reliability artifact in your current operation falls into one of four categories. Getting the categorization right in the first phase saves months of debate and pilot purgatory later.
Keep
Core conveyor reliability foundations
CMMS work order engine
WMS & SCADA control systems
VFD & motor control center data
ERP financial & procurement integration
Belt supplier catalogs & splice specs
Established capabilities with no business case to replace. AI conveyor monitoring writes recommendations into these systems through standard API integration.
Retire
Legacy inspection layers
Weekly IR temperature walk-downs
Paper-based conveyor inspection logs
Manual quarterly splice measurements
Whiteboard shift handover sheets
Email-based alarm notifications
Replaced by continuous sensor telemetry ingestion and AI-driven fault classification. 80–90% reduction in manual inspection effort across the conveyor network.
Transform
Conveyor analysis workflows
Conveyor health scoring & ranking
Belt tracking deviation trending
Roller bearing severity progression tracking
Splice degradation rate dashboards
Shift handover for conveyor status
Become AI model invocations grounded in continuous multi-sensor data. Intelligence upgraded via iFactory Shift Logbook and predictive maintenance engine.
Replace
Alert & notification layer
Legacy alarm threshold gateways
Manual escalation workflows
Email-based conveyor alerts
Paper-based conveyor shift logs
Standalone belt inspection reports
Event-driven AI alert engine replaces manual notification. Faster, context-aware, with automated work order creation in CMMS.
Want this matrix applied to your specific conveyor network layout in a working session? Book a Demo to walk through every conveyor segment and prioritize your AI monitoring rollout across the distribution center.
Three Deployment Paths for Conveyor AI Monitoring
Same starting point, three valid destinations. The right path depends on conveyor network size, sortation criticality, current sensor coverage, and data infrastructure maturity. Distribution centers that pick the wrong path spend 6–12 months in pilot purgatory. Centers that pick the right path deploy in 6–10 weeks.
Path A
Augment in Place
6–8 weeks
AI conveyor monitoring runs alongside existing inspection programs. Shadow mode for 4 weeks across 2–3 critical conveyor segments. Alerts flow to CMMS for review. No existing processes retired in this phase. Best for first deployment in conveyor belt condition monitoring.
Best fit
Critical sortation loops · risk-averse reliability teams · first AI deployment in conveyor belt monitoring
Wk 1–2 Sensor deployment on 2 critical segments
Wk 3–5 Shadow mode AI fault classification
Wk 6–8 CMMS integration & operator training
Path B
Hybrid Migration
8–12 weeks
AI conveyor monitoring covers all mainline and sortation loops. Weekly IR walk-downs retired. CMMS, WMS, and SCADA systems preserved. Roller bearing sparing logic integrated with inventory system. 80% reduction in manual inspection effort.
Best fit
Mature reliability programs · moderate budget authority · sponsorship for digital transformation
Wk 1–3 Full conveyor segment audit + matrix
Wk 4–8 Deploy AI monitoring across all segments
Wk 9–12 Mobile UX migration · paper log retirement
Path C
Full Modernization
10–14 weeks
All conveyor segments under AI-native continuous monitoring. Paper-based inspection retired entirely. iFactory platform provides full conveyor health dashboard, automated CMMS work orders, Shift Logbook integration, and AI-driven spare parts optimization across belt, roller, and drive categories.
Best fit
Large distribution centers (500K+ sq ft) · 4+ km conveyor · siloed legacy inspection systems · strategic platform consolidation goal
Wk 1–4 Full conveyor inventory + sensor audit
Wk 5–10 Parallel build + operator training
Wk 11–14 Cutover + legacy inspection sunset
Pick the Right Path for Your Distribution Center in a 90-Minute Workshop
iFactory AI's conveyor reliability practice runs a focused workshop against your specific conveyor network layout, existing sensor coverage, CMMS configuration, and spare parts strategy. You leave with a defended path recommendation, a 10-week deployment plan, and a cost reduction projection grounded in your conveyor failure history.
Generic vibration monitoring vendors handle the sensor hardware. Conveyor-aware vendors handle the integration reality — belt tracking laser profiling, roller bearing envelope spectrum band auto-configuration per bearing geometry, splice degradation magnetic flux analysis, current signature motor fault detection, CMMS-native work order generation, and zero-disruption deployment across operating sortation systems. Seven criteria separate vendors who've done conveyor fleet modernizations from vendors selling a demo.
01
Multi-sensor fusion architecture
Ask:
"Does your platform fuse belt tracking lasers, roller accelerometers, motor current CTs, and splice magnetic flux sensors into a single conveyor health model?"
Conveyor health requires fusion of four sensor modalities. Standalone vibration monitoring misses belt tracking deviation. Standalone laser profiling misses bearing degradation. Platforms must ingest and correlate all four signal types per conveyor segment.
02
Roller bearing auto-configuration
Ask:
"Does your platform automatically calculate bearing fault frequencies from roller part numbers and belt speed across 10,000+ idlers?"
Each idler roller bearing geometry generates unique BPFO, BPFI, and BSF frequencies. Platforms must auto-calculate all fault frequency bands from bearing catalogs without manual configuration per roller, at logistics hub scale.
03
Belt splice degradation modeling
Ask:
"Does your platform model mechanical fastener and vulcanized splice degradation rates from magnetic flux leakage and elongation sensor data?"
Splice failure is the highest-consequence conveyor failure mode. Magnetic flux leakage sensors detect ferrous fastener fatigue crack initiation. Elongation sensors track vulcanized joint separation. Models must classify splice type and predict remaining life accordingly.
04
Load-condition normalization
Ask:
"Does your AI model normalize belt tracking deviation and roller vibration amplitudes across varying throughput rates and product mix?"
A distribution center's conveyor operates at 40–100% throughput depending on shift and season. Belt tracking deviation and roller vibration scale with load. Models must separate load-induced changes from actual fault progression to avoid false alarms during peak season.
05
Drive motor current signature analysis
Ask:
"Does your platform perform continuous motor current signature analysis for belt slip detection, VFD harmonics anomalies, and winding degradation?"
Motor current signature analysis detects belt slip (current drop + VFD speed increase), winding turn-to-turn faults (negative sequence current), and gearbox bearing defects (torque oscillation at fault frequencies). Each requires specific signal processing algorithms.
06
CMMS-native work order with sensor evidence
Ask:
"Does your platform generate CMMS work orders with conveyor segment ID, fault type, severity stage, sensor evidence attachments, and recommended spare part number?"
AI predictions without actionable, specific work orders create process friction. Work orders must include the specific conveyor segment, belt section, or roller bank, with sensor trend charts and failure mode classification attached.
07
Deployment timeline commitment
Ask:
"When does the first AI-classified conveyor fault alert reach our CMMS in production across the entire sortation system?"
6–12 weeks is the production-grade benchmark for hybrid migration in logistics hubs. Path A is 6–8 weeks for critical segments. Path C is 10–14 weeks for full coverage. Vendors quoting 6+ months are building custom development.
Want to score your shortlisted conveyor monitoring vendors against this 7-criterion framework? Run a vendor evaluation working session with our team. Book a Demo and get a structured scorecard applied against your distribution center conveyor requirements.
The ROI Math — What AI Conveyor Monitoring Delivers for Distribution Center Reliability
The business case for AI-native conveyor belt monitoring isn't about software cost — it's about cost avoidance on catastrophic belt tears that destroy 50–100 m of belting, idler roller seizures that damage belt bottom covers across entire conveyor sections, and drive system failures that stop sortation for 4–8 hours during peak operations. Logistics hubs moving from periodic inspection to AI continuous monitoring see measurable improvements across four metrics in the first quarter post-deployment.
−70–80%
Unplanned conveyor stops
AI identifies belt tracking deviation, roller bearing faults, and splice degradation 14–30 days before functional failure. Emergency sortation stops shift to planned maintenance during shift change windows with pre-positioned spare rollers and belt sections.
−30–50%
Total conveyor maintenance cost
Condition-based roller replacement eliminates premature idler change-outs while catching bearing faults before roller seizure damages 15–20 m of belt bottom cover that requires section replacement at 5–10× the cost of a single roller.
+40–60%
Belt & roller service life
Timely tracking correction, seized roller replacement, and splice monitoring based on actual degradation data extends belt replacement intervals by 6–12 months and roller service life by 12–18 months across the conveyor network.
3–6 mo
Typical ROI payback
Full investment recovery through unplanned outage reduction, belt damage elimination, maintenance cost optimization, and extended conveyor component life across a 4 km distribution center network.
Expert Perspective
"The single biggest mistake logistics reliability managers make in conveyor condition monitoring modernization is treating it as a sensor installation project. It isn't. Your existing PLC logic, VFD telemetry, and SCADA system work as designed — there's no business case to replace them wholesale. What needs to change is the inspection data ingestion density and the multi-sensor fusion analysis layer. Weekly visual walk-downs and IR temperature checks that sample a fraction of a percent of conveyor operating hours need to migrate to continuous multi-sensor telemetry feeding AI models that fuse belt tracking laser data, roller accelerometer spectra, motor current signatures, and splice magnetic flux readings into a unified conveyor health assessment. The architectural decision isn't sensors-or-AI — it's sensors-plus-AI-plus-fusion-plus-conveyor-segment-health-models. Distribution centers that frame it correctly deploy in 8–12 weeks. Centers that frame it as rip-and-replace spend 6–12 months in pilot purgatory."
— Conveyor Reliability Practice, 2026 industry insight
8–12 wk
hybrid deployment across a 4 km conveyor network
80–90%
reduction in manual conveyor inspection effort
Zero rip
of existing CMMS, WMS, or SCADA required
Conclusion: The Modernization Decision Has Three Right Answers
Weekly visual walk-downs and IR temperature checks aren't failing in distribution center conveyor reliability programs — they're hitting an inspection sampling ceiling that human-dependent data collection can't cross. AI-native continuous conveyor monitoring adds the multi-sensor fusion fault classification and degradation trajectory-based prognostics layer that traditional methods were never designed to deliver: 24/7 laser belt tracking profiling, accelerometer-based roller bearing envelope spectrum analysis, magnetic flux leakage splice integrity monitoring, motor current signature drive system analysis, and mobile-native operator interfaces grounded in real-time conveyor health data. The modernization conversation has three valid answers depending on conveyor network size, sortation criticality, and existing sensor coverage — augment in place (6–8 weeks), hybrid migration (8–12 weeks), or full modernization (10–14 weeks). All three keep existing CMMS, WMS, and SCADA systems intact and can integrate with current PLC and VFD infrastructure. All three deliver 70–80% reduction in unplanned conveyor stops within the first quarter. The decision worth making in 2026 isn't whether to modernize conveyor condition monitoring — it's which of the three paths fits your specific distribution center conveyor network context. Walk through your specific conveyor segments and monitoring requirements with our team. Book a Demo for a working session on your conveyor network.
Run the AI Conveyor Monitoring Workshop Built for Your Distribution Center
iFactory AI's conveyor reliability practice runs a 90-minute workshop against your real conveyor network layout, existing sensor coverage, CMMS configuration, and spare parts strategy. You leave with a defended path recommendation, the matrix applied to your conveyor segments, and a cost reduction projection grounded in your failure history.
Does AI conveyor monitoring replace our existing inspection program?
No. Your existing visual walk-downs, PLC telemetry, and SCADA system continue providing their respective value — these are established capabilities. What changes is the data ingestion density and pattern recognition layer: continuous multi-sensor data now feeds AI models that fuse belt tracking, roller bearing, splice, and motor current signals, in addition to the periodic inspections your team already conducts. The AI prediction layer sits on top of existing data streams through standard API integration with CMMS and WMS systems.
What conveyor failure modes can AI actually predict?
Production-grade AI conveyor monitoring covers all four primary failure categories: belt tracking deviation and edge wear (laser profiling detects 2 mm deviations 14–21 days before edge damage threshold), idler roller bearing degradation (accelerometer-based envelope spectrum analysis catches BPFO/BPFI/BSF fault frequencies 14–30 days before seizure), splice mechanical fastener and vulcanized joint failure (magnetic flux leakage + elongation sensors detect degradation 10–20 days before separation), and drive motor winding and gearbox faults (current signature + vibration fusion identifies anomalies 14–21 days before thermal overload or mechanical failure). Each fault type is classified, severity-trended, and reported with remaining useful life estimates.
Does deployment require new sensors across the entire conveyor network?
Not necessarily. Production-grade AI platforms integrate with existing VFD telemetry, PLC data streams, and motor control center current signals already available in most modern distribution centers. For conveyor segments without existing sensors, wireless laser profilers, MEMS accelerometer banks, and clamp-on current transducers can be installed during scheduled maintenance windows without stopping sortation operations. A 4 km conveyor network typically requires 80–120 sensor nodes for complete coverage — far fewer than the 10,000+ idler rollers it monitors.
How does remaining useful life prediction work for conveyor components?
Each conveyor subsystem feeds dedicated AI models trained on run-to-failure data from logistics operations. Belt tracking deviation follows linear progression from initiation to edge damage threshold; the model projects time-to-threshold from the current deviation trend and belt speed. Roller bearing degradation follows exponential progression after spall initiation; the RUL model fits an exponential curve to the envelope spectrum amplitude trajectory and projects time-to-seizure. Splice degradation rates are modeled as Weibull distributions from magnetic flux leakage trend data. Confidence intervals narrow as degradation progresses through later stages, enabling increasingly precise maintenance scheduling.
Which deployment path fits a high-throughput distribution center best?
Path A (Augment in Place) is the right starting point for distribution centers where unplanned conveyor stops on mainline sortation loops carry severe throughput and SLA penalty consequences. The platform runs alongside existing inspection programs for 4 weeks in shadow mode across 2–3 critical conveyor segments, generating belt tracking, roller bearing, splice, and drive system fault classifications logged for review but not triggering work orders. Reliability teams compare AI predictions against actual findings before approving cutover with full traceability. After 6–12 months, most high-throughput centers progress to Path B or C to capture additional efficiency benefits across the full conveyor network.