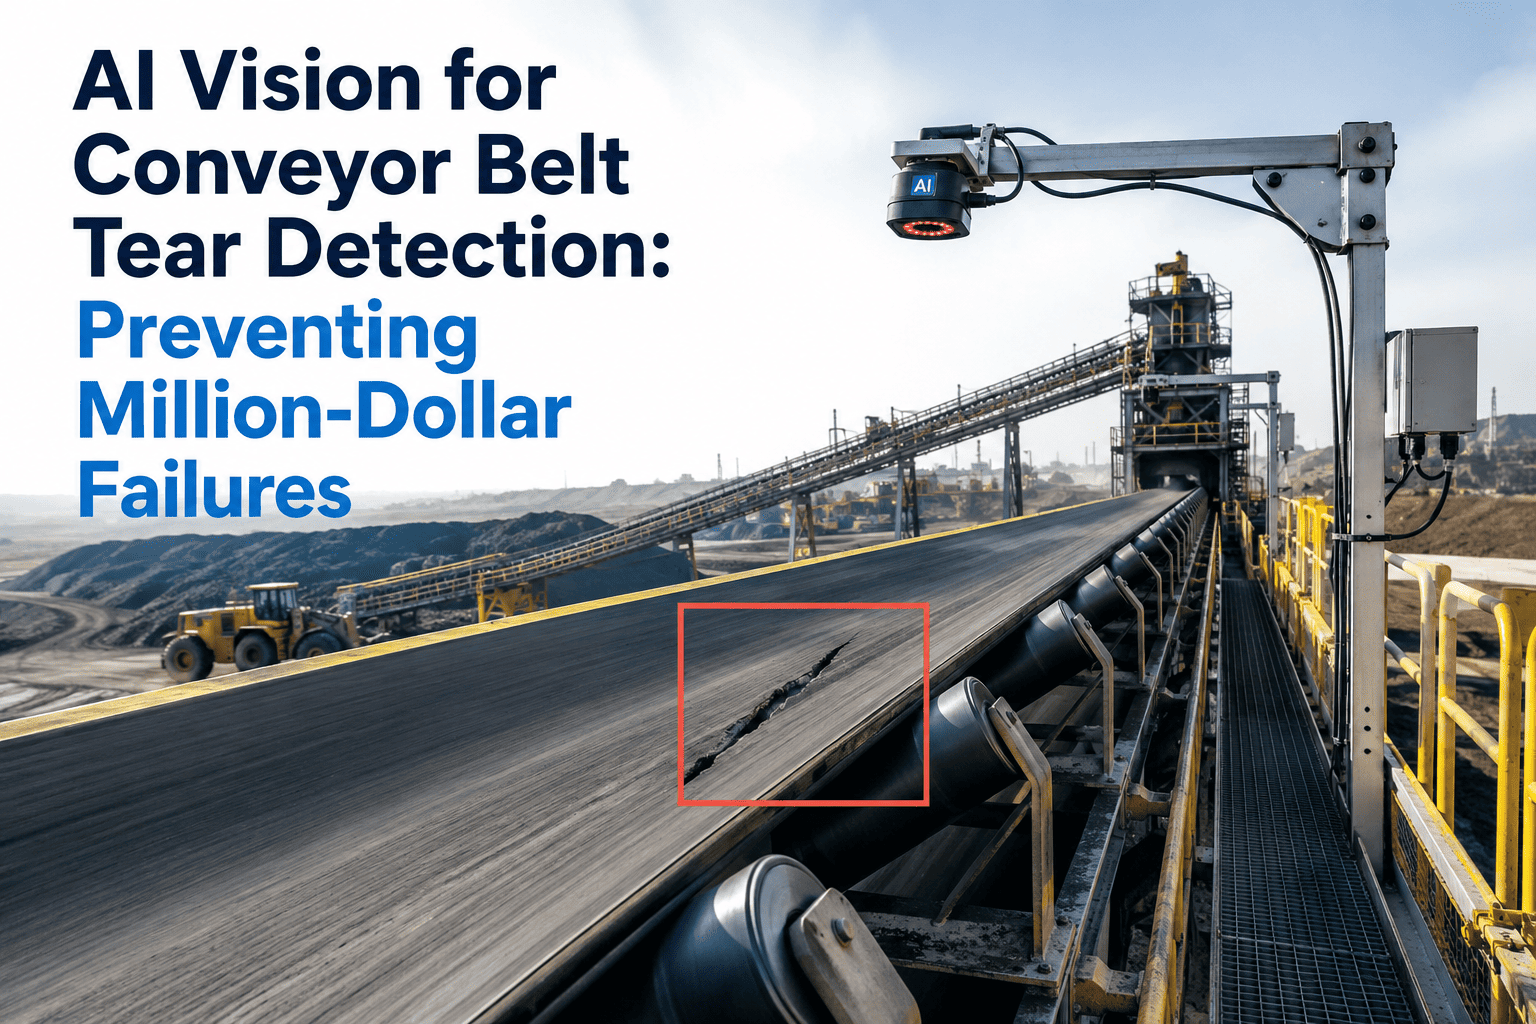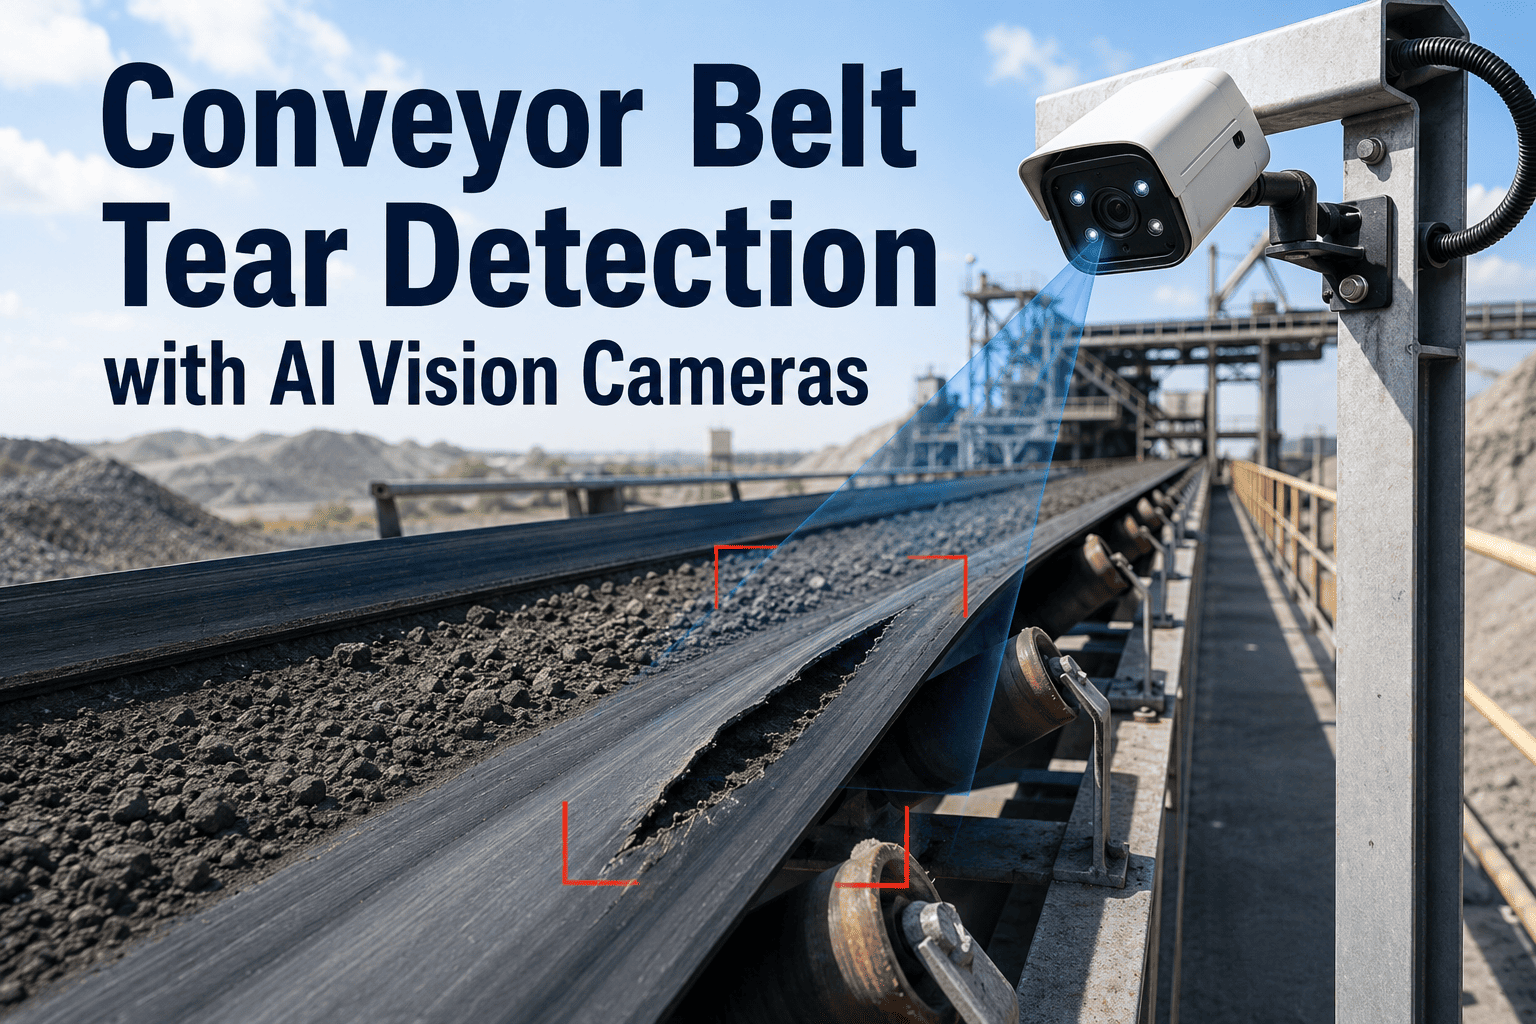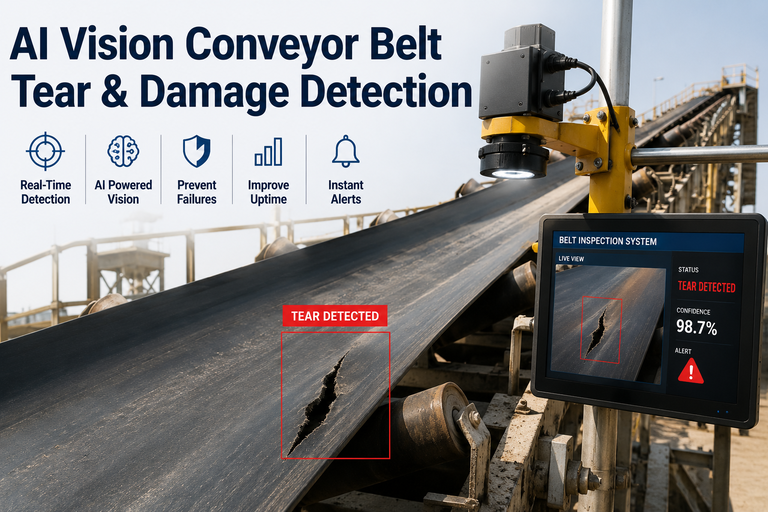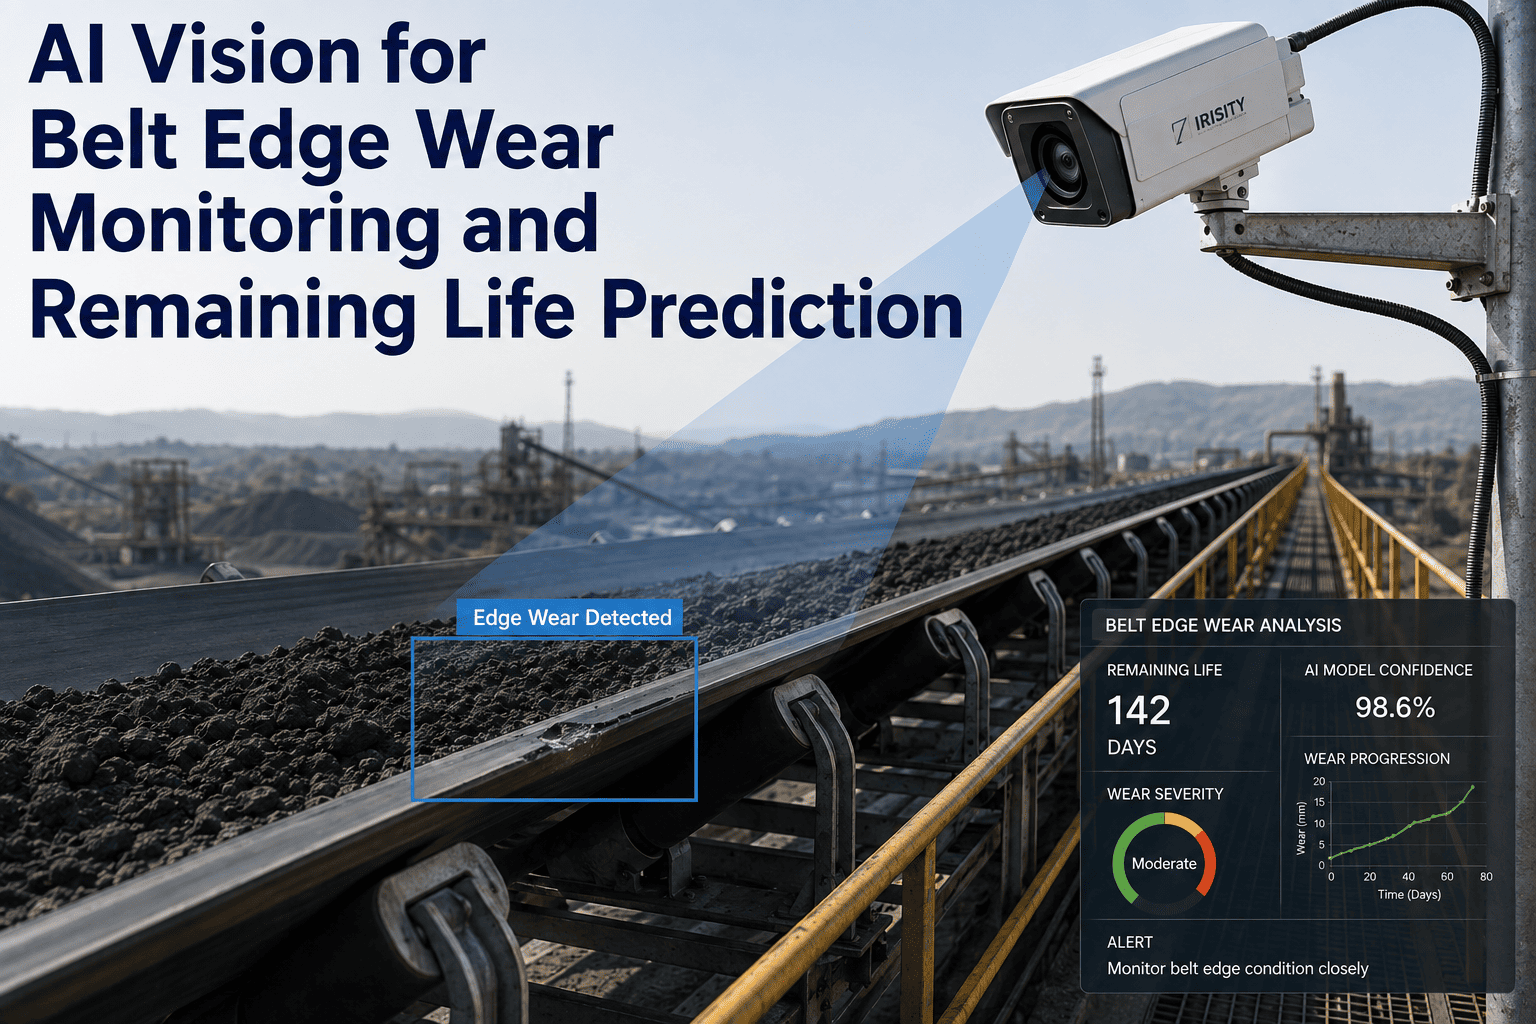
Conveyor belts rarely fail without warning, but the warning signs, fraying edges, thinning cover, exposed fabric ply, tend to develop gradually across months and get missed between the periodic manual checks most plants rely on. By the time belt wear is bad enough to notice on a routine walk, the replacement decision is usually reactive rather than planned, forcing an emergency shutdown instead of a scheduled swap during an already-planned outage. AI vision tracks belt edge and surface condition on every pass, building a wear trend that turns belt replacement into a scheduling decision rather than an emergency, and our conveyor monitoring specialists can show you what that trend line looks like on a comparable belt.
Know Your Belt's Remaining Life Before It Runs Out
A conveyor belt degrades in a fairly predictable pattern once wear begins, and that pattern is visible in edge fraying, surface thinning, and cover damage well before the belt reaches a condition that forces an unplanned stop. AI vision tracks that pattern continuously and turns it into a remaining-life estimate maintenance teams can actually plan around.
Why Belt Replacement Is Usually a Surprise
Belt wear happens unevenly across the width and length of a conveyor, with edges typically wearing faster than the belt center due to tracking friction against idler flanges and skirt boards at transfer points. A manual visual check, even a thorough one, captures a single snapshot of belt condition and depends heavily on which section of the belt happens to be visible when the inspector walks by, since a long belt loop means most of its length is out of view at any given moment. Wear that is progressing steadily on a section of belt that only becomes visible once every few loop cycles can advance considerably between the inspections that actually catch it.
The Wear Progression a Model Learns to Track
Turning Wear Stage Into a Remaining-Life Estimate
| Input Tracked | What It Reveals | Contribution to Life Estimate |
|---|---|---|
| Edge fraying extent and rate of spread | How quickly the belt is wearing at its most vulnerable zone | Primary driver of near-term replacement urgency |
| Cover thickness trend across surface | Overall structural margin remaining across the belt | Sets the outer bound on total remaining service life |
| Fabric ply visibility, if any | Whether structural reinforcement is already compromised | Escalates the estimate toward near-term mandatory replacement |
| Historical wear rate for this specific belt | How this belt's degradation compares to its own past trend | Refines the projection instead of relying on a generic average |
The comparison against a belt's own historical wear rate is what separates a useful remaining-life estimate from a generic industry average. Belts on different routes wear at different rates depending on material handled, incline, transfer point design, and tensioning, so a model trained against that specific belt's own trend produces a far more actionable number than a blanket "replace every so many months" schedule applied uniformly across a whole plant.
Planned Replacement Versus Emergency Replacement
What Drives Uneven Wear Across a Single Belt
Two belts installed on the same day, running the same material, at the same plant can still wear at noticeably different rates depending on factors specific to their individual route. Skirt board seal condition at transfer points has an outsized effect on edge wear, since a worn seal allows material to grind directly against the belt edge rather than staying contained within the intended flow path. Idler alignment plays a similarly large role, since a belt that tracks slightly off-center wears unevenly against fixed structure on one side far faster than a properly tracked belt would. Even material characteristics matter beyond simple abrasiveness, since wet, sticky material tends to load unevenly across the belt width in a way that dry, free-flowing material does not, concentrating wear in different zones depending on where that unevenness settles during loading.
Because these route-specific factors vary so much, a wear model trained against a specific belt's own observed history captures this individual variation in a way that a generic industry lifespan table cannot. This is also why two visually similar belts on different routes within the same plant can have meaningfully different remaining-life estimates even at the same age and load profile, and why maintenance teams that rely purely on a fixed replacement interval often end up either replacing some belts too early or, more riskily, running others well past the point where wear has become a genuine structural concern.
Planning a Belt Monitoring Rollout Across Multiple Routes
Most plants run more belts than can realistically be instrumented all at once, which makes prioritization an important part of any rollout plan. Belts with the highest replacement cost, the longest lead time for a replacement order, or the most disruptive impact on production if they fail unexpectedly tend to be the most valuable starting point, since these are the belts where converting an emergency replacement into a planned one saves the most in both direct cost and operational disruption. A belt on a short, easily accessible section with a replacement already sitting in inventory carries far less urgency for monitoring than a long-lead-time belt on a critical path route where an unplanned failure would stop an entire process line.
Once a rollout covers the highest-priority routes, expanding to the remainder of a plant's belt inventory becomes a matter of ongoing budget cycles rather than an urgent initial decision, since the belts left for a later phase are, by definition, the ones where an unplanned failure carries the least operational consequence.
Frequently Asked Questions
Turn Belt Replacement Into a Planned Decision
Share your current belt age and last known wear condition. We'll show you what a tracked remaining-life estimate would look like for your specific route.