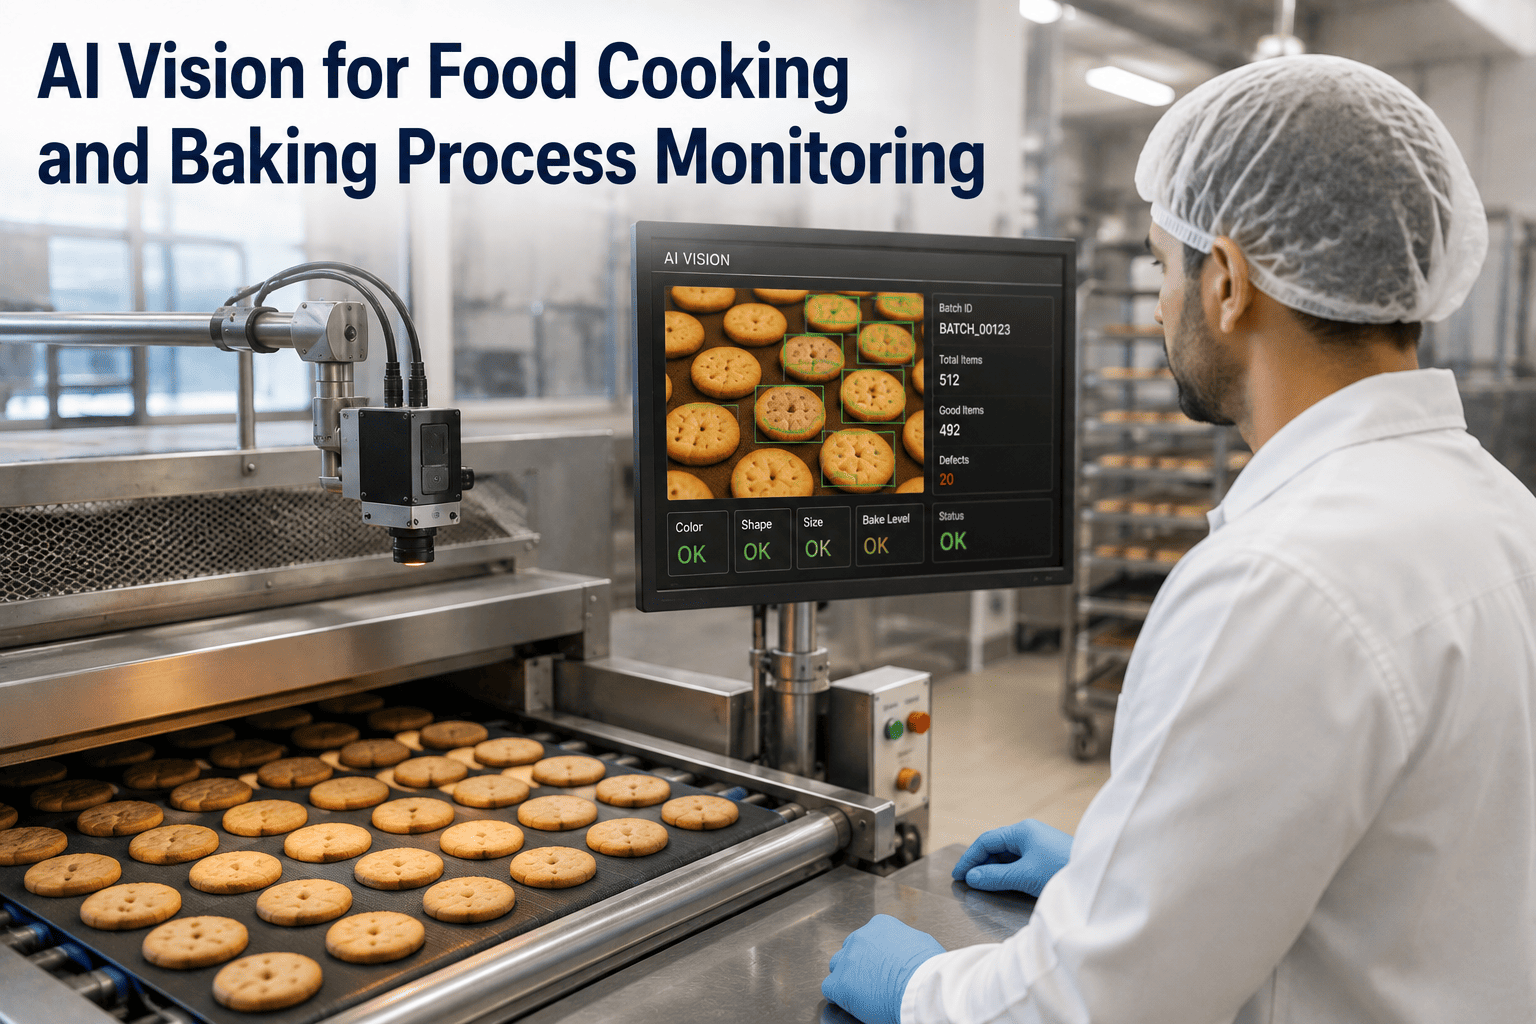
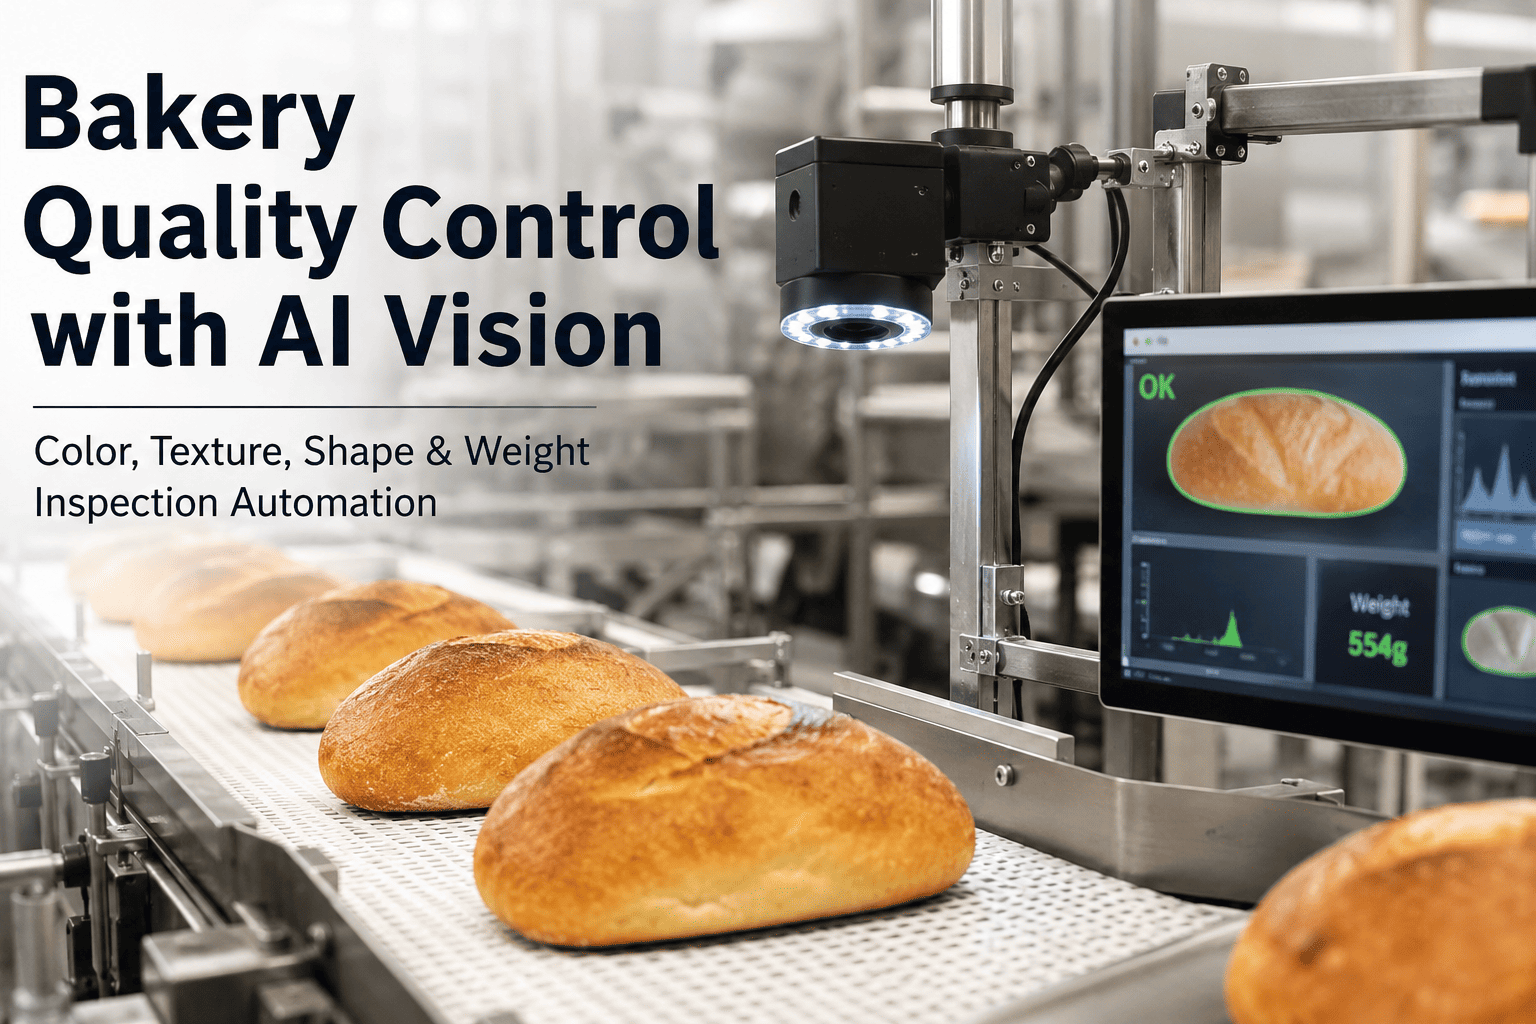
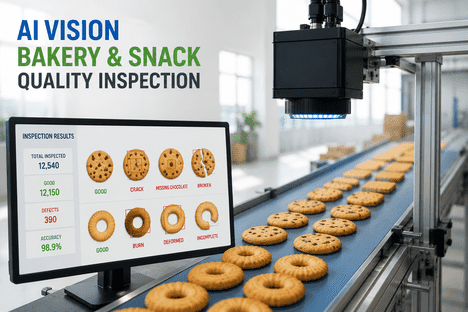
Bake color is not a cosmetic detail — it's the single most sensitive live signal any production oven produces. A cookie that comes off the belt at L* 68 instead of L* 62 didn't just get a shade lighter; it tells the plant that oven zone four dropped a degree at 3:14 AM, that the flour lot's protein came in low, that the belt speed drifted, or that a burner is starting to lose duty. The problem is that until the AI vision camera goes up over the exit belt, nobody sees any of that in real time. The bake color inspector checks a tray an hour later, the QC lab reads a sample the next shift, and by then twenty-four thousand cookies have already left the oven at the wrong shade. That's the gap AI vision closes: continuous L*a*b* measurement on every piece, every second, with alerts that fire while there's still time to correct the zone temperature before the next tray commits to the same drift. Bakery and food operations building this capability work with iFactory's food vision engineering team to map camera placement, product training sets, and CMMS-integrated deviation routing to each line's specific product portfolio.
Process Vision · Cooking & Baking
AI Vision for Food Cooking and Baking Process Monitoring
Measure bake color, product rise, surface texture, and cooking uniformity on every product leaving the oven — not the hourly sample the QC tech remembers to pull. Real-time L*a*b* against the master reference, automatic reject routing for out-of-spec pieces, and CMMS work orders when the vision data points at a zone that needs tuning.
Bake Color L* Target Envelope
Under
L* > 68
Doughy · reject
Target
L* 60–65
Golden · pass
Over
L* < 55
Scorched · reject
Continuous ±1 L* control at oven exit belt
Why Bake Color Is The Signal That Matters
The Maillard Reaction, The Human Eye, And Why Customers Actually Notice
The color of a finished baked good is the visible result of the Maillard reaction and caramelization — a temperature-dependent chemistry that unfolds across the final zones of the oven. That chemistry is exquisitely sensitive to variables the process engineer already knows are drifting: flour protein and moisture, sugar composition, dough temperature at pan-up, humidity in the proof room, belt speed, and zone-by-zone burner performance. Every one of those variables shifts the bake color slightly, and each shift compounds. By the time the finished product leaves the oven, its color is a running summary of every process variable that touched it — and the human eye, more than any lab instrument, is what your customer uses to decide whether they'll buy the second bag.
Traditional bake color control was always going to lose to that chemistry. A QC operator pulls a sample every hour and eyeballs it against a reference chart — or in more advanced plants, reads it on a benchtop spectrophotometer. Either way, the answer arrives after the drift has already produced a tray, a rack, or a full oven load of off-color product. Even automated color sensors on legacy lines typically measure a strip a few centimeters wide, which catches average bake color across a lane but misses lane-to-lane variation, product-to-product variation within a tray, and the specific pieces that need to be rejected before packaging.
AI vision closes both gaps simultaneously. A calibrated overhead camera captures every product on the belt in real time, segments each piece, computes L*a*b* against the master reference for that SKU, and routes the reject decision on a piece-by-piece basis rather than a tray-by-tray one. The signal isn't just "batch mean shifted to L* 66" — it's "pieces in lane three are shifting toward under-bake while lanes one and two remain in target, indicating zone-four heater bias." That kind of resolution is what turns a vision system from a reject sorter into a process-control instrument.
The Oven-Exit Signal Stack
Every Quality Attribute AI Vision Reads From A Piece Of Product
"Bake color" is only the headline signal. Modern food vision platforms read a stack of quality attributes from each product leaving the oven — every one of them a live indicator of a specific upstream process variable that would otherwise take shifts to diagnose. The eight attributes below are what a comprehensive oven-exit vision system measures on every piece.
A1
Bake Color (L*a*b*)
Full CIELAB reading on every piece. Under-bake, target, and over-bake pieces classified against SKU-specific L* envelope. The primary signal for oven zone temperature drift and belt speed variation.
A2
Product Height & Rise
Height profiling via structured light or laser triangulation. Reveals proofing anomalies, yeast activity variation, dough temperature drift, and mixer time deviation upstream of the oven.
A3
Surface Texture & Blistering
Deep learning classifies surface texture patterns — smooth crust, appropriate blistering, cracked crust, or scorched patches. Correlates directly with humidity control in the final oven zone.
A4
Shape & Diameter
Perimeter segmentation quantifies diameter, roundness, and shape deviation. Signals die wear on cookie extruders, dough consistency issues, and pan release problems.
A5
Topping & Seed Coverage
Segmentation counts seeds, sprinkles, or topping distribution per piece. Catches applicator drift before an entire production run ships under-topped or unevenly seeded.
A6
Cooking Uniformity Across Product
Color variation within a single piece — edges vs center, top vs bottom — flags hot spots in the oven, uneven convection, or belt loading pattern issues that cause within-product bake variation.
A7
Lane-To-Lane Variation
Cross-belt color and dimensional comparison flags heater bias, air flow imbalance, and edge effects. The signal that isolates zone-specific hardware issues from full-oven trends.
A8
Foreign Material & Scorch Debris
Detection of dark burn fragments, packaging debris on the belt, and process residue mixed with product. Catches contamination ahead of the packaging line rather than at the metal detector or customer.
The Bake Line, Instrumented
Where AI Vision Sits On A Continuous Baking Line — And What Each Position Sees
A single camera at the oven exit catches product going out the door, but the highest-value deployments position vision at multiple points along the line so that each stage reads the state coming into it and the state going out. The five-stage line below is how food vision platforms are typically laid out on a modern conveyor baking operation.
01
Dough Divide & Pan-Up
Piece Weight & Placement Check
Volumetric imaging catches piece weight variation, missing pieces on the pan, and off-position placement before the product enters the proofer. Signals divider knife wear and pan indexing issues.
02
Proofer Exit
Rise & Volume Verification
Height profiling confirms proof volume before the product commits to oven heat. Under-proofed or over-proofed pieces are caught before they consume the full oven cycle and produce off-spec output.
03
Oven Exit
Bake Color, Texture & Uniformity
The primary vision position. L*a*b* per piece, surface texture classification, shape validation, and lane-by-lane trending. Real-time feedback to oven zone controllers for temperature and belt speed correction.
04
Cooling Tunnel Exit
Final Appearance & Reject Sort
Post-cooling appearance check catches cracks, breakage, and cooling-related defects. Reject mechanisms — air jets or diverters — remove out-of-spec pieces before the packaging line encounters them.
05
Pre-Packaging
Topping, Count & Foreign Material
Final check for topping coverage, piece count per pack, and foreign material ahead of the bagger or wrapper. Every piece packaged has a documented pass-through in the compliance record.
See Live Bake Color Control On A Real Cookie Line
Watch AI Vision Auto-Correct The Final Oven Zone To Hold ±1 L*
Book a walkthrough with iFactory's food vision engineering team and see live L*a*b* trending on a real cookie line — lane-by-lane bake color, automatic zone temperature adjustment on drift, reject routing, and CMMS work order generation on burner bias signatures.
Product Categories Under Vision Monitoring
Where AI Vision Delivers The Highest Return By Product Type
Different baked and cooked products place different demands on vision monitoring — some are color-sensitive, some are shape-sensitive, some are topping-sensitive. The four categories below cover the majority of commercial food-manufacturing deployments, sorted by the specific quality attributes the vision system is most often tuned to catch.
Category 1
Cookies, Biscuits & Crackers
Primary signals: bake color · diameter · thickness · surface cracks
The classic use case. Continuous L*a*b* control against a tight ±1 target holds bake color consistent while the plant runs multiple flour lots and belt speed changes across a shift. Broken piece rejection, dimensional tolerance enforcement, and cracker docking pattern verification all run on the same pass.
Category 2
Bread, Buns & Rolls
Primary signals: rise height · crust color · shape · topping
Height profiling verifies proofing performance before the oven, then bake color and crust texture confirm oven zone performance at exit. Seed and topping coverage on burger buns catches applicator drift before under-topped product ships to a foodservice customer for a national chain.
Category 3
Pizza, Pastry & Filled Products
Primary signals: crust color · topping coverage · fill leakage
Multi-attribute inspection: crust color, pepperoni or vegetable topping coverage and count, cheese distribution, edge seal integrity on filled products, and leak detection at pastry corners. Topping applicators tuned in real time when coverage drifts below spec.
Category 4
Snacks, Chips & Fried Products
Primary signals: fry color · scorch marks · seasoning · foreign material
Continuous fry color monitoring catches oil quality drift and fryer temperature bias before it costs a full run. Seasoning distribution across the product bed verifies drum applicator performance, and foreign material detection catches burnt fragments and process residue before the bagger.
Manual QC Sampling vs Continuous AI Vision
The Structural Gap Between Hourly Sampling And Every-Piece Inspection
Every food plant runs some form of quality sampling — hourly checks, shift-based swatches, or continuous strip sensors on legacy lines. The table below is the direct comparison plant managers use when they take the case for AI vision to operations leadership, because the productivity math is decisive and every row compounds against traditional sampling.
| Dimension |
Manual / Legacy Sampling |
AI Vision Every-Piece Inspection |
| Sampling Coverage |
1 tray per hour, single strip sensor |
Every piece, every lane, continuously |
| Result Latency |
15–60 minutes to inspector feedback |
Sub-second per piece, immediate |
| Lane-To-Lane Variation Detection |
Invisible from a single sample |
Continuously trended per lane |
| Reject Granularity |
Tray-level or run-level rejection |
Piece-level rejection with air jet or diverter |
| Data For Root Cause |
Inspector notes, spot samples |
Every-piece imagery, L*a*b* trending, correlations |
| Human Fatigue Bias |
Sensitivity drifts across shift |
Consistent classification, 24/7 |
| Feedback To Oven Controls |
Operator judgment call after inspection |
Real-time zone adjustment on drift signal |
| Audit & Compliance Record |
Paper log, occasional photo |
Timestamped images per piece, SQF/BRC ready |
The structural gap isn't just about defect catch rate — it's about the feedback loop into oven and process controls. Manual sampling can only tell operators what already happened. AI vision tells the process controller what's happening now, with enough resolution and speed to correct the zone before the next tray commits to the same drift. That's the shift from reactive QC to real-time process control.
Where The Payback Actually Shows Up
The Six Cost Categories AI Vision Moves On A Food Line
Food plants running vision-inspected lines consistently report ROI concentrated in six cost categories. The stack below is the pattern iFactory's food engineering team sees repeat across deployments — sorted from largest single-category impact to smallest, and each category compounds with the others in a way the accounting side notices quickly.
01
Rework & Reject Waste Reduction
Real-time zone correction stops off-color runs at piece one instead of tray fifty. The single largest visible saving on the P&L — direct product waste avoidance plus the ingredient, energy, and packaging cost that went into every rejected piece.
02
Customer Complaint & Chargeback Cost
Retail and foodservice customers reject off-spec product and issue chargebacks. Catching the off-spec pieces before packaging eliminates the shipment issue entirely — and eliminates the compounding damage to the account relationship.
03
Oven Energy & Ingredient Waste
Every rejected piece consumed full oven cycle energy plus ingredients. Preventing the reject at zone-correction time saves both the energy and the ingredient loss on that piece — energy per kilo of good product drops measurably within weeks.
04
SQF / BRC / FSSC Audit Compliance
Every inspection generates a timestamped image and classification result. When auditors ask for evidence of consistent quality control across a production run, the record is one export away — a workflow that used to require assembling hand-written logs.
05
Labor Reallocation From Manual QC
The vision system doesn't replace the QC team — it reallocates their attention. Instead of pulling hourly samples and eyeballing color charts, they focus on root-cause investigation and continuous improvement using the vision data as their process pulse.
06
Predictive Maintenance On Oven Assets
Vision data correlated with oven zone performance reveals developing burner issues, belt drift, and heater bias before they become full failures. Maintenance work orders route automatically when a specific signature appears on the vision feed.
Field Perspective
"
The moment that convinces most plant managers isn't the demo — it's the third week of production data. In week one they see the vision system running and reporting defect rates that match what they think they know about the line. In week two they see lane-by-lane variation they didn't know existed, because a strip sensor and an hourly sample can't tell you that lane three has been running half a shade lighter than lanes one and two for the last six months. In week three the vision data starts pointing at specific oven zones, specific burners, specific belt segments, and the plant realizes the system isn't just catching defects — it's diagnosing the process. That's the shift that makes it stick. The other thing I emphasize with operations leadership is that AI vision is not trying to replace the master baker's judgment. It's trying to give the master baker a set of eyes on every piece leaving the oven, twenty-four hours a day, so that when the flour lot changes, when the outside humidity spikes, when a burner starts to lose duty, someone sees the signal within seconds instead of hours. That's the difference between a bake color spec that gets reviewed at end of shift and one that gets held ±1 L* continuously. Once a plant sees the second kind, they don't go back.
Thibault Nakashima-Ferreira
Food Manufacturing Systems Lead · 20 years in commercial bakery process engineering, machine vision deployment, and continuous oven control across cookie, bread, and snack lines
Common Questions
Frequently Asked Questions
How does the vision system handle natural variation in baked goods without producing false rejects?
Modern food vision platforms are trained specifically on the acceptable variation window for each SKU rather than a single ideal reference. During deployment, the engineering team collects thousands of images across a range of good product — different flour lots, different times of shift, different atmospheric conditions — and trains the classifier to accept everything inside that envelope as pass and only flag pieces genuinely outside it. False reject rates in well-tuned production systems typically drop below one percent within the first months, compared to the ten to fifteen percent that legacy strip-color sensors often produced. The training set grows as edge cases appear, so the classifier improves rather than degrades over the deployment lifecycle.
Talk to food vision engineering about the training approach for your specific product portfolio.
Can the vision system actually close the loop back to oven zone controls automatically?
Yes, and this is where the highest-value deployments concentrate their engineering effort. The vision system computes L* or ΔE against the SKU target continuously, and when the trend crosses a defined action threshold, it can send zone temperature adjustments directly to the oven controller via standard industrial communication protocols. For plants that prefer human-in-the-loop control, the vision system fires an operator alert with the specific zone and magnitude of correction recommended, and the operator makes the change. Both patterns work — closed-loop control delivers the tightest bake color envelope, while advisory alerts preserve operator judgment on shifts with unusual product mixes. Bakery deployments running full closed-loop typically hold bake color inside ±1 L* against target across the shift.
What camera positions are typical on a conveyor baking line, and how many cameras does a line need?
Most bakery lines run two to four camera positions depending on product type and defect priorities. The primary position is always oven exit — that's where bake color, texture, and dimensional signals live. A secondary position at cooling tunnel exit catches post-cooling defects like cracks and breakage that develop after the oven. A pre-packaging position handles topping coverage, piece count, and foreign material detection ahead of the bagger. Lines running products with underside defects add a fourth position with a tilting or transfer mechanism that exposes the bottom surface. The camera count is driven by product geometry and defect types rather than a generic template — deployment engineering sizes the layout to the specific line during the initial assessment.
How does vision data integrate with existing MES, CMMS, and quality management systems?
The vision platform is designed to feed structured data into the plant's existing systems rather than replace them. Standard integration ties each inspection result to the SKU code, production run identifier, and shift record from the MES, so every piece's classification is automatically linked to the batch context. Defect trends that correlate with specific equipment signatures generate work orders directly into the CMMS with attached imagery and recommended action. Quality management systems receive aggregated pass/fail statistics per run for SQF, BRC, and FSSC compliance reporting. Integration uses standard industrial protocols and REST APIs, completing during deployment engineering without requiring the plant to change its existing ERP, MES, or CMMS.
Book a demo to walk through integration architecture for your specific plant systems.
Does the vision system need to be food-safe and how is it cleaned in a bakery environment?
Yes, and the physical hardware selection reflects the food-safe requirement from the start. Cameras and illumination are typically housed in stainless steel enclosures rated to IP65 or higher for washdown environments, mounted overhead on a frame that sits above the product zone rather than in contact with it. Illumination uses cool LED sources that don't add heat to the product or the enclosure. During sanitation cycles, the vision hardware handles standard bakery washdown procedures without special handling, and calibration is verified against reference tiles at scheduled intervals rather than requiring recalibration after every cleaning. The system is designed to fit inside existing sanitation protocols, not create new ones — plants deploy without modifying their sanitation standard operating procedures.
Hold ±1 L* Across Every Shift
Turn Bake Color From An Hourly Sample Into A Continuous Controlled Metric
iFactory's AI vision platform is built for the specific realities of commercial food and bakery production — high line speeds, multiple product lanes, washdown environments, SQF and BRC audit requirements, and the tight economics of every-piece quality control. Continuous L*a*b* measurement, closed-loop oven zone correction, CMMS-integrated deviation routing, and full every-piece imagery archive come together into a single food vision layer that turns quality from a reactive metric into a real-time process.