AI Vision for Hazardous Spill Detection and Containment Verification
By Johnson on August 4, 2026
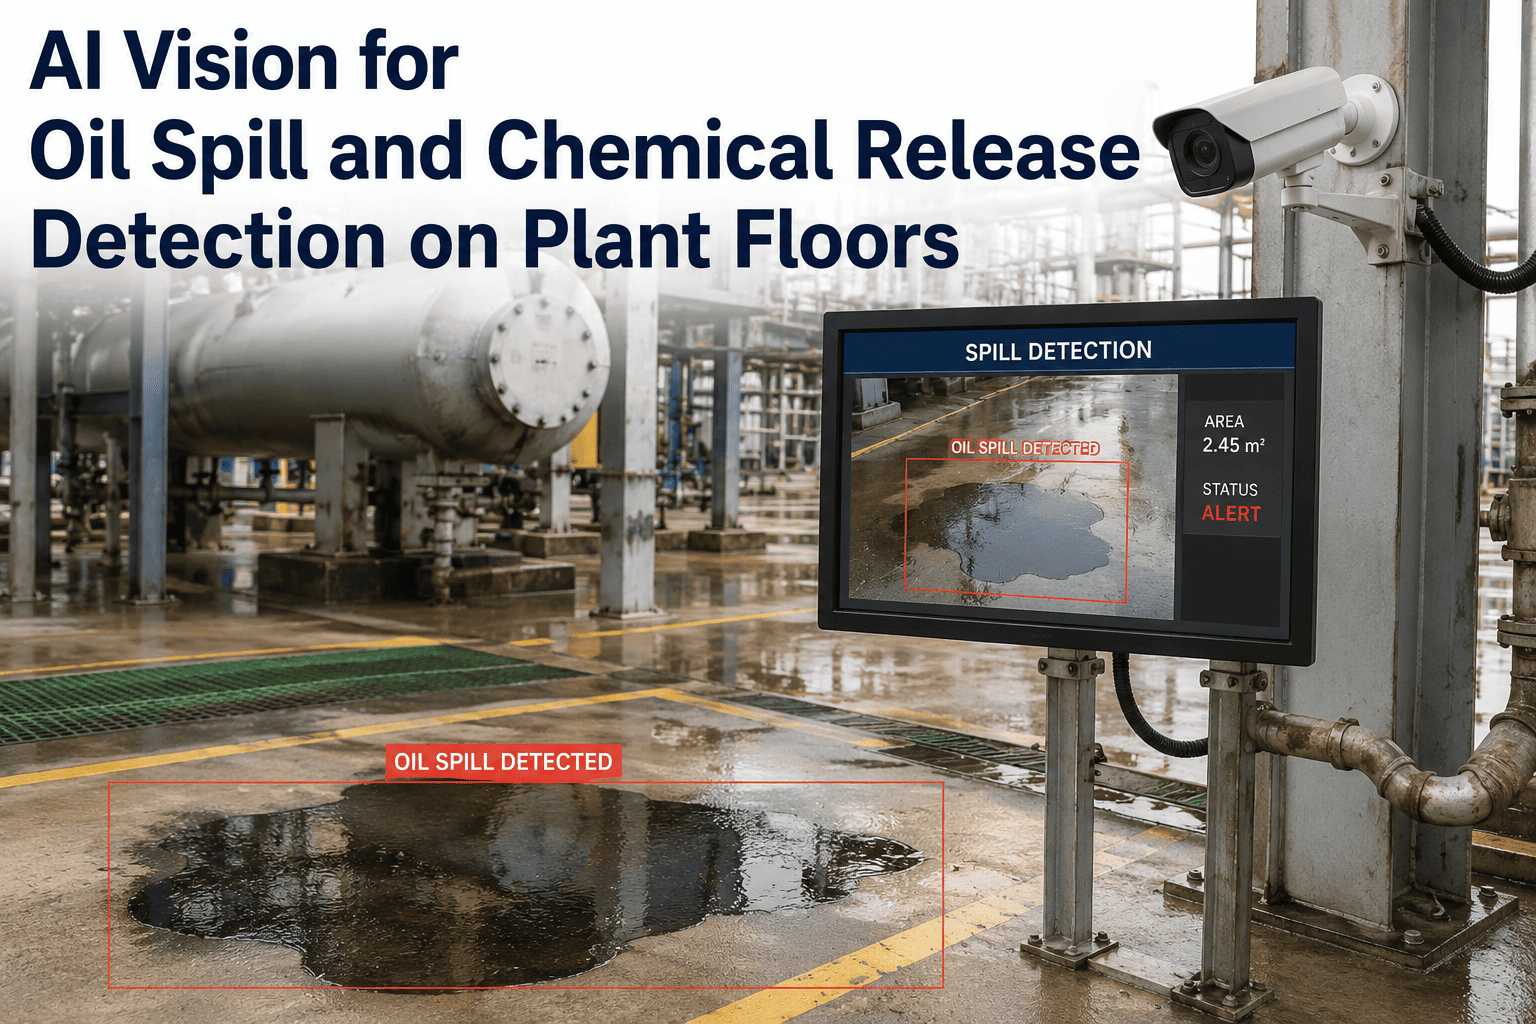
A secondary containment bund that holds during an EPA inspection and fails at 2 a.m. on a Tuesday is not a compliance program — it is a timed risk. The gap between periodic inspection and continuous monitoring is where chemical spills escalate from a $15,000 cleanup into a $295,000 regulatory penalty, a CERCLA remediation order, and a worker injury record. Traditional spill detection depends on someone being present, noticing a change in floor condition, and reporting it before the liquid pool spreads past the containment boundary. AI vision monitoring changes that dependency entirely: cameras watch the floor surface, bund walls, drain points, and transfer areas continuously, detecting liquid pool formation within seconds of release onset and triggering immediate alerts with timestamped visual evidence — whether or not anyone is on the floor. Learn how iFactory deploys this capability at ifactoryapp.com/support.
AI Safety Vision · Spill Detection · Containment Monitoring
Spill Detected in Seconds. Documented Automatically. Containment Verified Every Shift.
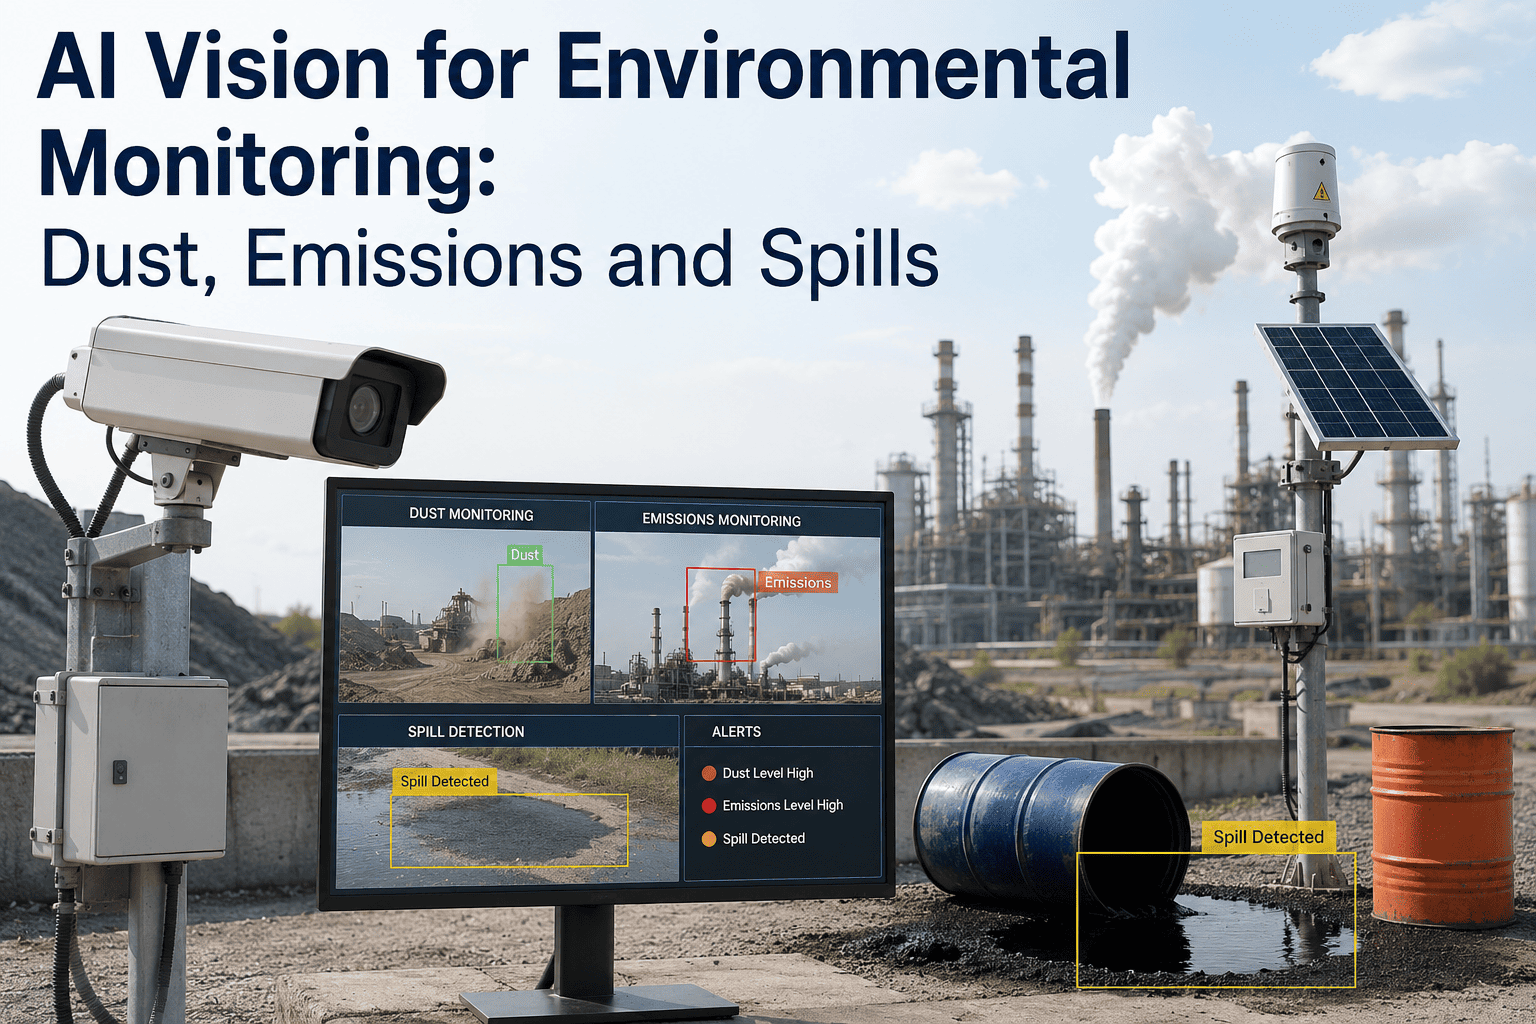
iFactory AI cameras watch bund areas, process floors, drain points, and transfer zones continuously — detecting liquid pool formation, containment breaches, and overflow conditions in real time, with instant alert routing and tamper-proof incident documentation.
What a Containment Breach Actually Costs — Beyond the Cleanup Bill
The immediate cleanup cost of a chemical spill is rarely what causes lasting damage to a facility. It is the cascade of regulatory, legal, and operational consequences that follow — particularly when the spill is discovered late, documentation is incomplete, or containment infrastructure is found to have been ineffective. Every minute between spill onset and detection adds to the exposure scope.
Regulatory Penalties
$295,564
Maximum EPA civil penalty per SPCC violation as of January 2025, under 40 CFR Part 112. Class II violations accrue at $23,647 per day until the condition is corrected and documented.
Source: EPA 40 CFR Part 112, 2025 penalty schedule
Remediation Costs
$40,000+
Average cleanup cost per containment breach including labour, materials, production downtime, and third-party hazardous waste disposal — before accounting for any soil or groundwater contamination.
Source: Industry containment breach case data
Industry Annual Impact
$477M
EPA-reported total annual cost of industrial chemical accidents in the US, including injuries, deaths, and remediation — with chemical incidents occurring at a rate of nearly one per day across the country.
Source: EPA emergency response data, 2024
OSHA Training Penalty
$15,000
OSHA penalty range per incident for inadequate spill response training or missing documentation — separate from any EPA environmental penalty and compounding when both agencies investigate the same event.
Every Release Scenario iFactory Vision Detects — From Drip to Containment Overflow
AI spill detection is not a single model watching for a puddle. iFactory deploys a tiered detection architecture that identifies releases at different stages of development — from the earliest visible surface wetness through active pool expansion, containment wall approach, and boundary breach — each triggering a different alert level and response protocol.
1
Stage 1: Early Release
Surface Wetness and Drip Formation
Localised surface appearance change at equipment flanges, valve stems, pump seals, or pipe joints. Pool area under 0.1 m². AI detects the characteristic light-reflectance signature of wet surface versus established dry baseline, distinguishing genuine liquid accumulation from steam, shadows, or wash-down residue.
Alert level: Advisory — EHS notification, operator inspection within 15 min
2
Stage 2: Active Pool
Pool Growth and Spread Tracking
Detected liquid area is expanding at a measurable rate across successive image frames. Pool growth rate analysis distinguishes an active ongoing release from a static residual accumulation — preventing false alarms from standing water while capturing real leak progression. Growth rate and direction are logged continuously.
Pool edge has reached within a configurable distance of the secondary containment boundary — typically 0.5 to 1.0 m depending on facility SPCC plan thresholds. The system issues a pre-breach alert, giving response teams time to intervene with portable berms or emergency absorbents before the containment boundary is reached.
Alert level: Urgent — emergency response team activation, control room alarm
4
Stage 4: Containment Breach
Liquid Outside Secondary Boundary
Liquid detected outside the secondary containment boundary — a reportable event under SPCC and potentially under CERCLA/EPCRA. The system captures timestamped images of the breach at detection, immediately creates a regulatory incident record, and triggers the facility's spill notification chain automatically without requiring a human to initiate reporting.
Alert level: Critical — regulatory notification chain, NRC report trigger, full incident record
Coverage Zones
Where iFactory Cameras Are Positioned Across a Chemical or Industrial Facility
Secondary Containment Bunds
Overhead camera coverage of entire bund floor area with pooling detection tuned to the bund surface material. Pool-to-boundary distance measured continuously. SPCC-compliant inspection record generated for every monitored shift, replacing manual bund walk-through logs with timestamped visual evidence.
Tank Farm and AST Areas
Cameras mounted on bund perimeter walls provide full tank base and bund floor coverage. Floating roof seal conditions, fill pipe connections, and bund drain valve status are monitored continuously. Any liquid appearance at tank base or on floating roof surface triggers immediate alert.
Transfer and Loading Areas
Loading arm connections, hose coupling zones, and tanker berth areas are highest-risk spill points during active transfer operations. iFactory monitors drip zones at each transfer point, triggering alerts on visible release onset during loading — before a spill reaches the drain or the floor beyond the loading pad.
Drum and IBC Storage Rooms
Overhead cameras in drum storage and IBC cage areas watch for tipped containers, leaking bungs, and overflow from overfull containers. Pallet spill platform monitoring confirms that secondary containment pallets are structurally sound and that no accumulation is occurring at floor level.
Process Equipment Floors
Pump seal areas, valve manifolds, heat exchangers, and reactor bases on open process floors are monitored for surface wetness and pool formation. Drain point cameras verify that floor drains are not accumulating liquid from a slow release that would not be visible from walkway level during shift rounds.
Walkways and Emergency Egress
Slip hazard detection on pedestrian routes identifies liquid spills on walkways before a worker encounters them — generating an immediate housekeeping alert that protects personnel while the spill source is investigated. Emergency egress path monitoring confirms routes remain clear and dry during incident response.
Your SPCC Plan Says Containment Is Monitored. AI Vision Makes It True Around the Clock.
iFactory ships a pre-configured NVIDIA AI edge server, racked and ready. Rack it, connect power and Ethernet, and continuous spill monitoring is live — integrated with your existing IP camera infrastructure in 6 to 12 weeks, including model calibration, zone configuration, and alert routing setup.
Every Detection Event Creates a Regulatory-Grade Incident Record Automatically
The hardest part of spill compliance is not detecting the event — it is producing documentation that satisfies an EPA inspector, an OSHA auditor, or a legal proceeding after the fact. Manual incident reports are written from memory, filled out under pressure, and frequently incomplete. iFactory generates the incident record automatically at the moment of detection, from verified visual evidence.
01
Detection Timestamp
UTC timestamp accurate to the second at the moment AI detection fires — not when an operator notices and walks to a terminal. This timestamp establishes the legal start of the incident record and is stored immutably in the edge server log.
02
Annotated Image Capture
The frame at detection is preserved with AI annotation marks showing the detected pool boundary, area measurement, and zone classification. A hash is generated for tamper-evidence verification — the image cannot be altered without the hash mismatch becoming visible in the record.
03
Alert Routing Log
Every alert sent — to which personnel, via which channel, at which timestamp — is logged in the incident record. This demonstrates that the facility's notification procedures were executed correctly, which is the primary evidence EPA inspectors look for in a post-incident review.
04
Growth Sequence Images
Periodic images captured throughout the incident document the progression of the spill — pool size at 1-minute intervals from detection to containment confirmation. This sequence demonstrates the facility's response timeline and the adequacy of containment infrastructure.
05
Containment Verification
When the detected pool stops expanding and the AI confirms the liquid is contained within the secondary boundary, a containment-verified status is written to the incident record with timestamp. This is the positive confirmation your SPCC plan requires to demonstrate the containment infrastructure performed as designed.
06
Exportable Incident Report
The complete record — detection timestamp, annotated images, alert log, growth sequence, and containment verification — is exportable as a PDF incident report formatted for SPCC record-keeping requirements and directly usable in NRC reporting or OSHA recordkeeping without any manual compilation.
Compliance Coverage
Regulatory Frameworks That Continuous AI Spill Monitoring Directly Supports
Regulation
Key Requirement
Manual Monitoring Gap
How AI Vision Closes It
EPA SPCC 40 CFR Part 112
Secondary containment for all bulk storage; regular inspection; spill prevention plan implementation
Inspections only periodic — containment condition between walk-throughs is unverified
Continuous bund monitoring with shift-by-shift inspection records and pool-to-boundary tracking
OSHA PSM 29 CFR 1910.119
Process Hazard Analysis; Mechanical Integrity program; leak detection and prevention evidence
PHA teams lack historical release data with spatial resolution for accurate scenario modelling
Timestamped release event database with exact location, duration, and pool growth data for PHA input
CERCLA/EPCRA Sections 102/304
Reportable Quantity releases must be notified to NRC and state agencies — accurate quantity and timing required
Release timing and quantity uncertain when detection is delayed — regulatory exposure window extended
Precise detection timestamp and pool area data supports accurate RQ calculations and on-time NRC notification
OSHA HAZWOPER 29 CFR 1910.120
Emergency response procedures; documentation of training and incident response execution
Response execution documentation relies on manual logs written under emergency conditions
Automated alert routing log proves notification chain was executed correctly within required timeframes
EPA LDAR 40 CFR Part 60/63
Leak Detection and Repair programs for VOC-emitting equipment; monitoring frequency and repair documentation
Method 21 surveys only periodic — equipment leaks between survey intervals are undetected
What EHS Managers and Facility Compliance Officers Ask First
How does the AI distinguish a genuine spill from routine wet surfaces — wash-down water, rain, or steam condensation?
This is the core technical challenge in spill detection AI, and iFactory addresses it through three mechanisms working together. First, the model is calibrated to the normal appearance of each monitored zone during commissioning — capturing the expected range of lighting conditions, wet/dry cycles, and surface conditions that are normal for that area. This baseline model means the detection threshold is zone-specific rather than a generic global threshold. Second, pool growth rate analysis is applied to every detected liquid event: genuine spills expand continuously over successive frames, while wash-down water evaporates or drains. A static wet patch that is contracting is suppressed from alerting. Third, nuisance sources — steam vents, cooling tower drift zones, and designated wash areas — are defined as exclusion zones during commissioning so their visual signatures do not trigger detection. The result is a false positive rate typically below 2% in commissioning-validated deployments. Book a demo to review the calibration approach for your specific environment.
Can the system detect colourless or clear liquid spills on concrete surfaces?
Clear liquids on dry concrete present a lower-contrast detection challenge than coloured process fluids, and the detection capability depends on the surface material, ambient lighting, and camera angle. In standard overhead configurations with diffuse lighting, clear water creates a detectable surface reflectance change on concrete, epoxy, and sealed floor surfaces — the AI detects the wet-dry boundary even for colourless liquids because the reflectance signature of wetted concrete differs measurably from dry concrete under industrial lighting. For high-priority clear liquid monitoring — solvents, acids, or water-clear process fluids — iFactory recommends a supplemental low-angle side lighting ring at the camera position that enhances the reflectance contrast of wet surface patches, significantly improving detection sensitivity for clear liquids. Detection of clear liquids is confirmed during site commissioning on the actual floor surface and lighting conditions at each zone. Contact our team to assess clear liquid detectability in your specific zones.
Does the AI monitoring system satisfy the SPCC inspection record requirement, replacing manual bund walk-throughs?
iFactory generates a continuous monitoring record for every monitored zone — a timestamped log of the AI's assessment of containment condition across every shift, including any detection events and their resolution status. For facilities seeking to use this record as the primary SPCC inspection documentation in place of manual walk-throughs, the critical factor is whether the facility's professional-engineer-certified SPCC plan specifies the inspection method. Plans that specify periodic visual inspection as the required method may require a plan amendment to accept continuous AI monitoring as the compliant approach. iFactory provides a compliance documentation package that facilities can use when working with their PE to amend the SPCC plan to specify continuous AI vision monitoring, including the monitoring system specification, detection capability documentation, and alert response protocol that the plan amendment needs to reference. Book a demo to review the compliance documentation package with our EHS team.
How are alerts routed and who receives spill notifications?
Alert routing is fully configurable per zone and per detection stage. For a Stage 1 advisory-level event, alerts might route to a local area supervisor and the EHS team via mobile push notification. For a Stage 3 or Stage 4 critical event, the routing expands to include the plant emergency coordinator, the control room, and — where configured — an automated outbound notification to the facility's environmental consultant or emergency response contractor. Supported notification channels include SMS, email, mobile push notifications via the iFactory app, and integration with existing alarm management systems via MQTT or REST webhook. Every alert sent is logged with recipient, timestamp, and delivery confirmation — creating the notification chain evidence that OSHA HAZWOPER and SPCC response procedure requirements depend on. Alert routing is tested and verified during commissioning before the system goes live. Contact iFactory support to review alert routing architecture for your facility response plan.
What happens to incident documentation if the network or edge server experiences a failure during an active spill event?
iFactory's edge server stores incident records locally in a redundant database that continues to capture and write data regardless of network connectivity status. Camera feeds are buffered locally during any network interruption, and detection analysis continues without interruption — the AI runs on the edge server, not in a cloud that requires network access for inference. Images captured during a network outage are stored locally and synchronised to the central incident management system when connectivity is restored, with original timestamps preserved. For maximum resilience in high-consequence areas, iFactory supports a secondary edge recording unit that maintains a parallel local archive. The system is designed so that a network failure during an active incident does not create a gap in the regulatory incident record — the local store is the primary record, and network synchronisation is a secondary convenience function rather than a dependency. Detailed failover architecture is documented in the system specification provided before deployment.
Every Hour Your Bund Goes Unmonitored Is an Hour a Spill Can Start Growing Undetected.
iFactory AI cameras watch your secondary containment, transfer areas, and process floors continuously — detecting spills in seconds, documenting incidents automatically, and providing the regulatory-grade records your SPCC plan requires. Live in 6 to 12 weeks on existing camera infrastructure.