A refinery turnaround costs $1 million a day in lost production. A typical shell-and-tube heat exchanger holds anywhere from a few hundred to 50,000 tubes — each of which needs a pass-fail verdict before the unit restarts. Today, that verdict comes from a technician with a flashlight, a clipboard, and a hand-sketched tube map. Every pit missed becomes a mid-cycle leak. Every ligament crack overlooked becomes an unplanned shutdown. AI vision now maps every tube, quantifies every defect, and delivers an audit-ready inspection report in hours instead of days. To see the workflow on your next bundle, book a 30-minute turnaround walkthrough.
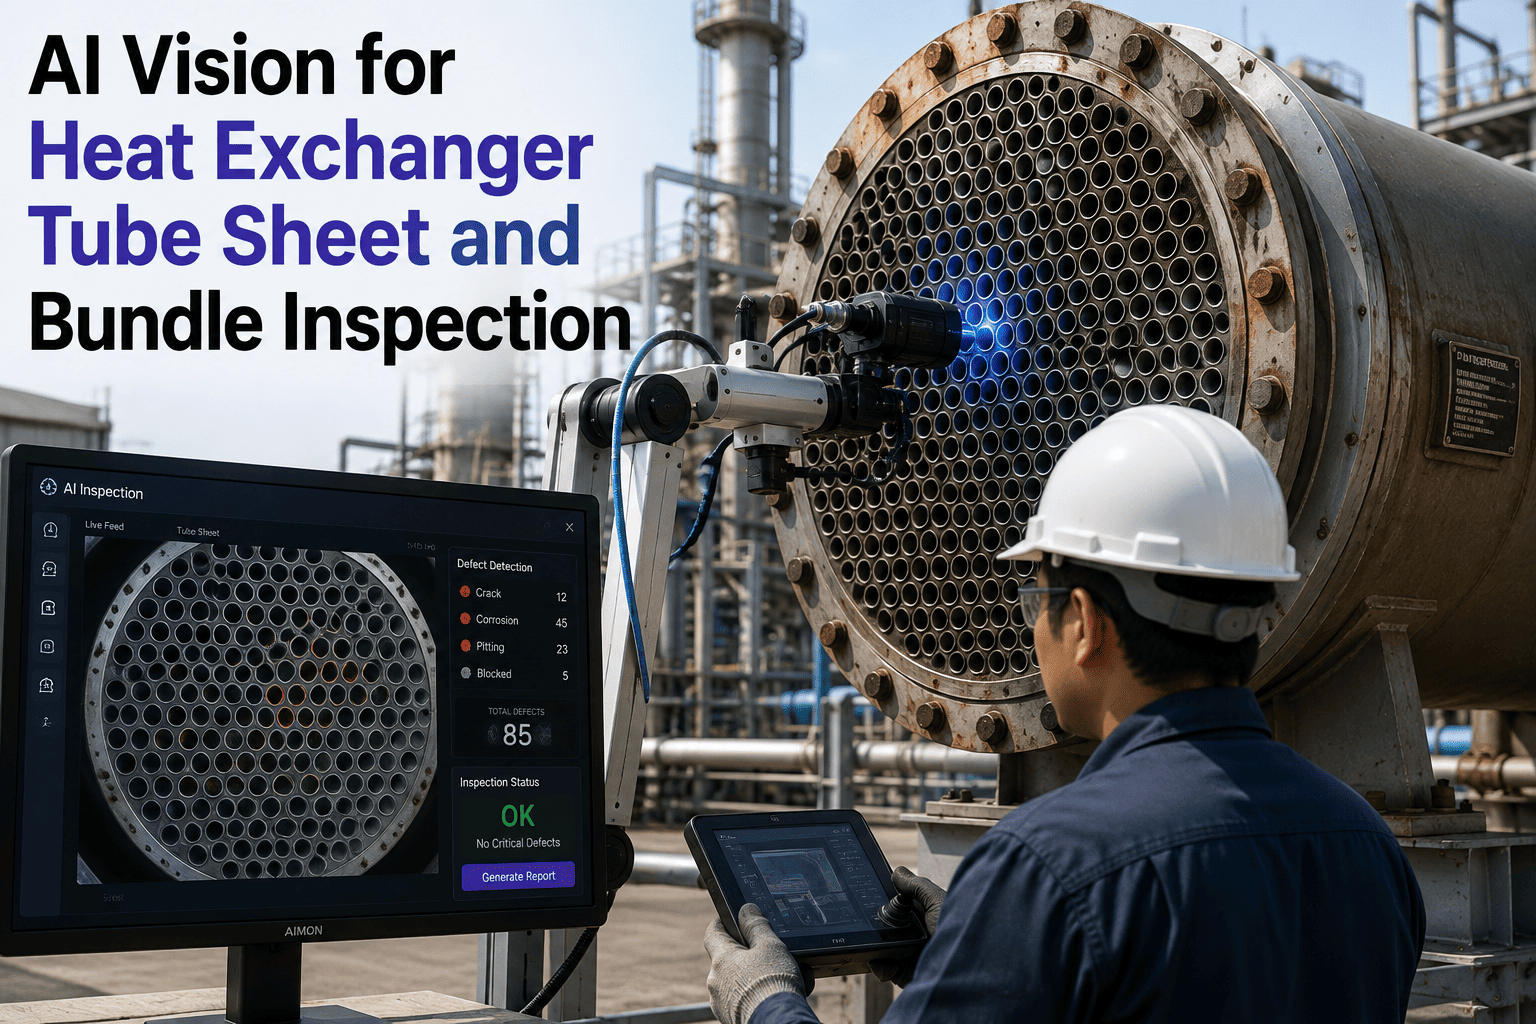
AI Vision for Heat Exchanger Tube Sheet & Bundle Inspection
Camera-based tube sheet mapping that replaces subjective sketches with quantified, defect-tagged inspection reports — every pit, groove, and ligament crack located, measured, and archived before the bundle goes back in the shell. Built for shell-and-tube exchangers across refining, petrochemical, power generation, and process chemical service.
The Manual Inspection Problem — Why Sketches Miss Money
Traditional tube sheet inspection is a race against turnaround clock. A senior technician stands in front of a bundle with 1,200 tubes, marks defects on a paper grid, dictates observations to an assistant, and hands over a scanned PDF at end of shift. It is craft work — and it carries all the failure modes of craft work when a $1M-per-day production window is on the line. The four gaps below are the ones that quietly cost refineries their next turnaround interval. Every gap compounds — the coverage problem creates the trending problem, which hides the acceleration problem, which becomes the mid-cycle failure eighteen months into what should have been a four-year run. Reliability leaders know the cycle. What has been missing is the tooling to break it at the inspection step.
Statistical Sampling Instead of Full Bundle Coverage
Time pressure forces most inspection contractors to sample 10-25% of tubes and extrapolate. A 1,200-tube bundle gets 200 tubes actually looked at. The other 1,000 get a "presumed similar" tag. Pitting that is not statistically representative — the localized attack from a caustic dead-leg or a bacterial colony — passes without a mark. It shows up eighteen months later as a mid-cycle leak.
Subjective Verdicts That Cannot Be Reproduced
"Moderate pitting, tube row 14." What is moderate? A senior technician with twenty years reads a pit pattern one way; the next-shift technician reads it another. Bundle-over-bundle trend analysis becomes impossible when the underlying data is qualitative. The reliability engineer cannot answer whether tube corrosion is accelerating because there is no comparable baseline to measure against.
Days of Bundle Time Inside the Critical Path
A full manual visual inspection of a mid-size bundle takes two to four shifts. Every shift the bundle sits in the exchanger cleaning bay is a shift it is not being welded, retubed, or reinserted. At $1M per day of unit downtime, a two-day inspection window represents real production margin at risk — and the schedule pressure to short-cut inspection becomes irresistible.
Sketches That Do Not Hold Up to Auditor Scrutiny
When the next turnaround team, an insurance adjuster, or an API 510 auditor asks to see the defect at row 22, column 8 from the previous outage — the answer is often a blurry cell-phone photo or nothing at all. There is no image-linked, defect-tagged, coordinate-referenced record. Every turnaround starts fresh, without the previous cycle's baseline to compare against.
Old Workflow vs AI Vision Workflow — Same Bundle, Different Answer
The value of AI vision in tube sheet inspection is not "we replaced the technician." It is that the same underlying inspection now produces a different artifact — one that can be trended, audited, and defended. The qualified inspector still signs off on the verdict; what changes is that the verdict now sits on top of quantified, coordinate-tagged, image-linked data instead of a hand-sketched grid. Below is the side-by-side of what actually changes in the workflow when a computer vision system takes over the imaging and defect-mapping steps of the inspection, and what the qualified inspector's role becomes on the other side of the transition.
The Defect Taxonomy the Vision Model Detects and Grades
Heat exchanger tube failures do not have one shape. Pitting looks different from erosion, which looks different from ligament cracking at the tubesheet weld, which looks different from a flow-induced fretting groove. The iFactory vision model is trained on the full defect taxonomy that shows up in shell-and-tube exchangers across refining, petrochemical, power generation, and process chemical service. Each defect class ships with its own severity grading logic tied to the underlying failure mechanism, and each classification is defensible against the reference imagery an API 510 or PED auditor would expect to see in the inspection file. The taxonomy below covers the highest-volume failure modes seen across shell-and-tube exchanger fleets in mainline refining, gas processing, ethylene, ammonia, and utility power service — and it is extensible to service-specific defects that show up in your particular process fluid environment.
Pitting Corrosion
Localized attack from electrochemical gradients — oxygen and carbon dioxide concentration, bacterial colonies, insufficient water treatment. Pits form preferentially in cold-fluid zones and can penetrate tube wall to pinhole leak inside a single turnaround interval if not caught and trended.
Erosion & Fretting Grooves
High-velocity fluid attack at bends, inlet impingement zones, and baffle contact points. Fretting from flow-induced vibration produces characteristic linear grooves at baffle intersections. Both mechanisms accelerate wall loss and are trended against baseline to project remaining service life.
Ligament Cracking
Cracks in the tubesheet material between adjacent tube holes — driven by over-rolling during expansion, thermal cycling stress, or stress corrosion in caustic service. Ligament failure propagates leaks between tubes and can compromise the entire tubesheet integrity if not identified and repaired before the next cycle.
Weld Defects at Tube-to-Sheet Joint
Cracks, porosity, and undercutting at the tube-to-tubesheet weld are the single most common source of shell-side to tube-side leaks. The vision model inspects the weld crown and heat-affected zone around every tube position, flagging deviations from the accepted weld profile for follow-up NDT.
Deposits, Scaling & Fouling
Mineral scaling, sludge, and biological growth restrict heat transfer and often mask underlying corrosion. The vision model differentiates surface deposit from underlying wall loss, quantifies fouling coverage, and produces the cleaning-adequacy verdict before the bundle proceeds to inspection.
Mechanical Damage & Dents
Handling damage from cleaning nozzles, hydro-blast operations, or transport between the exchanger and the cleaning bay. Every dent, dimple, and mechanical deformation is tagged to a specific tube coordinate so the source of damage can be traced back to the responsible workflow step.
Every Tube Deserves an Image, a Coordinate, and a Verdict
iFactory replaces hand-sketched tube maps with quantified, image-linked, coordinate-referenced defect reports — before the bundle goes back in the shell. Full coverage, not sampling. Two hours, not two days. Audit-ready, not audit-defensible.
Inspection Timeline — Same Bundle, Two Very Different Days
The clearest way to see the value proposition is on the turnaround Gantt. A mid-size bundle inspection with the traditional workflow runs across two full shifts and blocks downstream retube, weld, and reinsert work. The same bundle with the vision workflow clears the critical path inside a single shift and produces a richer artifact. The delta below is measured from bundle-arrival at the inspection bay to signed inspection release, on a representative bundle of roughly 1,200 tubes in typical hydrocarbon service. The savings scale linearly with bundle count — a turnaround with twenty exchangers in scope multiplies these numbers across the whole outage window, and the returned days often become the difference between an on-schedule startup and a delayed one.
Bundle-Over-Bundle Trending — What Turnaround Two Now Looks Like
The strategic value of a coordinate-tagged, image-linked inspection database only compounds. Turnaround one establishes the baseline. Turnaround two compares every tube position against its own previous state — pit growth measured in millimeters per year, erosion pattern shift tracked to changed operating conditions, ligament cracks correlated with thermal cycling frequency. This is what a modern integrity operations management program looks like when the underlying data is quantitative. The risk-based inspection framework that most refineries and petrochemical plants operate under assumes that defect progression can be trended and projected — an assumption that has always been true in theory and rarely achievable in practice, because the underlying inspection data has been qualitative sketches. Quantitative, image-linked, coordinate-tagged bundle histories are what makes RBI finally deliver on its original promise for shell-and-tube exchanger fleets.
Baseline capture. Every tube position imaged and classified. Defect coordinates archived to the reliability database with severity ratings and full-resolution reference imagery.
Delta comparison. Each tube compared against its baseline. Growth rates calculated. Accelerating positions flagged for RBI recalibration and targeted NDT with UT or eddy current for depth confirmation.
Predictive model. Three cycles of quantitative data feed remaining-life projections at the tube-position level. Retube versus repair decisions become engineering calls, not judgment calls.
Where AI Vision Bundle Inspection Delivers Fastest Payback
The value calculus varies by industry — refining pays back on turnaround critical path, power generation pays back on outage window compression, petrochemical pays back on avoided mid-cycle failures. The applications below are the ones where iFactory sees the fastest and most defensible ROI when the vision inspection scope replaces the traditional manual walk on shell-and-tube heat exchanger populations.
Crude Preheat Trains, Reactor Effluent Coolers, Overhead Condensers
The exchanger population that lives inside a refinery unit turnaround is where the vision inspection scope pays back fastest. Twenty to forty bundles per unit, all on the critical path, all with defect signatures the model has seen thousands of times — pitting from sour water, ligament cracking at hydroprocessing service temperatures, fretting grooves at the baffle contacts of high-velocity streams. Every bundle that clears inspection in one shift instead of two returns a shift to the retube and reinsert scope downstream.
Ethylene Cracker Quench Exchangers, Reformer Feed-Effluent Bundles
Petrochemical bundles run hotter and cycle harder than most refining service, and the failure signatures reflect it — thermal fatigue cracking, coke deposition masking underlying corrosion, weld defects at the tube-to-tubesheet joint driven by cyclic stress. The vision model handles all three, and the quantitative trending is what supports the extended-interval turnaround planning that ethylene and reforming operations increasingly rely on.
Feedwater Heaters, Steam Surface Condensers, HRSG Tube Bundles
Steam-side and cooling-water-side bundles have very different failure signatures — feedwater heater pitting from dissolved oxygen breakthrough, condenser tube fretting from cooling water flow, HRSG cracking at header-to-tube joints from thermal cycling. Vision inspection compresses the outage inspection window and provides the quantitative baseline that steam plant reliability engineers need to justify tube plugging thresholds against ASME Section VII inspection intervals.
Caustic Coolers, Chlorine Service Exchangers, Ammonia Condensers
Aggressive-service exchangers accumulate defect patterns fast, and mid-cycle failures on chlorine or ammonia service carry catastrophic consequences beyond production loss. The vision inspection scope produces the traceable defect history that process safety management programs increasingly require — every position imaged, every defect coordinated, every turnaround comparable to the last.
The Numbers Reliability Leaders Track
The metrics below are the ones plant reliability leaders and turnaround managers reference when the AI vision platform becomes standard scope in their exchanger inspection program. Every number is tied to a specific workflow change the platform introduces — and every one is defensible in front of a plant manager, an insurance underwriter, or an API 510 inspector. These are median outcomes across the first three turnaround cycles of deployment, once the baseline capture and one comparison cycle have established the trending foundation the platform is designed to build.
Frequently Asked Questions
Does the AI vision system replace eddy current or IRIS tube testing?
No, and it should not be positioned that way. Eddy current, remote field, magnetic flux leakage, and IRIS remain the definitive NDT techniques for measuring subsurface tube wall thinning and internal defects. The AI vision layer handles the visual tube sheet and bundle inspection scope — pitting, erosion, ligament cracks, weld defects, fouling coverage, and mechanical damage — that is currently done by a technician with a flashlight and a clipboard. The two work together: vision catches surface indications and triggers targeted follow-up NDT at specific tube coordinates, rather than blanket testing every tube in the bundle. To see how the workflows integrate, book a scoping session.
How does the system handle bundles that vary in tube count, pattern, and pitch?
The vision rig is configurable to any tubesheet geometry — triangular, square, rotated square, or diamond pitch — and to bundles ranging from a few hundred tubes to more than ten thousand. During onboarding, the system captures a calibration image of each unique bundle configuration in your fleet and builds a coordinate reference grid that every subsequent inspection registers against. That means turnaround one establishes the reference for that specific bundle geometry, and every future inspection compares against the same coordinate system — so trending is bundle-specific and defect positions are traceable across cycles.
What kind of infrastructure does the inspection bay need?
The core requirement is stable power, a fixed camera and lighting rig position where the bundle will be presented, and network connectivity for report delivery. Most exchanger cleaning bays already have the space allocation and the utilities — the vision rig installs on a portable frame that can be positioned at the bundle face without permanent modifications to the bay. The edge inference cabinet handles model execution locally, so bundle imagery and defect maps do not leave your facility unless you choose to sync them to the reliability database. Setup for a new bay is typically completed inside two days.
How defensible is a vision-generated inspection report in an API 510 or PED audit?
Highly defensible — often more so than the manual baseline. Every defect the vision model flags is stored with the source image, the coordinate reference, the timestamp, the model version that produced the classification, and the reviewing inspector's signature. That is a stronger evidentiary chain than a hand-sketched grid with a scanned PDF, and it meets the traceability expectations of API 510, PED, and the reliability sections of most jurisdictional pressure vessel codes. The system is designed to augment the qualified inspector's judgment with quantified data, not to replace inspector sign-off. For an audit-format walkthrough, reach out to the integrity team.
What is a realistic first-turnaround ROI for a facility with a large exchanger population?
The ROI math is driven by two levers — critical-path days returned to the turnaround schedule, and mid-cycle exchanger failures prevented in the operating interval that follows. A facility with twenty bundles in the turnaround scope typically returns fifteen to twenty inspection days to the critical path, worth eight-figure production value at $1M-per-day of unit downtime. Layer in one avoided mid-cycle exchanger leak — which typically forces a short unplanned outage — and the platform pays back inside the first turnaround for most refinery and petrochemical operations. To model the specific ROI for your bundle count and turnaround duration, book a 30-minute assessment.
Make Every Bundle Inspection Count Toward the Next Turnaround Interval
Every pit mapped. Every ligament crack coordinate-tagged. Every tube position trended against the last turnaround. iFactory AI vision delivers a defect map an integrity engineer can actually plan against — in one shift, at full coverage, with an audit chain that holds. Start with one bundle. Prove the delta. Scale to the fleet.