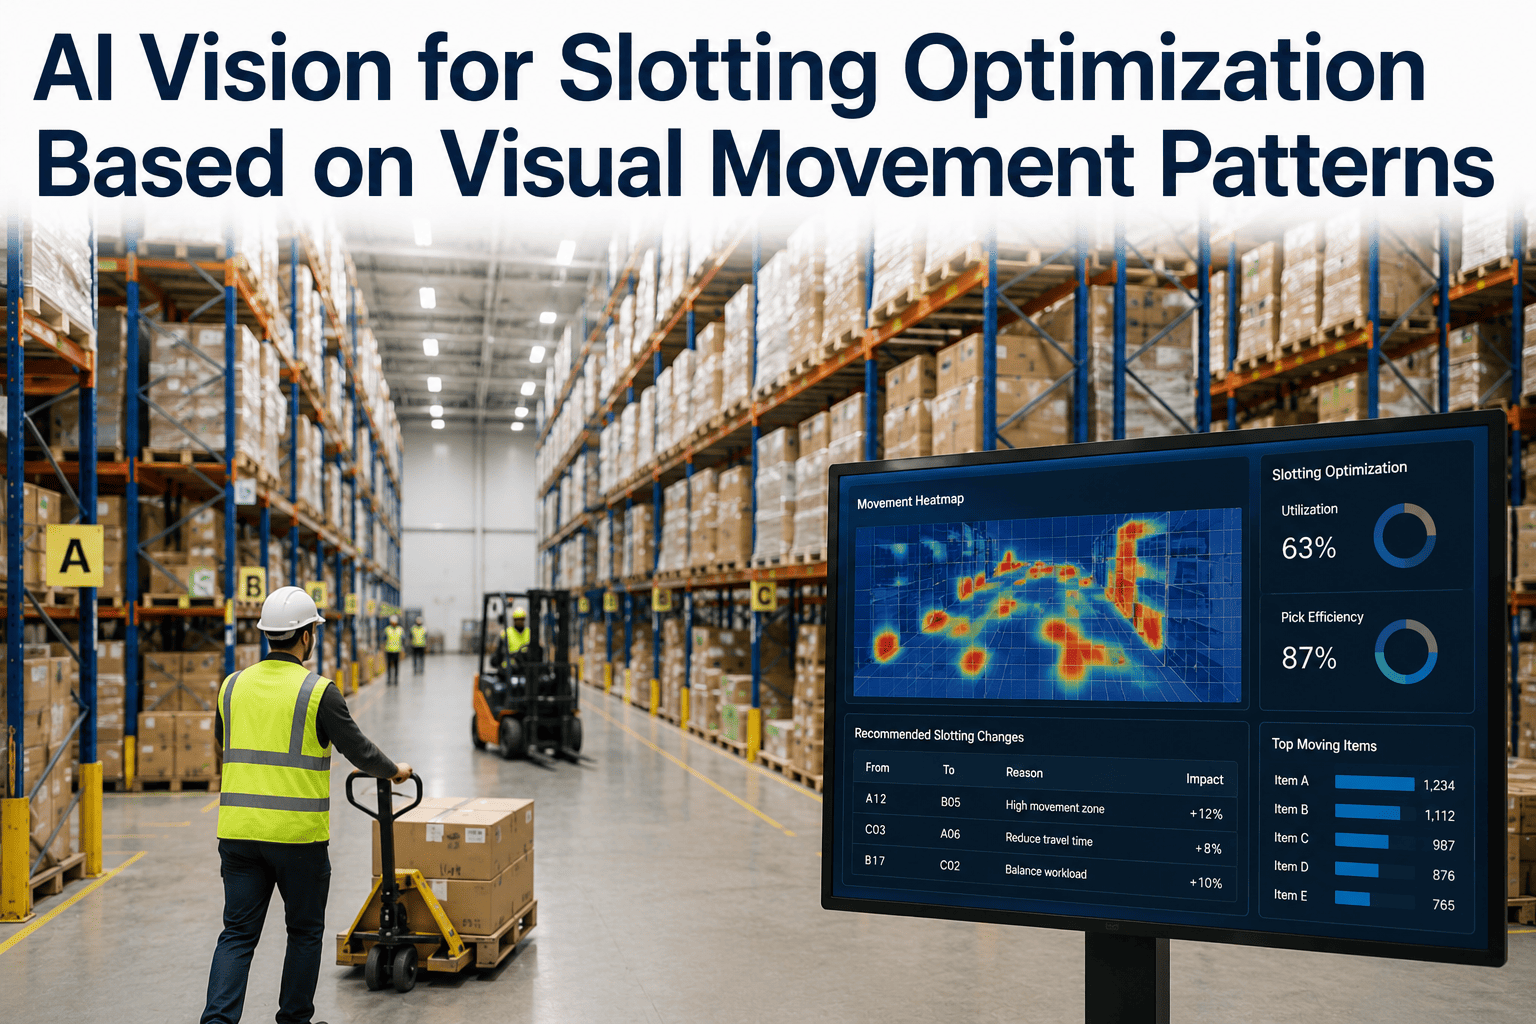
Every slotting decision your warehouse makes today is based on a lie your WMS doesn't know it's telling. Pick-frequency reports show which SKUs were scanned, not which aisles pickers actually walked, which cross-traffic slowed them down, or which "fast-moving" bin sits in a location so awkward that the real cost of picking it never shows up in the data. AI vision closes that gap by watching the floor directly — tracking actual foot traffic, dwell time, and congestion around every storage location, then feeding that visual reality back into your slotting strategy. The result is a layout based on what genuinely happens on your floor, not what a report assumes happened. Book a Demo to see your own aisles ranked by real movement data.
Slot Your Warehouse on What Actually Happens — Not What the WMS Assumes
AI cameras track real picker movement, dwell time, and congestion around every bin, turning your existing footage into a live slotting optimization engine.
Why Pickers Spend 60 to 70 Percent of a Shift Walking, Not Picking
Storage location assignment is one of the single biggest levers over total pick time, yet most slotting decisions still run on historical scan data alone — a record of which SKU was picked and when, with no visibility into how far the picker walked to get there, how many times they crossed another operator's path, or how long they waited for an aisle to clear. A SKU can look like a well-placed fast-mover in the WMS report while sitting in a location that costs your team an extra 40 seconds of walking on every single pick, quietly compounding across thousands of picks a day.
This is the blind spot AI vision was built to close. Cameras already watching your pick aisles can measure the one thing scan data never captures — the physical movement itself. Talk to our engineers about layering movement analytics on top of your existing WMS.
What Your WMS Says vs What the Camera Actually Sees
The core problem with scan-based slotting is that a barcode scan is a single point-in-time event — it tells you a pick happened, not the journey it took to get there. Vision-based movement analytics captures the full physical story, side by side with what your existing system already reports.
Visual Velocity Ranking — How AI Scores Every SKU Location
iFactory combines pick frequency with actual travel and dwell metrics to produce a single velocity-efficiency score per bin — surfacing the mismatches a scan-only report would never reveal. Below is a simplified example of how five real storage locations ranked after a 30-day vision-based movement study.
Bin A-14 — High Velocity, Poor Placement
142 picks/week, but positioned 38 metres from the packing station with a recurring cross-aisle congestion pattern. Highest-priority re-slot candidate — move to a golden zone near dispatch.
Bin C-07 — Frequent Path Crossing
Moderate pick frequency, but sits at a corridor intersection where three separate pick paths cross, creating repeated micro-delays that never register as a formal congestion event.
Bin B-22 — Well Optimised
High velocity, short travel path, minimal dwell time. This is what a well-slotted fast-mover location looks like — used as the calibration benchmark for other high-frequency SKUs.
Bin D-31 — Prime Space, Low Velocity
Occupies a golden-zone eye-level location but generates only 4 picks a week. This slot is holding prime real estate that a genuine fast-mover should occupy instead.
Bin E-09 — High Dwell, Hidden Cost
Pick frequency looks average on paper, but average dwell time per visit is nearly triple the facility norm — operators visibly searching or struggling to access the item.
From Camera Feed to Re-Slotting Recommendation — The iFactory Pipeline
iFactory deploys a turnkey on-prem NVIDIA AI hub — pre-configured hardware and software shipped racked and ready. Rack it, connect power and Ethernet, and movement tracking is live across your pick aisles.
Multi-Object Tracking
Existing RTSP/ONVIF cameras track every picker and pick cart continuously, building a full movement trail per operator per shift.
Bin-Level Dwell Measurement
AI measures how long each picker spends at each storage location — distinguishing a clean pick from a searching, struggling, or blocked pick.
Path Efficiency Scoring
Actual travel path is compared against theoretical shortest path per pick, surfacing which locations generate the most wasted distance.
Velocity-Efficiency Fusion
Vision-based movement data is fused with your WMS pick-frequency records, producing one combined score per SKU location.
Re-Slot Recommendation Engine
Ranked re-slotting priorities are generated automatically, with projected travel-time savings per proposed move.
WMS Sync & Task Dispatch
Approved re-slots push directly into your WMS or SAP EWM as putaway tasks — no manual re-entry, full audit trail retained.
See Which of Your Bins Are Costing You the Most Walking
Send footage from one pick aisle. We'll return a velocity-efficiency ranking and re-slot recommendation within 48 hours — free.
A 90-Day Re-Slotting Project — Vision-Guided vs Scan-Only
Representative outcomes from a mid-size distribution facility that re-slotted its top 200 SKUs using AI vision movement data layered on top of existing WMS pick-frequency records. Figures are directional and vary by facility profile.
| Metric | Before Re-Slot | After 90 Days | Change |
|---|---|---|---|
| Avg travel distance per pick | 58 m | 36 m | -38% |
| Picks per hour per operator | 112 | 158 | +41% |
| Aisle congestion events per shift | 41 | 12 | -71% |
| Prime-zone space misallocated | 22% | 4% | -18 pts |
| Avg dwell time per pick | 9.2 sec | 4.6 sec | -50% |
What Movement-Guided Slotting Returns in the First Year
Labour is typically 40 to 60 percent of warehouse operating cost, and the majority of that labour is walking. A relatively modest travel-time reduction compounds fast across thousands of picks a day.
More Picks Per Hour
Without adding headcount, infrastructure, or square footage — purely from shorter, more direct travel paths.
Space Utilisation Improvement
Reclaiming prime golden-zone locations from low-velocity SKUs and reallocating them to genuine fast-movers.
Fewer Mis-Picks
Reduced congestion and clearer paths lower the error rate that drives returns and re-pick labour.
Typical Payback Window
Deployment and platform cost recovered through labour savings and throughput gains alone.
Live in 6 to 12 Weeks — Continuous, Not a One-Time Study
Traditional slotting projects are periodic exercises — a consultant walks the floor once a year and hands over a spreadsheet that goes stale the moment SKU mix shifts. iFactory runs continuously, so your slotting strategy adapts as demand patterns change.
Pick Aisle Coverage Audit
Camera coverage mapped across pick zones, WMS data export configured, baseline movement study window scheduled. Hardware shipped racked and ready.
Movement Baseline & Fusion Model
30-day movement baseline captured, fused with WMS pick-frequency data, first velocity-efficiency ranking generated for review.
Re-Slot Execution & Continuous Monitoring
Priority re-slots executed, WMS/SAP EWM task sync activated, ongoing movement monitoring live so future slotting decisions stay current.
Purpose-Built for Movement Intelligence — Not a Generic Analytics Bolt-On
Most slotting tools optimise against scan data alone because that's all they have access to. iFactory adds the layer scan data structurally cannot provide — the physical movement itself. Book a Demo to see the difference on your own floor.
Continuous, Not Periodic
Movement data updates every shift, not once a year. Slotting recommendations stay current as SKU velocity and demand patterns shift.
Camera-Agnostic (RTSP / ONVIF)
Works with your existing CCTV network across pick aisles. No RTLS tags, no wearables, no new hardware beyond the edge server.
Fused With Your Existing WMS
Vision data layers on top of pick-frequency records you already trust — this is an enhancement to your current system, not a replacement.
Turnkey On-Prem AI Hub
Pre-configured NVIDIA server ships racked and ready. Cabling, network, WMS integration, and training included in deployment.
Edge-First Processing
Video stays on-site. Only structured metadata syncs to the cloud dashboard, keeping bandwidth cost and data exposure low.
1000+ Clients · 99.9% Uptime
Proven at scale across logistics and manufacturing facilities. 24×7 remote monitoring included as standard.
AI Vision Slotting — Questions Operations Leaders Ask
The most common due-diligence questions from warehouse and logistics leaders evaluating movement-based slotting optimization for the first time.
How is this different from the slotting reports our WMS already generates?
Your WMS report tells you which SKU was scanned and when — a single point-in-time event. It cannot tell you how far the picker walked to reach it, how long they spent searching once they arrived, or how often that aisle was congested at the moment of the pick. AI vision measures the physical journey directly, then fuses that movement data with your existing pick-frequency records to produce a combined score that neither source could generate alone. Talk to our engineers about layering this on top of your current WMS.
Do we need to replace our WMS or slotting software?
No. iFactory is designed to sit alongside your existing WMS, not replace it. Vision-based movement data is fused with the pick-frequency records your WMS already produces, and approved re-slot recommendations are pushed back into your WMS or SAP EWM as standard putaway tasks. Your team keeps working in the system they already know — the vision layer simply makes the underlying data more complete.
How often does the slotting recommendation update?
Unlike a traditional slotting study, which is typically a once- or twice-a-year consulting exercise, iFactory's movement tracking runs continuously. Velocity-efficiency rankings refresh on a rolling basis, meaning seasonal shifts, new SKU introductions, and changing demand patterns are reflected in your slotting recommendations within weeks rather than waiting for the next annual review.
Will re-slotting disrupt ongoing operations?
Re-slot recommendations are prioritised and ranked, so most facilities execute moves in phases during scheduled downtime or low-volume windows rather than as one disruptive overhaul. The highest-impact, lowest-effort moves — like relocating a high-velocity SKU sitting in an awkward location — are typically executed first, delivering measurable travel-time savings before the full re-slotting plan is complete.
What kind of ROI timeline should we expect?
Most facilities see initial travel-time and throughput improvements within the first month after executing priority re-slots, since the highest-impact locations are addressed first. Full documented payback on the platform and deployment cost, accounting for labour savings and throughput gains, typically lands between 6 and 12 months depending on facility size and current slotting maturity. Book a Demo to model payback for your specific pick volume.
Turn Your Existing Cameras Into a Continuous Slotting Engine
Live in 6 to 12 weeks. Fuses with your existing WMS. Continuous re-slot recommendations based on real movement, not once-a-year guesswork.