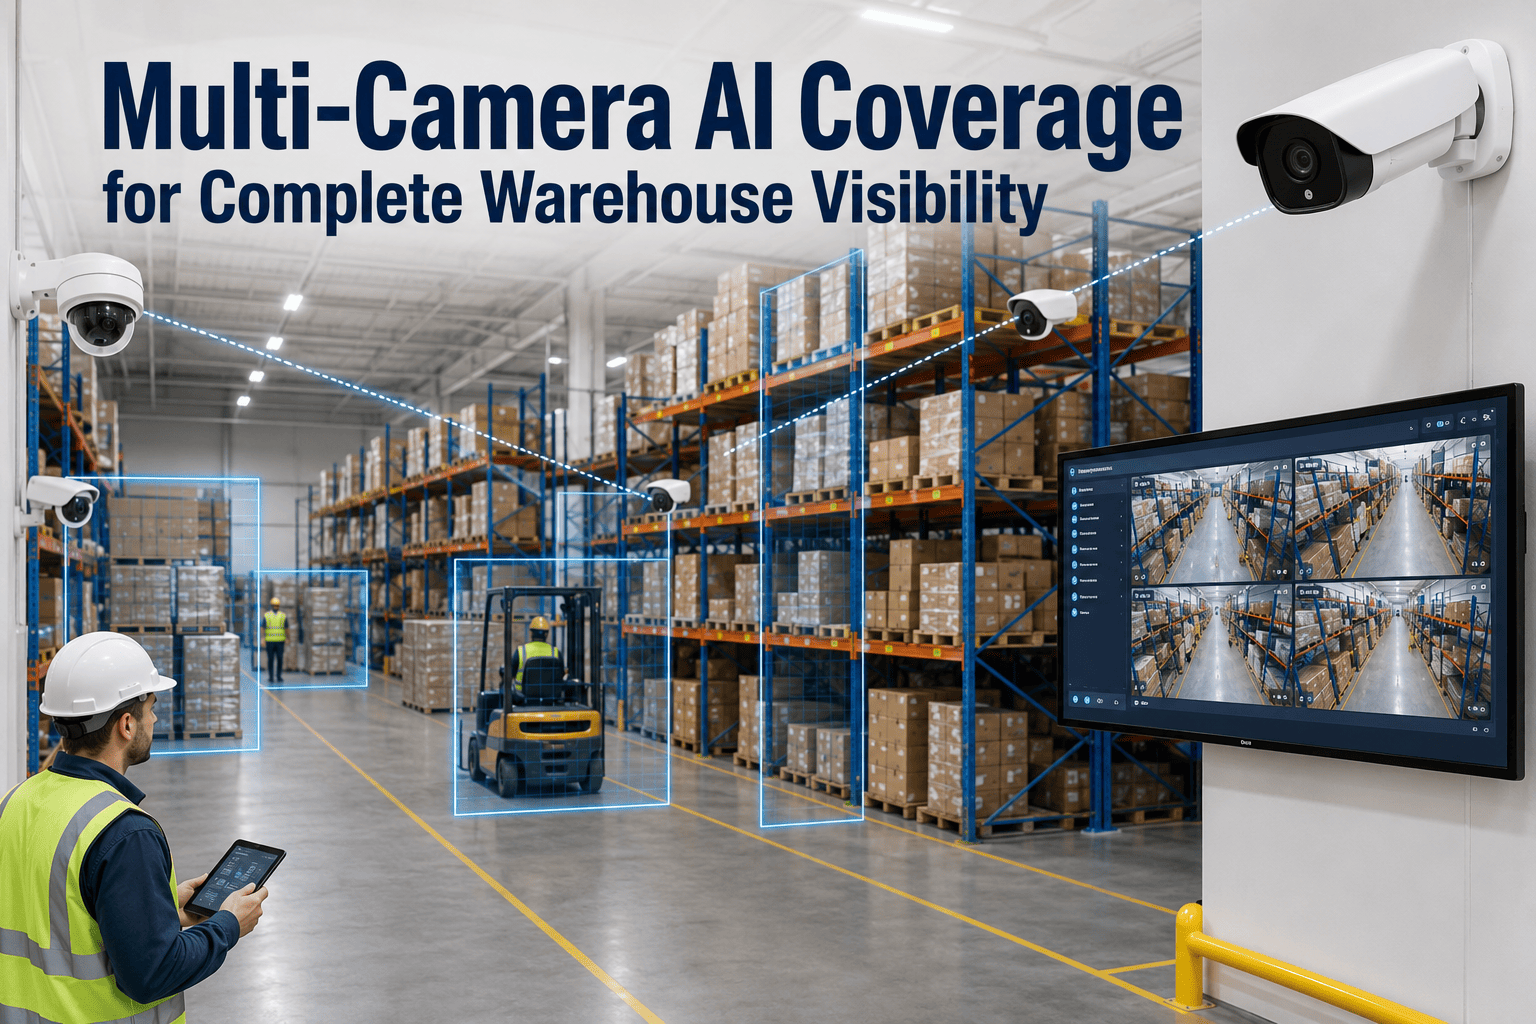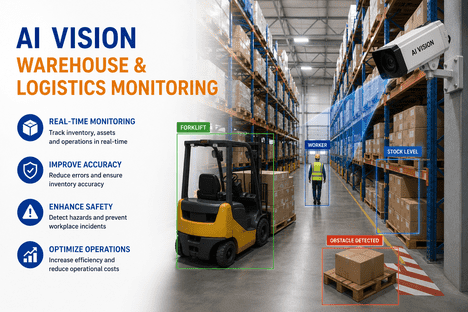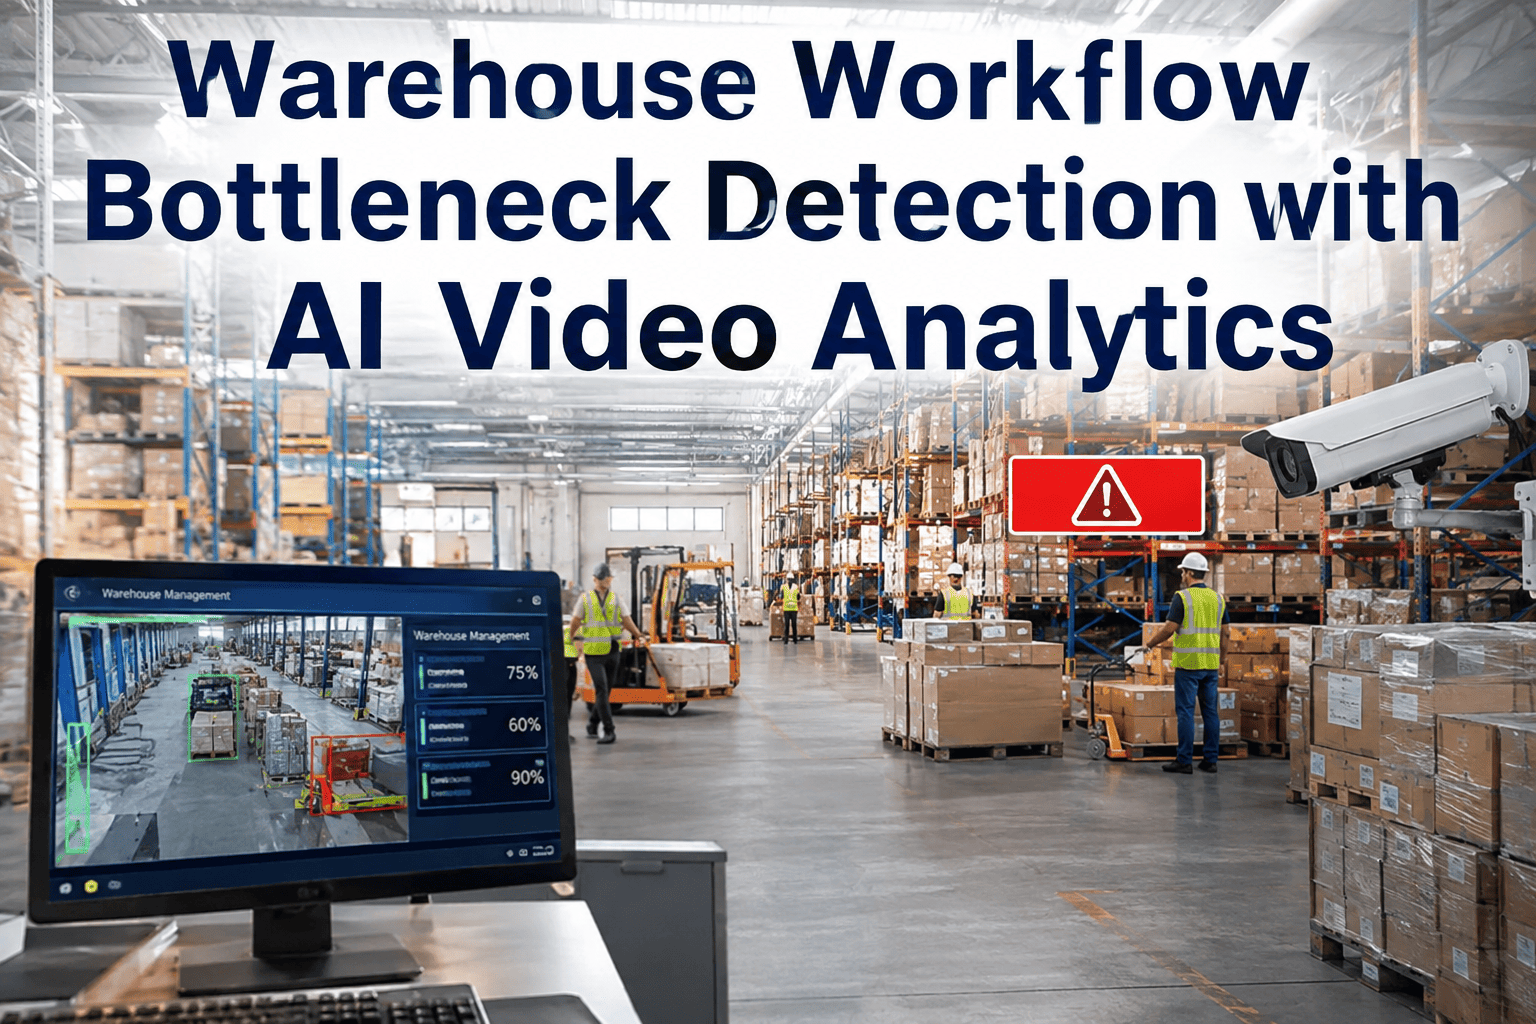
Every warehouse leaks money in the same silent way — pickers walking extra kilometres, forklifts idling at blocked cross-aisles, packing stations starved while receiving is drowning. Traditional WMS dashboards show you WHAT happened; they cannot show you WHERE on the floor it happened, or WHY. AI video analytics closes that visibility gap by turning your existing CCTV cameras into a continuous, quantitative movement-intelligence layer that measures congestion, dwell, idle time, and travel paths across every square metre of your facility. The result — measurable throughput gains without buying a single new conveyor, robot, or square foot of space. Book a Demo to see your warehouse floor mapped as a live bottleneck heatmap in under 30 minutes.
Find the Bottleneck Costing You 30% of Every Pick
See exactly which aisles congest, which zones sit idle, and which travel paths waste labour hours — mapped live from your existing cameras.
Why Your Warehouse Is Slower Than Your WMS Says It Is
Labour typically accounts for 40 to 60 percent of warehouse operating cost, and roughly half of that labour is spent walking — not picking, packing, or adding value. Your Warehouse Management System reports throughput, order accuracy, and lines per hour, but it has no visibility into the physical dead time between scans: the picker waiting for a forklift to clear an aisle, the packer standing idle because staging is empty, the receiver blocked because inbound docks are congested. These invisible losses can consume up to 30 percent of a shift before anyone notices — and no scanner-based system will ever surface them.
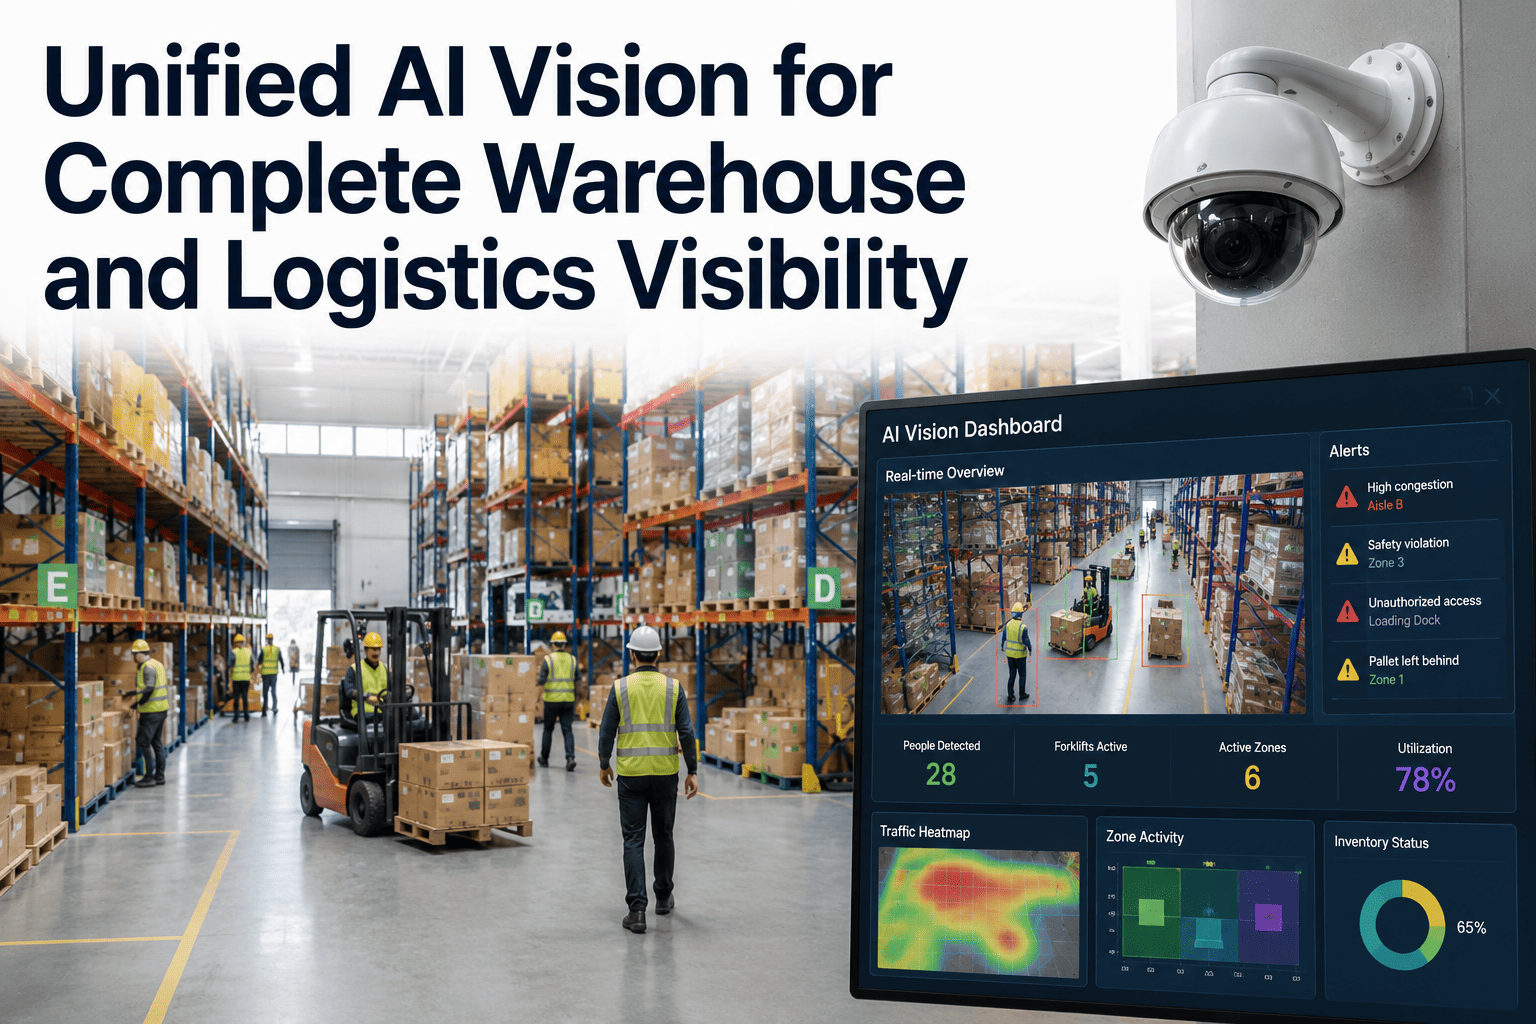
AI video analytics reads the floor differently. Instead of transactional events, it measures movement patterns, dwell times, path efficiency, and zone density every second of every shift — turning your cameras into a continuous industrial-engineering study that never sleeps and never guesses. Talk to our engineers to understand how the pipeline works end-to-end.
Four Movement Patterns That Bleed Throughput — And What AI Sees
Every underperforming warehouse suffers from the same four archetypes of movement waste. Each is invisible to your WMS. Each is instantly visible to a properly trained vision model watching your existing cameras.
01 — Congestion Hotspots
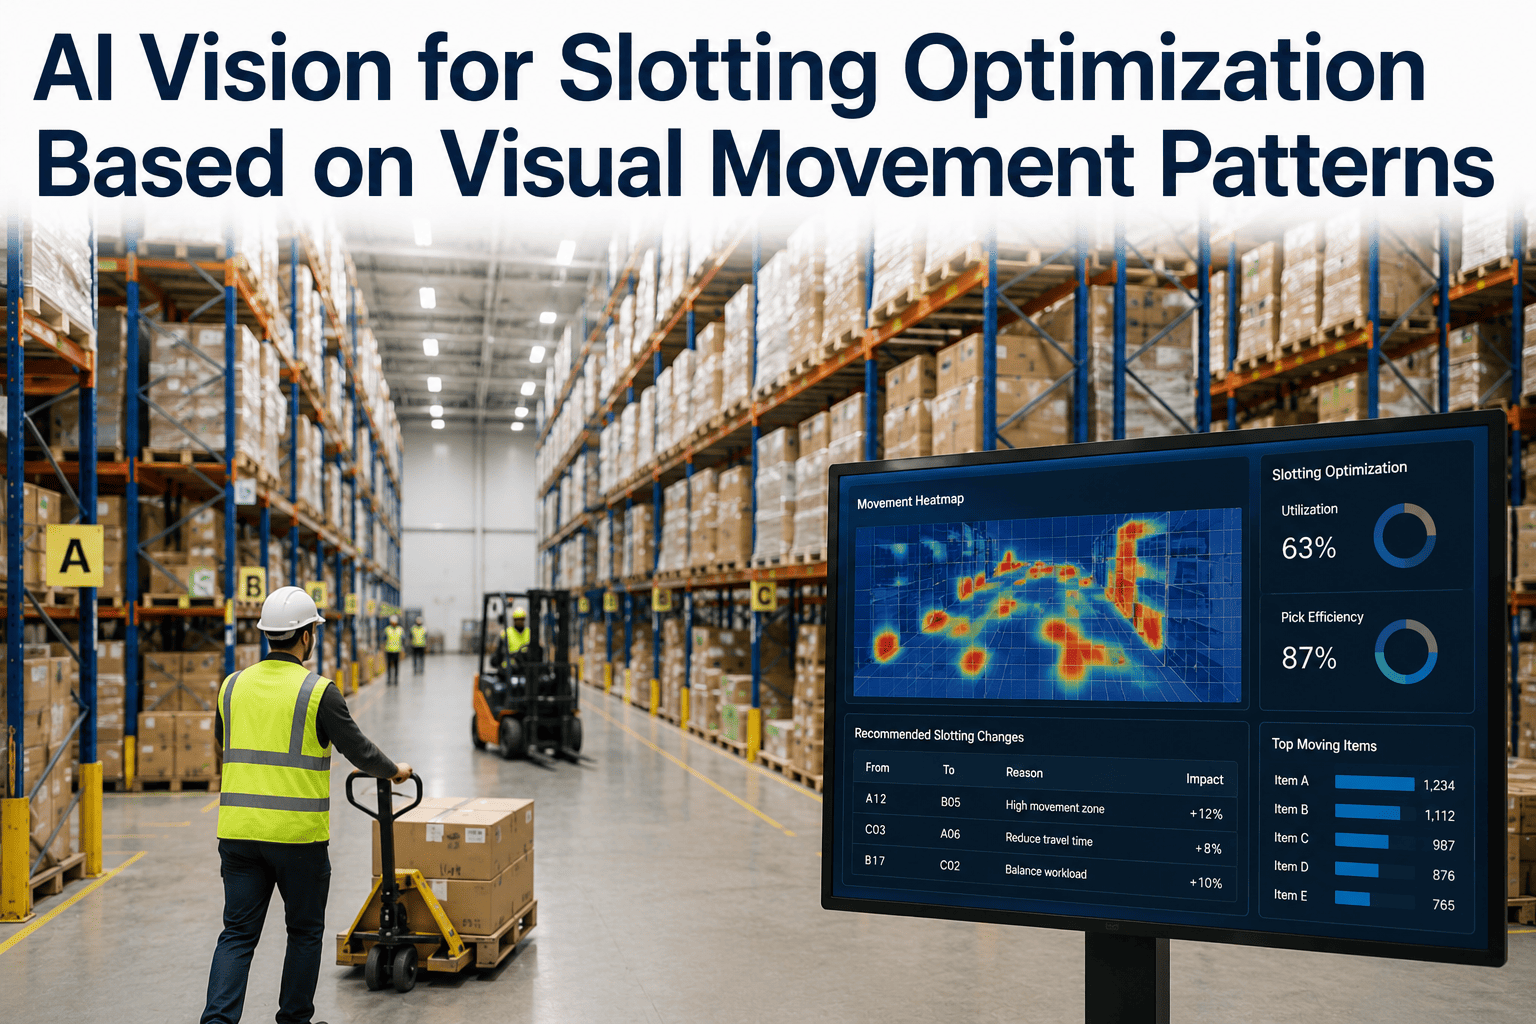
Pinch points where two or more workflows collide: cross-aisles between receiving and pick zones, single-lane forklift corridors, the mouth of packing stations at wave completion. AI counts every person and vehicle passing through, measures dwell time, and produces a density-vs-time heatmap that shows exactly which minute of which shift each choke point saturates. You stop guessing — and start re-slotting or re-scheduling with actual data.
02 — Idle Zones & Dead Aisles
Storage locations that generate zero picker visits for weeks — real estate you paid for that pays nothing back. Vision analytics quantifies visit-frequency per bay per day, cross-referenced with your slotting data, so slow movers stop occupying prime forward-pick real estate. Facilities running this analysis routinely recover 15 to 25 percent of usable floor space without renting a single extra square foot.
03 — Inefficient Travel Paths
The picker who walks a Z-shape instead of a U-shape. The forklift that back-tracks three times a wave. AI reconstructs actual travel paths per operator across the shift, calculates total distance walked versus theoretical optimum, and highlights the top 10 percent of trips where re-batching or re-sequencing would save the most labour. Typical result — 30 to 45 percent reduction in travel distance per pick.
04 — Dock Turnaround Waste
Every extra minute a truck sits at a bay is a minute your dock bandwidth is choked and your carrier is billing detention. Vision analytics measures arrival-to-departure per truck, unloading duration per pallet, and idle windows between vehicles — surfacing which bays underperform, which shift patterns cause queuing, and where scheduling adjustments would eliminate 20 to 40 percent of dock dwell.
What Your Warehouse Looks Like to iFactory AI — A Zone-by-Zone View
Below is a simplified representation of how iFactory maps a live warehouse floor. Each zone reports its own density score, dwell time, and bottleneck classification — colour-coded so operations leaders can prioritise interventions at a glance.
From Camera Frame to Actionable Bottleneck Alert — The iFactory Pipeline
iFactory runs a five-stage vision pipeline entirely on an on-prem NVIDIA AI edge server — hardware plus software bundled and shipped racked-and-ready. Plug in power and Ethernet, connect to your existing RTSP or ONVIF cameras, and the AI is live. No cloud video streaming, no bandwidth surcharge, no data leaving your facility.
Frame Ingestion
Existing CCTV feeds pulled at 15-30 FPS via RTSP or ONVIF. No new cameras required. Multi-site aggregation supported.
Object & Person Detection
Pre-trained warehouse models identify people, forklifts, pallets, and pick carts frame-by-frame with over 95% precision.
Movement & Dwell Analytics
Multi-object tracking builds travel paths, computes zone density, and measures dwell time per person per zone continuously.
Bottleneck Classification
Rule engine plus behavioural model classifies congestion, idle, cross-traffic, and starvation events with severity scores.
Dashboard & Alert Dispatch
Live heatmap, shift reports, and Slack/email/WMS webhooks fire the moment a threshold is breached — with 30-second video clip attached.
Operator Chat Interface
"AI, show me packing station starvation over the last 8 hours." — natural-language query returns instant clip + timeline visualisation.
Live in 6 to 12 Weeks — Not 12 to 18 Months
iFactory ships a pre-configured NVIDIA AI server, racked and ready. Our team handles cabling, network setup, camera integration, PLC or WMS handshake, operator training, and 24×7 remote monitoring for the first 90 days. You focus on operations — we focus on the AI stack.
Phase 1 — Site Survey & Camera Audit
Camera coverage map, blind-spot analysis, network readiness check, WMS integration scoping. Hardware shipped racked and pre-configured.
Phase 2 — Deployment & Calibration
Edge server installed, RTSP feeds connected, zone boundaries drawn, baseline movement patterns learned. Pilot dashboard live for ops team review.
Phase 3 — Optimisation & Handover
Alert thresholds tuned to your shift patterns, operator training completed, WMS webhooks fired end-to-end, KPI baselines locked. 24×7 remote monitoring active.
See Your Own Floor Mapped as a Bottleneck Heatmap
Send us one hour of camera footage from your busiest aisle. We'll return a full congestion, dwell, and travel-path analysis inside 48 hours — free.
A 200,000 sq ft Fulfilment Centre — Before and After iFactory Vision
A representative 200,000 sq ft e-commerce fulfilment operation with 180 pickers, 24 dock doors, and 45,000 SKUs. Baseline captured over 30 days pre-deployment; post-deployment measured 90 days after go-live. Numbers are directional and vary by facility profile.
| Metric | Before | After 90 Days | Delta |
|---|---|---|---|
| Picks per hour per operator | 108 | 162 | +50% |
| Avg travel distance per pick | 62 m | 38 m | -39% |
| Congestion events per shift | 47 | 9 | -81% |
| Dock turnaround (avg) | 52 min | 31 min | -40% |
| Dead-zone storage recovered | 0 sq ft | 34,000 sq ft | 17% floor |
| Labour cost per line shipped | $0.84 | $0.56 | -33% |
| Order accuracy (audit) | 98.4% | 99.6% | +1.2 pts |
The Financial Case — What Bottleneck Detection Returns in Year One
A modest 15% labour productivity gain in a 180-picker facility recovers roughly $1.4M annually. Add recovered floor space, dock TAT savings, and detention-fee elimination, and payback typically arrives inside the second quarter of deployment.
Labour Recovered / Year
A 15% productivity lift on a 180-picker floor at $22/hr fully loaded — money that was being walked off, not shipped.
Dead Zones Reclaimed
Storage locations reallocated to fast-movers or overflow — deferring or eliminating expansion capex worth $2M+.
Dock TAT Reduction
Faster truck turnaround eliminates detention fees, releases dock bandwidth for higher throughput, and improves carrier relations.
Typical Payback Window
Hardware + software + deployment recovered in under two quarters. Every quarter after is compounding operating margin.
What Makes iFactory Different From Generic Camera Analytics
The warehouse video analytics market is crowded. Most platforms are either safety-only (PPE detection, forklift proximity) or offer generic person-detection dashboards that never translate into operational action. iFactory is purpose-built for workflow optimisation — with pre-trained warehouse models, native WMS integration, and a turnkey on-prem AI hub that ships ready to run. Book a Demo to see the difference on your own floor.
Turnkey Hardware + Software Bundle
Pre-configured NVIDIA AI server ships racked and ready. Rack it, plug power and Ethernet, AI is live. No separate procurement, no server sizing debates, no integration weeks.
Pre-Trained on Warehouse Movement
Millions of warehouse frames — pickers, forklifts, pallets, cross-aisle traffic — baked in. Zero custom labelling required. Zero-shot deployment for standard fulfilment layouts.
Camera-Agnostic (RTSP / ONVIF)
Works with your existing CCTV infrastructure. No forklift IoT sensors, no wearable trackers, no camera swap-out. Preserves prior capex; accelerates go-live.
Native WMS & SAP Integration
Bidirectional API into SAP EWM, Manhattan, Blue Yonder, Oracle WMS, and custom systems. Detections become tasks; task completion updates the AI dashboard.
Edge-First, On-Prem Processing
Video never leaves your facility. Only structured metadata is synced. Bandwidth cost drops 90%+ vs cloud analytics; data sovereignty preserved.
1000+ Clients · 99.9% Uptime
Proven at scale across manufacturing and logistics. 24×7 remote monitoring included. Enterprise SLAs backed by dedicated success engineering.
Where Warehouse Vision Analytics Delivers the Fastest Wins
Five operational scenarios where iFactory's bottleneck detection generates measurable ROI within the first quarter of deployment.
E-commerce Peak Season Planning
Before peak, run baseline vs projected volume simulations using historical movement data. Pre-identify choke points that will fail at 2× volume — before Black Friday, not after. Reslot, restaff, or restructure waves with hard evidence.
3PL Client Onboarding & Layout Design
New client with a different SKU profile? Model their volume against your existing floor, identify where their flows will collide with existing clients, design the physical zone allocation with vision-validated data instead of gut feel.
Cold Chain & Pharma Compliance
Track dwell time in temperature-controlled zones, evidence that no pallet sat outside the cold chain longer than permitted, and generate immutable timestamped audit trails for regulatory inspection.
Automotive & Manufacturing Warehousing
Line-side kitting operations where a 30-second late kit delivery stops the production line. Vision detects the upstream bottleneck the moment it forms — 8 minutes before the WMS would have noticed the missed pick.
Multi-Site Benchmarking
Operating 5 or 50 facilities? A single cloud dashboard ranks every site on picks-per-hour, congestion index, dock TAT, and dead-zone percentage — surfacing which site to prioritise for the next intervention.
Warehouse AI Video Analytics — Questions Operations Leaders Ask
The most common due-diligence questions we hear from VP-Operations and Head-of-Logistics leaders evaluating vision analytics for the first time.
Will we need to replace our existing CCTV cameras?
No. iFactory works with any camera that supports the standard RTSP or ONVIF protocol — which covers effectively every IP camera installed in the last 10 to 15 years. Our edge server connects directly to your existing video management system or camera network, ingests the streams, and runs analytics locally. Facilities typically achieve full coverage without buying a single new lens, and camera-swap projects that were quoted at $200K+ get replaced with a zero-hardware go-live. If you already have coverage of pick aisles, docks, packing, and staging, you are 90% of the way there. Talk to our engineers for a coverage audit.
How does iFactory handle worker privacy and GDPR compliance?
All processing happens on-premise on your NVIDIA edge server — no raw video ever leaves your facility. iFactory operates on aggregate movement patterns, dwell metrics, and zone density; it does not perform facial recognition, individual identification, or biometric analysis. Optional silhouette-only or anonymisation-blur modes are available for jurisdictions with the strictest worker-privacy regulations. Only structured metadata (event type, timestamp, zone ID, count) is synced to the cloud dashboard, satisfying GDPR, CCPA, and works-council requirements globally.
How does the AI integrate with our existing WMS or SAP EWM?
iFactory ships with native connectors for SAP EWM, Manhattan Active WM, Blue Yonder, Oracle WMS, HighJump, and any WMS exposing a REST API. Bidirectional integration means AI-detected bottlenecks automatically create WMS tasks or alerts, and WMS completion events flow back to close the loop and improve model tuning. For custom or legacy systems, we build a lightweight middleware adapter as part of Phase 2 deployment. Integration is included in the standard implementation — no separate license or add-on module. Book a Demo to see live SAP EWM integration.
What happens if our internet connection drops?
The AI keeps running — every detection, dwell measurement, and bottleneck alert continues locally on the edge server without interruption. When connectivity returns, queued metadata syncs to the cloud dashboard automatically. For customers in high-security or air-gapped environments, iFactory supports fully on-premise deployment with zero cloud connectivity — a purely local dashboard, local alerts, and local reporting. Warehouse operations do not stop because your WAN link did, and neither does your visibility.
How long until we see measurable ROI from bottleneck detection?
Most customers see first-value inside 2 to 3 weeks of go-live: identified congestion events, quantified dead zones, and initial slotting or wave-scheduling recommendations. Measurable operational KPI improvement — picks per hour, dock TAT, labour cost per line — typically shows in month 2. Full documented payback on the platform investment lands in month 4 to 6 for standard fulfilment operations. Facilities with acute congestion problems or heavy dock detention exposure often recover the entire year-one cost inside the first quarter.
Turn Your Existing Cameras Into a Bottleneck-Killing Intelligence Layer
Live in 6 to 12 weeks. Zero new hardware required beyond one edge server. Payback in under two quarters. Talk to our team about a free camera-coverage audit and pilot scope for your facility.