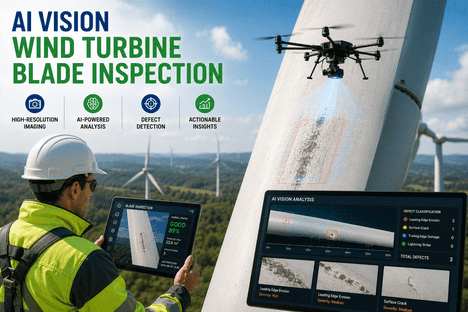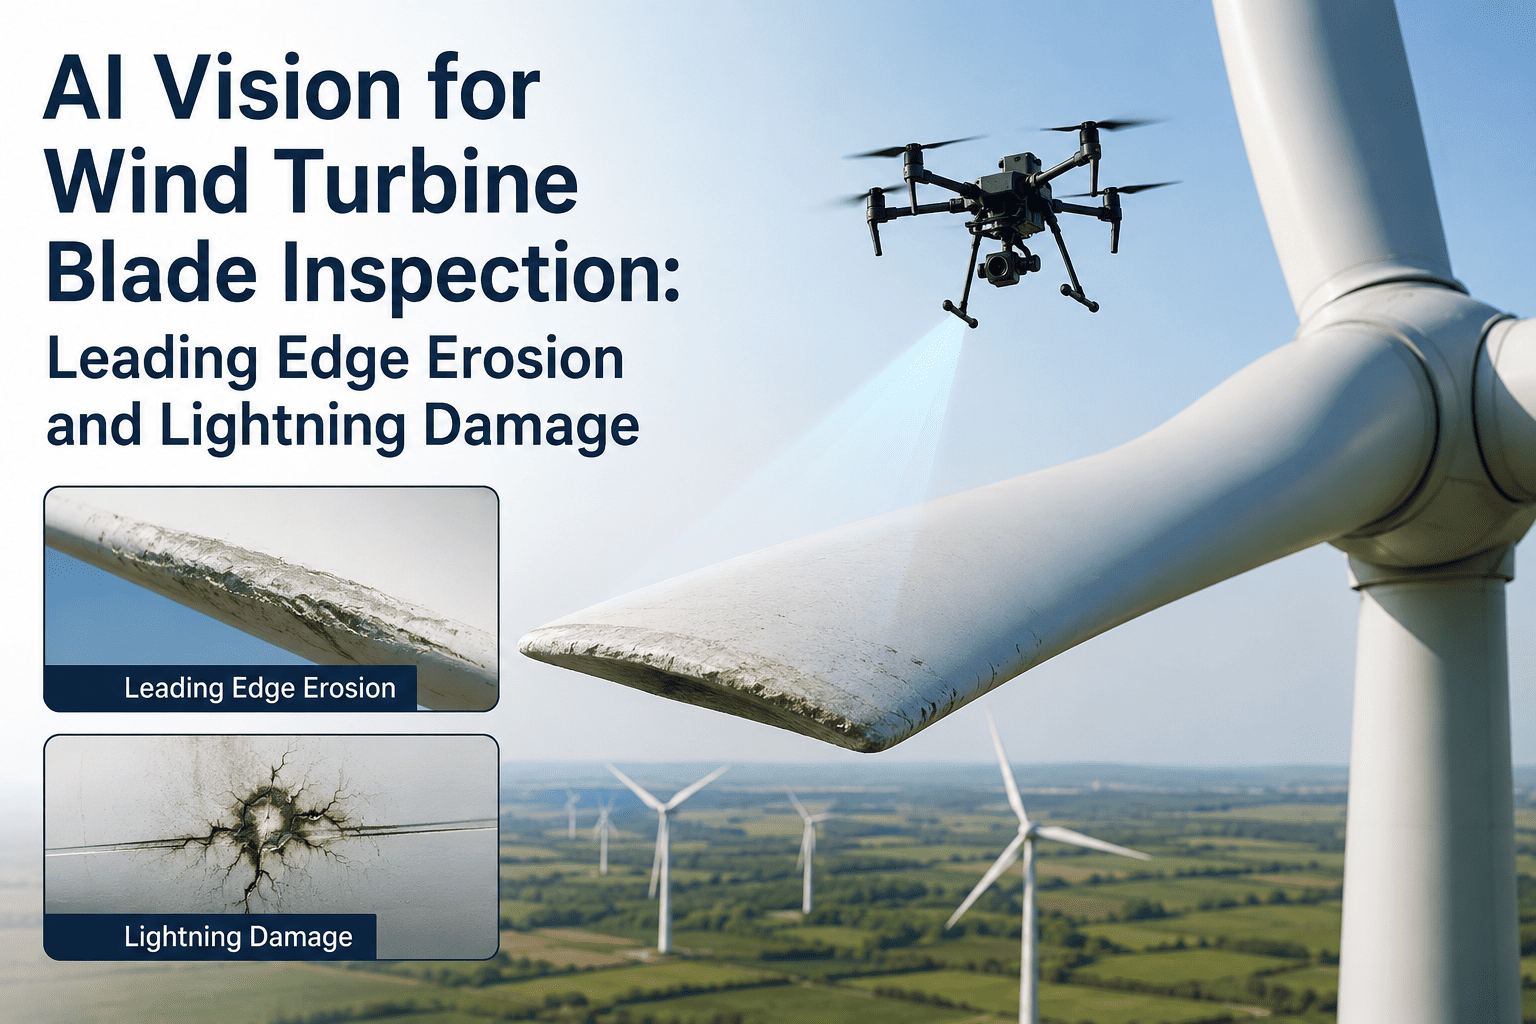
A single eroded blade leading edge can cut a turbine's annual energy production by up to 8 percent, and most operators do not find out until the SCADA data has already reflected months of quiet underperformance. Rope access teams and crane mobilizations that once took a wind farm out of service for weeks are now being replaced by drone-mounted AI vision systems that scan every blade surface, flag erosion and lightning damage automatically, and hand the process engineer a prioritized repair list before the next inspection window even closes. For a maintenance team managing dozens or hundreds of turbines, that shift changes blade inspection from an annual guessing game into a running record every engineer can trust — talk to support about what that looks like on your fleet.
Your Blades Are Losing Power Right Now — And Nobody Is Watching
AI-driven drone inspection reads leading edge erosion, lightning strike damage, and delamination across an entire wind farm in days, not weeks — with no crane, no blade shutdown for climbing, and no waiting for a technician's notes to become a work order.
What an Unseen Leading Edge Erodes Besides the Blade
Erosion Does Not Announce Itself — It Accumulates
A blade tip can travel faster than 90 meters per second at the outboard section, which means every raindrop, hailstone, and grain of sand it meets during a storm strikes with real force. That repeated impact strips the leading edge coating first, then pits the underlying laminate, and eventually opens a path for moisture to work its way into the composite structure. Research using infrared imaging and SCADA data has traced this same progression to a measurable drop in laminar airflow across the blade surface — commonly a reduction of 85 percent or more in the laminar flow region on both the pressure and suction sides once erosion sets in. That is not a cosmetic issue. It is the aerodynamic reason a turbine with visibly fine-looking blades can still be quietly underperforming its rated output. Because the effect is aerodynamic rather than structural in its early stages, it does not trip a fault alarm or trigger a shutdown — the turbine keeps running, keeps reporting normal status, and keeps generating less power than it should, month after month, until someone happens to compare its output curve against a sister turbine on the same site.
Not Every Blade Erodes the Same Way — and That Matters for Where You Look
Erosion is not spread evenly across a blade, and it is not spread evenly across a rotor either. The outboard third of the blade — roughly the last 30 percent of the span, closest to the tip — takes the brunt of the damage because tip speed at that section can exceed 90 meters per second, multiplying the force of every raindrop and hailstone strike compared to the slower-moving root section. On a three-blade rotor, the blade that leads into the prevailing wind direction during the worst storm events often shows measurably more leading edge wear than its counterparts, simply because of how weather systems track across a site over a turbine's operating life. A manual inspection crew working from the ground or a single rope descent has no reliable way to account for this variation — they inspect what the schedule allows, not what the wear pattern actually demands. An AI vision system trained on span-position data can weight its attention toward the outboard leading edge automatically, catching Stage 1 and Stage 2 erosion in exactly the zone where it starts, rather than treating every square meter of blade surface as equally likely to show damage.
This span-aware approach also changes how a maintenance team reads results across a wind farm. Instead of a flat list of "damaged" and "not damaged" turbines, the data can show whether a specific site orientation, elevation, or storm exposure pattern is driving faster wear at some turbines than others — turning inspection data into an input for future site layout and blade coating decisions, not just a maintenance checklist.
Lightning damage follows its own separate pattern, tied to the lightning protection system's receptor placement rather than to tip speed. A vision model that has been trained on the blade's receptor locations can distinguish an expected, contained strike exit point from a strike that has bypassed the protection system and burned into the laminate — a distinction that matters enormously for repair urgency but is easy for a fatigued inspector to miss when reviewing hundreds of photos from a single flight.
See the Damage Before It Becomes a Blade Replacement
AI vision flags Stage 1 and Stage 2 erosion during routine drone flights, while repair is still a tape or coating job instead of a $200,000 blade swap.
Rope Access and Crane Inspection vs AI-Guided Drone Vision
Four Damage Types, Read the Same Way Every Time
What Happens Between the Drone Landing and the Repair Getting Scheduled
The value of AI vision on a wind farm is not just the scan — it is what happens to the images in the minutes and hours after the drone lands. A stack of a few thousand high-resolution photos is not useful to a maintenance planner on its own; it becomes useful once every image has been scored, tagged to a specific blade and span position, and ranked by urgency against the rest of the fleet. This is the step where most wind farms still lose the most time — a manual reporting process where a technician reviews photos on a laptop, writes up findings in a spreadsheet, and forwards that spreadsheet to a planner who then re-keys it into whatever maintenance system the site actually runs on. Each handoff adds a day or more, and each manual transcription adds a chance for a finding to get miscategorized or simply missed.
Why Operators Are Moving Inspection Budget Toward AI Vision
A modest proactive inspection catches erosion and lightning damage early enough to avoid the $300,000 to $700,000 typically lost on an onshore blade replacement event, and complex offshore cases can run past $1 million. Set against a drone-based AI inspection cost that generally lands in the low thousands per turbine, the economics are not subtle — one avoided blade replacement can fund years of fleet-wide inspection on its own. The wind turbine drone inspection market itself reflects how fast this shift is happening, with the U.S. segment alone projected to exceed $478 million in 2025 while growing at roughly a 14 percent compound annual rate, as more operators move away from rope access as a default.
The comparison gets more favorable the larger the fleet gets. A single-turbine site can justify either approach without the economics mattering too much, but an operator running 50, 100, or 200+ turbines across multiple sites feels the compounding effect of every avoided crane mobilization, every week of downtime that did not happen, and every blade caught at Stage 1 instead of Stage 4. Inspection frequency itself becomes a lever rather than a fixed annual cost — a site in a hail-prone corridor can justify quarterly scans at a cost that would have been unthinkable under a rope-access pricing model, simply because the AI-guided flight cost per turbine sits so far below the manual alternative.
| Cost Driver | Rope or Crane Inspection | AI-Guided Drone Inspection |
|---|---|---|
| Cost per turbine | $2,000–$3,000 typical, before crane mobilization | Several hundred to a few thousand dollars depending on sensor package |
| Downtime during inspection | Often a full shutdown for the inspection window | Minimal — most passes do not require a full stop |
| Time per turbine | Several hours to a full day with rope crews | Under 4 hours for a complete blade scan |
| Consistency across inspections | Varies by technician and weather conditions | Same trained model applied to every image, every time |
| Time to actionable work order | Days, after manual report writing | Same day the flight data is processed |
What Wind Farm Operators Ask Before Switching to AI Blade Inspection
Put Every Blade on a Schedule an AI Model Actually Watches
From flight to flagged defect to work order, without the weeks of downtime a crane-based inspection used to cost your fleet.