Every AI vision proposal that gets rejected by finance has the same flaw — it leads with the technology instead of the money. A capital committee does not approve cameras and software; it approves a number that pays itself back on a timeline they can defend to their own leadership. Building that number is not guesswork. It is four inputs, a formula, and the discipline to source real figures from your own plant instead of a vendor's slide deck — book a demo and we will build the model with your actual numbers live on the call.
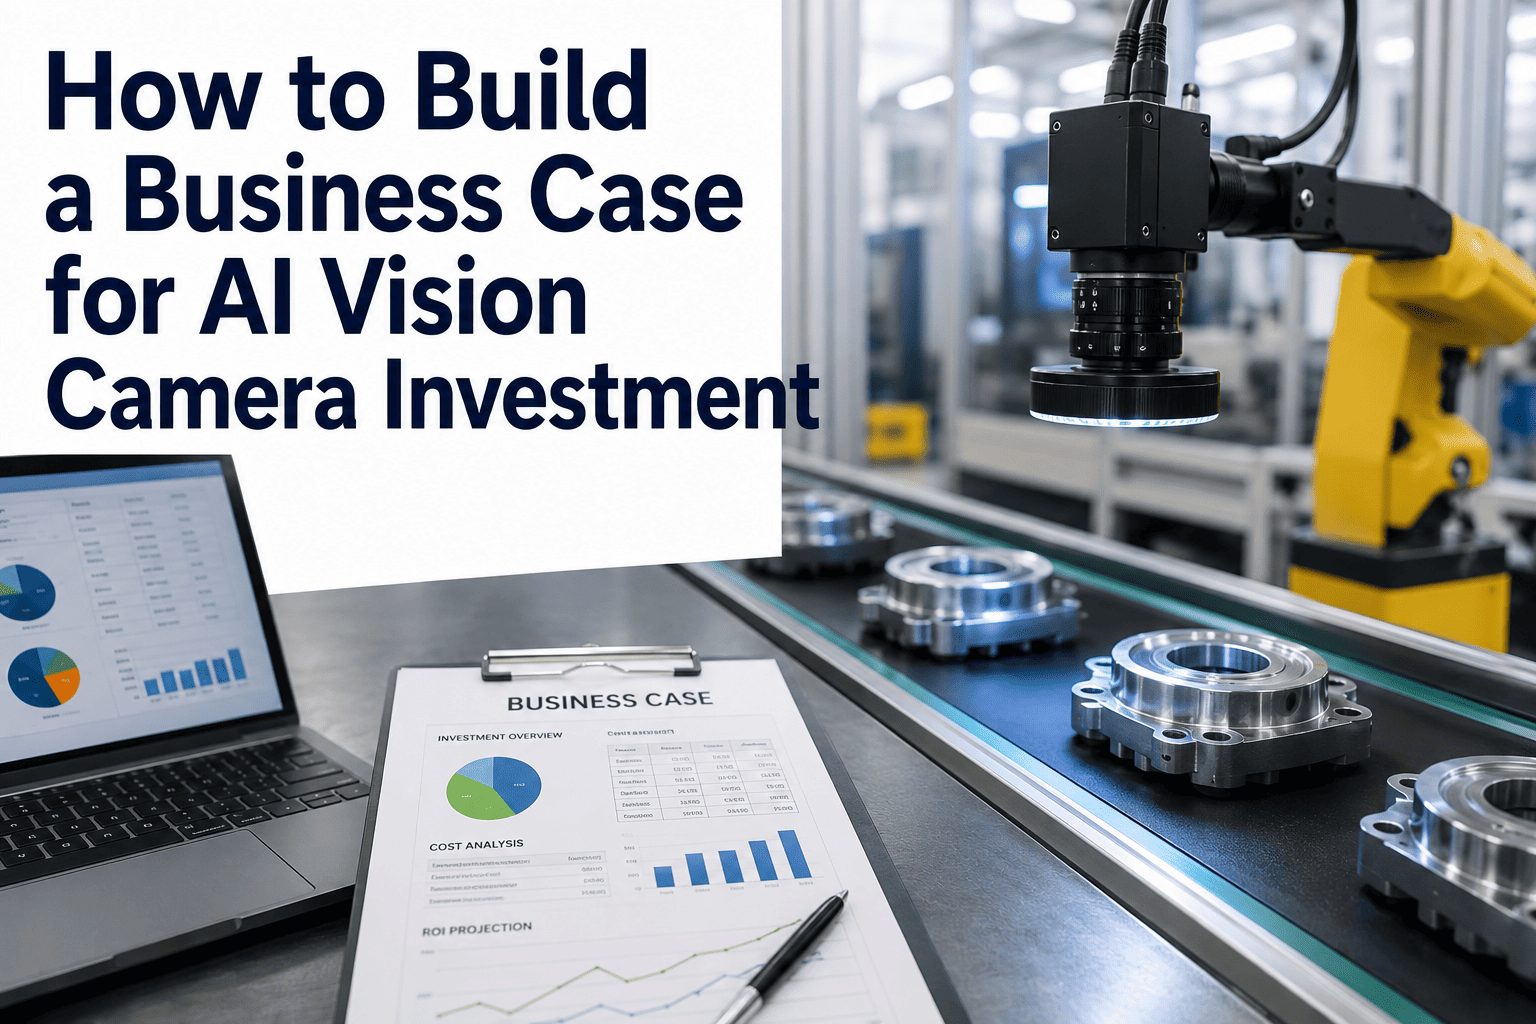
How to Build a Business Case for AI Vision Camera Investment
Quantify current costs — scrap, rework, recalls, inspection labor, and safety incidents — then project savings with industry benchmarks and a defensible payback timeline your finance team will actually approve.
The Cost You're Already Paying — You Just Can't See It Yet
Most manufacturers carry a cost of poor quality, or COPQ, averaging roughly 20 percent of total revenue — scrap, rework, warranty claims, recalls, and inspection overhead that never shows up as a single line item on any P&L. It hides inside dozens of accounts instead of one, which is exactly why it survives budget review after budget review unchallenged.
For a plant generating $10 million a year, that 20 percent baseline is roughly $2 million in addressable cost sitting in the walls of the business before any AI intervention is even proposed. That number is the starting point of every credible business case — not the AI vision cost, the cost of not having it.
Line Up the Five Costs a Business Case Has to Quantify
A proposal that says "improves quality" gets sent back for more detail. A proposal that itemizes five specific cost categories, each with a number pulled from your own operations data, gets a decision. These are the categories finance teams expect to see broken out individually.
Scrap and Rework
Defect rate multiplied by unit cost multiplied by annual volume. A 2% defect rate on 500,000 parts at $2 per part is $20,000 in raw scrap alone before rework labor is added.
Warranty and Recalls
Defects that escape the line cost far more downstream than they would have on the floor — a part caught three assembly stages later carries the cost of every stage it passed through.
Manual Inspection Labor
Fully loaded inspector cost typically runs $38,000 to $52,000 per head across three shifts. Multiply by headcount dedicated to visual inspection across every affected station.
Throughput Lost to Inspection
Manual inspection bottlenecks cap line speed. Quantify the production volume a station could run if inspection were no longer the rate-limiting step.
Safety Incident Exposure
Vision systems covering PPE compliance and hazard detection carry a cost-avoidance value tied to incident rates, insurance premiums, and OSHA reporting exposure.
Apply the Four Inputs That Drive the ROI Formula
Once the baseline costs are itemized, the projection itself comes down to four inputs. Accuracy in the business case lives in these four numbers, not in the formula — the formula is simple arithmetic once the inputs are real.
Camera or Station Count
How many of your highest-defect lines get covered. More stations capture more addressable cost but add proportional capital expense.
Defect Reduction Percentage
The single biggest lever in the model. A conservative 30 to 40 percent reduction is typical once a model is tuned against your actual parts.
Cost of Poor Quality
Roughly 20 percent of revenue on average — this is the addressable pool that a defect reduction percentage gets applied against.
Inspection Labor Redeployed
Headcount freed from manual visual inspection and redirected to higher-value work, valued at fully loaded cost per head.
What the Math Looks Like on a Real Line
Here is the calculation applied to a mid-size line with a clear defect profile and one dedicated inspection headcount, using the conservative end of industry benchmarks rather than best-case figures.
At roughly $50,000 in typical CapEx against $390,000 in annual return, this example lands well inside the 7 to 8 month average payback documented across validated AI vision deployments — and pushing defect reduction to 35 percent or adding coverage on additional high-defect lines compresses that timeline further. Book a demo and iFactory will build this exact model against your real defect profile and production volume.
What Finance Teams Actually Want to See Cited
Citing external, independently documented figures alongside your own plant's calculated numbers gives a capital committee two forms of evidence instead of one — a specific number for your line, and a broader body of results showing that number is achievable rather than optimistic.
Skip the Spreadsheet — Build the Real Model on a Call
iFactory will build your ROI model using your actual defect profile, production volume, and inspection labor costs — then show you the exact payback timeline before you commit a dollar of budget.
Present the Case in the Order a Capital Committee Reads It
The strongest business cases are not the ones with the most detail — they are the ones structured the way a reviewer's attention actually moves through a document. Lead with the cost of inaction, not the cost of the solution.
Current State Cost
Open with the addressable COPQ figure, broken into scrap, rework, warranty, and labor — the number the business is already absorbing today.
Projected Reduction
Apply a conservative defect reduction percentage against that baseline, citing industry benchmarks rather than vendor-supplied best-case numbers.
Investment Required
State the CapEx clearly, including hardware, software, and any integration cost — a number presented after the return lands very differently than one presented first.
Payback Timeline
Close with a specific month count, not a range padded for safety — specificity signals that the model was built on real numbers, not hope.
Frequently Asked Questions About Building an AI Vision Business Case
Get a Business Case You Can Defend in the Room
Bring your production volume and defect data to a call, and iFactory will build a complete ROI model with a specific payback timeline — ready to present to your capital committee.