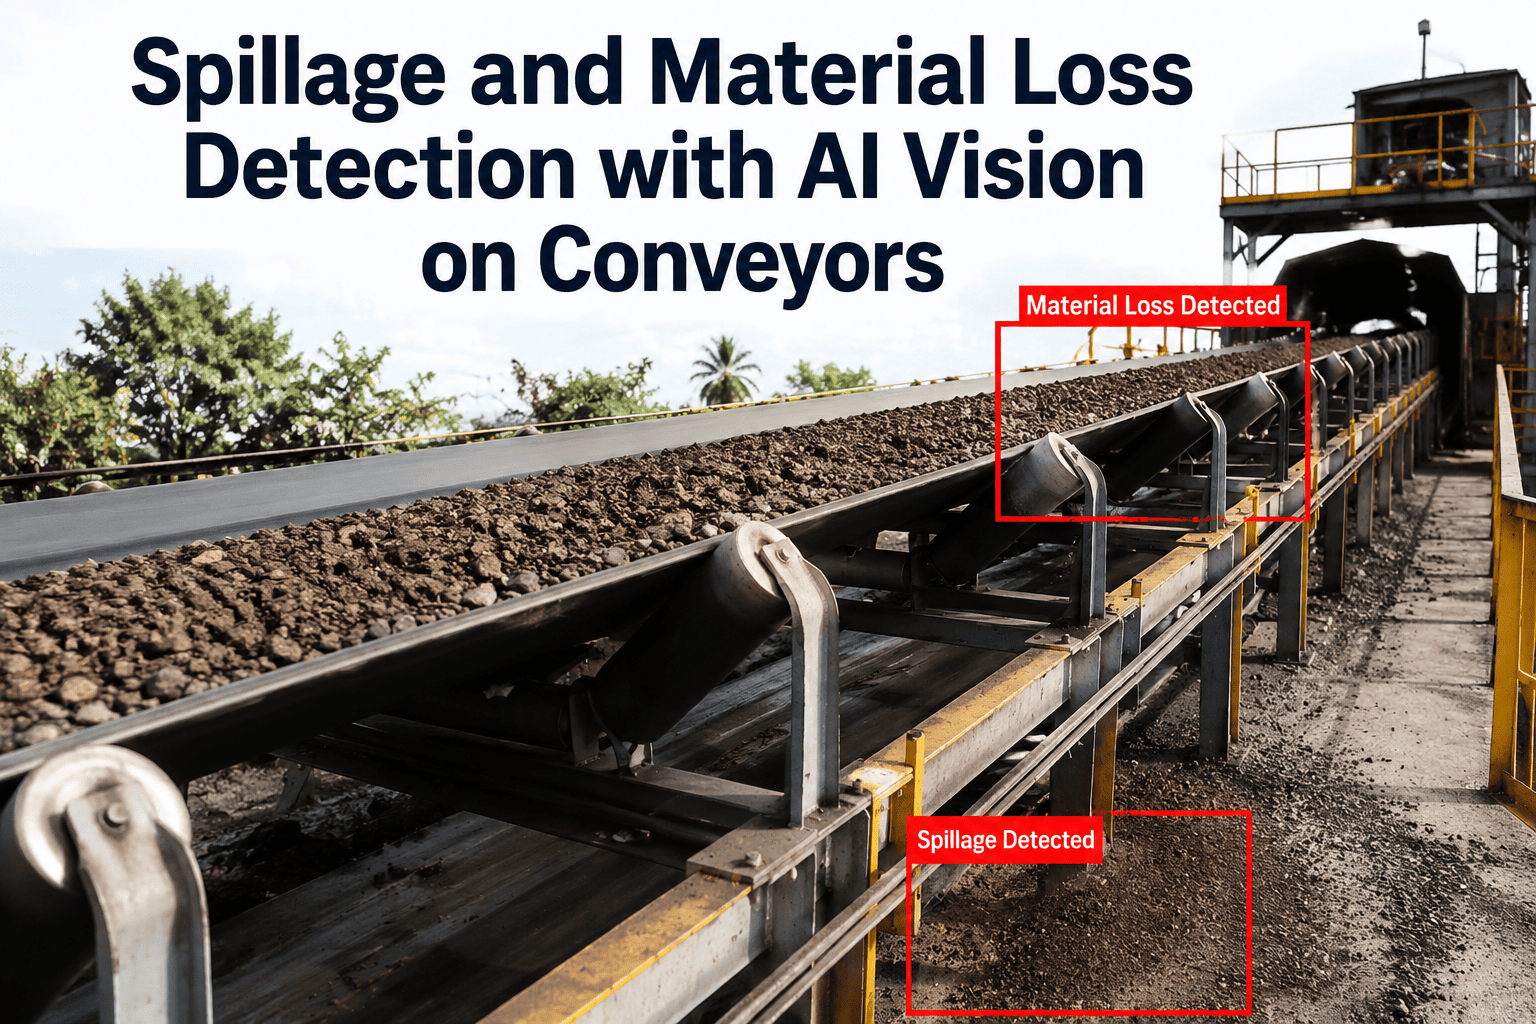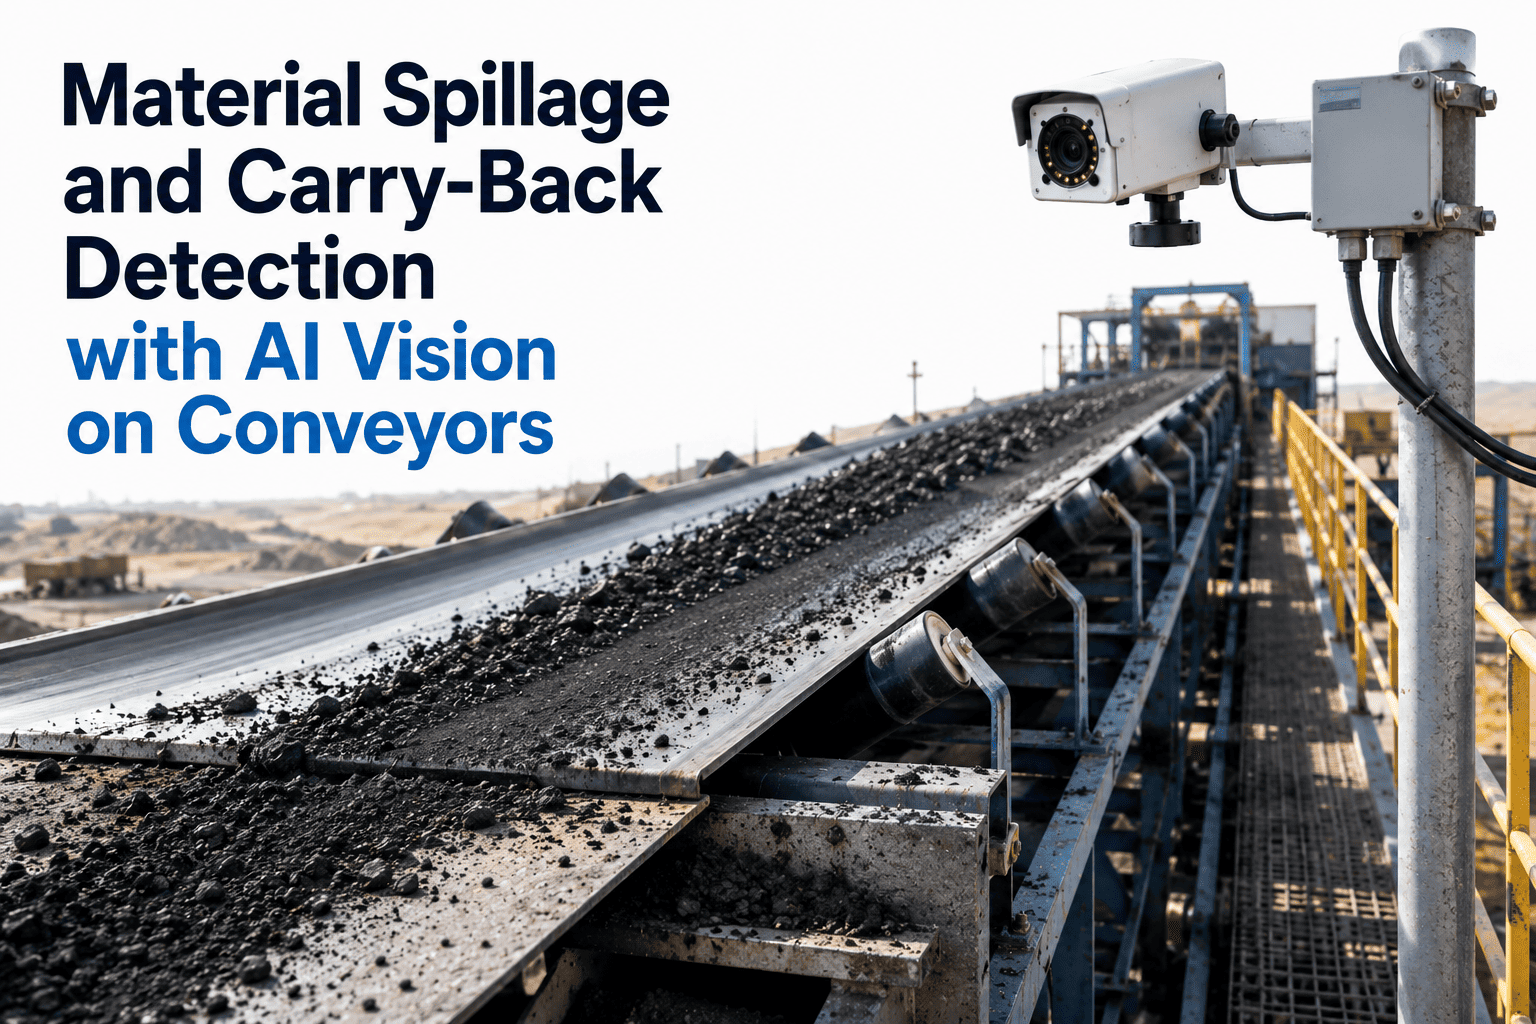
Material spillage and carry-back are the most persistent, most underestimated cost centers in bulk material handling. Every conveyor system loses material — at transfer points, along skirting gaps, and as carry-back on the return belt — but most operations have no idea how much they are actually losing because nobody is measuring it continuously. Industry data shows that poorly maintained conveyor systems can lose up to 3 percent of total cargo to fugitive material, while world-class operations keep that figure below 0.1 percent. The difference between those two numbers on a conveyor moving 10,000 tonnes per day is 290 tonnes of material on the floor every single day — material that needs to be cleaned up by hand, that creates slip-and-trip hazards, that builds up on idlers and causes belt damage, and that in combustible-material environments represents a regulatory violation and a fire risk. AI vision cameras mounted at transfer points and along the return belt now quantify spillage and carry-back in real time, distinguish between normal carry-back levels and active spillage events that require intervention, and trigger cleanup and maintenance alerts automatically before accumulation creates safety hazards or equipment damage. You can book a demo to see how this applies to your conveyor network.
290 Tonnes a Day on the Floor. Nobody Counting. Everybody Cleaning.
iFactory's AI vision platform quantifies material spillage at every transfer point and carry-back on every return belt, triggers cleanup alerts the moment accumulation crosses a threshold, and gives you the data to fix the root cause instead of endlessly sweeping the symptom.
Understanding What You Are Losing — and Where
Fugitive material from conveyors falls into four distinct categories, each with different causes, locations, and cost impacts. AI vision monitors all four continuously, but knowing the distinction matters because the root cause fix is different for each type.
Cargo that escapes the belt entirely at transfer points, overloaded sections, or worn skirting zones. Spillage piles accumulate rapidly and contain the full particle size range of the cargo. This is the most visible and highest-volume category of material loss, and the one most directly tied to transfer point design and skirting maintenance.
Material that adheres to the belt surface after discharge and is carried back along the return side of the conveyor. Carry-back consists of smaller, moisture-laden particles that accumulate on return idlers, build up on pulleys, and fall off at random points beneath the conveyor. It is the primary cause of idler seizure and return-side belt damage.
Fine airborne particles generated at transfer points, discharge zones, and along exposed belt runs where wind lifts dust from the cargo surface. Dust is a respiratory health hazard, a combustible material risk in coal and grain operations, and a frequent source of regulatory citations.
Material that escapes through gaps in chute walls, worn seals, and transition areas where belt profile changes. Leakage is often a steady, low-volume loss that goes unnoticed for weeks but accumulates into significant volumes that require major cleanup and can damage structural components beneath the conveyor.
Six Cost Categories That Spillage Creates — Most of Them Invisible
Raw material or finished product that never reaches its destination is a direct revenue loss. At 1 percent loss on a 5,000 tonne-per-day operation, that is 50 tonnes of material on the floor daily — material that was mined, processed, and transported but never sold.
Spillage does not clean itself up. Dedicated cleanup crews or maintenance technicians diverted from planned work spend hours per shift shoveling, sweeping, and removing accumulated material. This labor cost is recurring, predictable, and almost always accepted as unavoidable rather than treated as a correctable problem.
Carry-back material builds up on return idlers, causing them to seize. Seized idlers create flat spots that damage the belt underside and generate friction heat. Spillage trapped between the belt and frame accelerates edge wear. Each of these secondary failures costs $10,000 to $50,000 to repair and often triggers unplanned downtime.
Material piles beneath conveyors create slip, trip, and fall hazards. In combustible-material environments, accumulated dust and fines are an explosion risk. Mining safety regulators cite housekeeping violations as among the most frequent infractions — MSHA issued over 3,400 combustible material accumulation citations in a single year.
Fugitive material that enters waterways, contaminates surrounding land, or generates airborne particulates beyond permit limits triggers regulatory action. Fines, remediation costs, and community relations damage from visible material loss can dwarf the direct cost of the material itself.
A conveyor with carry-back buildup on idlers and pulleys draws 10 to 20 percent more motor current than one running clean. Over a year of 24/7 operation, the excess energy cost is significant — and entirely invisible unless someone correlates motor current with belt cleanliness data.
Find Out How Much Material Your Conveyors Are Actually Losing
iFactory analyzes camera feeds at your transfer points and return belts to quantify spillage and carry-back — giving you the baseline number your operation has never had.
Three Detection Modes Running Simultaneously on Every Camera
Transfer Point Spillage Monitoring
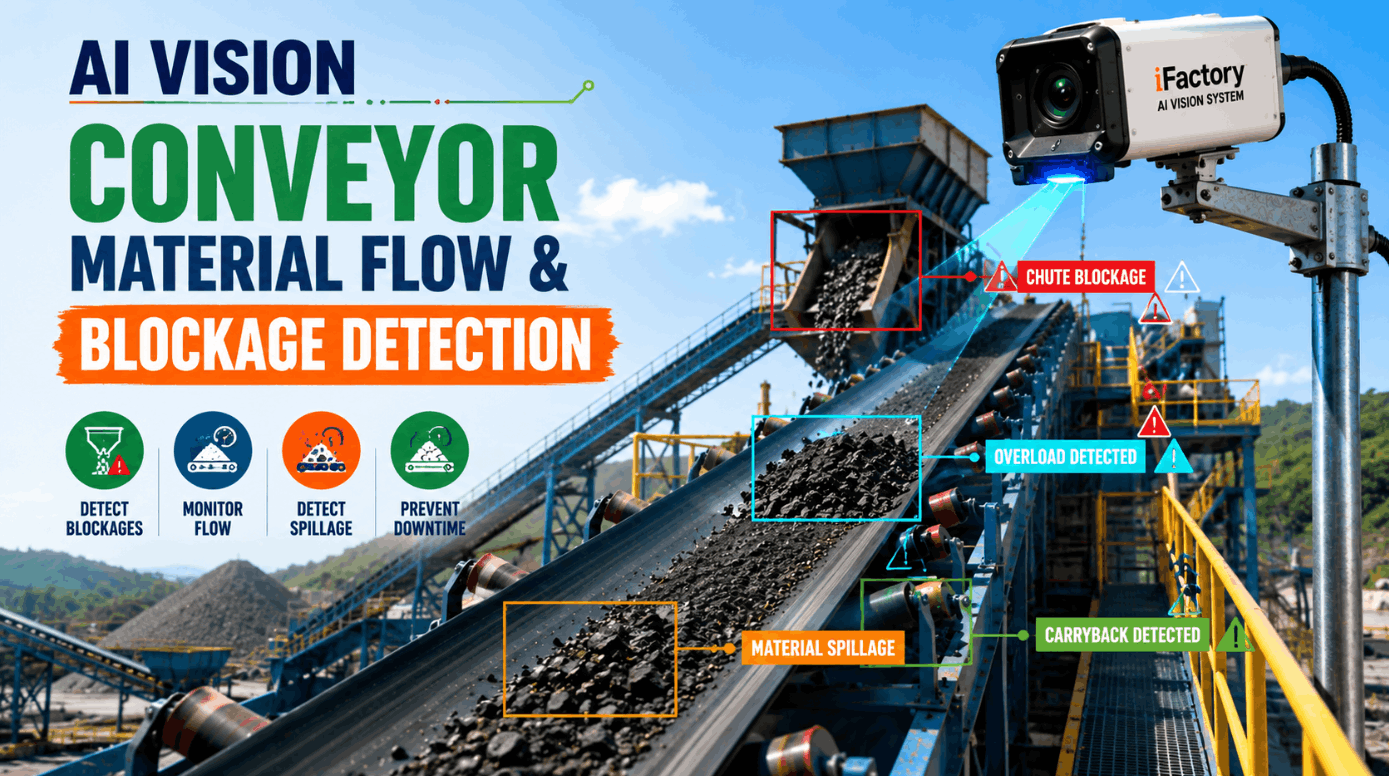
Cameras positioned at transfer points, chute lips, and discharge zones analyze material accumulation patterns frame by frame. The AI model distinguishes between normal material flow during belt loading and active spillage escaping the belt path. When accumulation in the spillage zone exceeds a configurable volume threshold, the system generates a cleanup work order with the camera frame, location, and estimated volume attached. Intermittent spillage from surge loads is classified separately from continuous spillage caused by worn skirting or chute misalignment, enabling root cause analysis that goes beyond just dispatching a cleanup crew.
Return Belt Carry-Back Analysis
Cameras on the return side of the belt monitor the underside surface for material adhesion after the discharge point. The AI quantifies carry-back coverage as a percentage of belt width and tracks how that percentage changes over time. Rising carry-back levels indicate that belt scrapers are wearing or losing tension and need adjustment — the system generates a scraper maintenance work order based on carry-back trend data rather than waiting for a scheduled inspection that may be weeks away. This proactive scraper management prevents the carry-back from building up on return idlers and causing the secondary damage cascade of seized bearings, belt wear, and mistracking.
Under-Conveyor Accumulation Tracking
Cameras monitoring the ground beneath the conveyor detect material accumulation over time, tracking pile growth rates to differentiate between a slow leak and an active spillage event. Accumulation data is geo-referenced to specific conveyor sections, creating a spatial map of where material loss is concentrated across the entire conveyor network. This map directs engineering attention to the specific transfer points, skirting sections, or scraper positions that are the root cause of the loss — turning cleanup from a perpetual labor task into a targeted engineering fix.
What Changes When Spillage Becomes Measured Instead of Tolerated
| Operational Area | Before AI Spillage Monitoring | After AI Spillage Monitoring |
|---|---|---|
| Material Loss Visibility | Unknown — no measurement system in place | Quantified per transfer point, per shift, with trend data |
| Cleanup Dispatch | Scheduled patrol routes regardless of actual spillage | On-demand cleanup triggered only when accumulation exceeds threshold |
| Scraper Maintenance | Time-based schedule — scrapers inspected monthly or quarterly | Condition-based — scraper adjustment triggered by rising carry-back trends |
| Root Cause Analysis | General awareness that spillage exists, no data on where or why | Spatial map of spillage hotspots tied to specific equipment and conditions |
| Housekeeping Compliance | Reactive — violations discovered during audits or incidents | Proactive — accumulation detected and cleared before regulatory thresholds |
| Cleanup Labor Allocation | Fixed crews assigned to routine sweeping across entire conveyor network | Crews dispatched to specific locations where AI confirms active spillage |
Results Reported After Deploying AI Spillage and Carry-Back Monitoring
Non-Invasive, Add-On Monitoring That Runs on Existing Infrastructure
AI spillage and carry-back monitoring deploys as an overlay on your existing conveyor and camera infrastructure. No belt modification, no embedded sensors, no structural changes to transfer points. Most sites are fully operational within 6 to 12 weeks.
Cameras positioned at transfer points, discharge zones, return-side inspection points, and beneath conveyors at known accumulation areas. Existing CCTV cameras can be repurposed where resolution and angle meet detection requirements.
Ruggedized edge computing units process camera feeds locally at sub-200ms latency. All three detection modes — transfer spillage, carry-back analysis, and under-conveyor accumulation — run simultaneously on the same hardware.
Every detection event routes to your existing CMMS as a structured work order — cleanup dispatch, scraper adjustment, or engineering investigation — with camera evidence, location, and severity pre-populated.
A centralized dashboard displays spillage and carry-back metrics per conveyor, per transfer point, and per shift. Trend graphs show whether conditions are improving or degrading, giving supervisors the data to prioritize capital improvements at the highest-loss locations.
Common Questions About AI Vision Spillage and Carry-Back Detection
Stop Sweeping the Same Floor Every Shift. Start Fixing the Root Cause.
iFactory turns material spillage from an accepted cost of doing business into a measured, manageable, and continuously reducing problem — automatically.