A cement plant does not have a data problem in the sense of not having data. It has fifteen thousand tags across a DCS, a couple of standalone PLC islands, a historian, a lab system holding the XRF results, a weighbridge database, and a CCR logbook where the actual stoppage reasons live. None of it is joined, half the tag names mean something only to the engineer who commissioned the line, and quality data arrives on a different clock from process data. That is why most cement AI projects spend their first four months on plumbing and their last two explaining why the model is late.
iFactory / Plant data integration layer
Read Kiln, Mill and Utility Data Natively — Without a Six-Month Tag Project
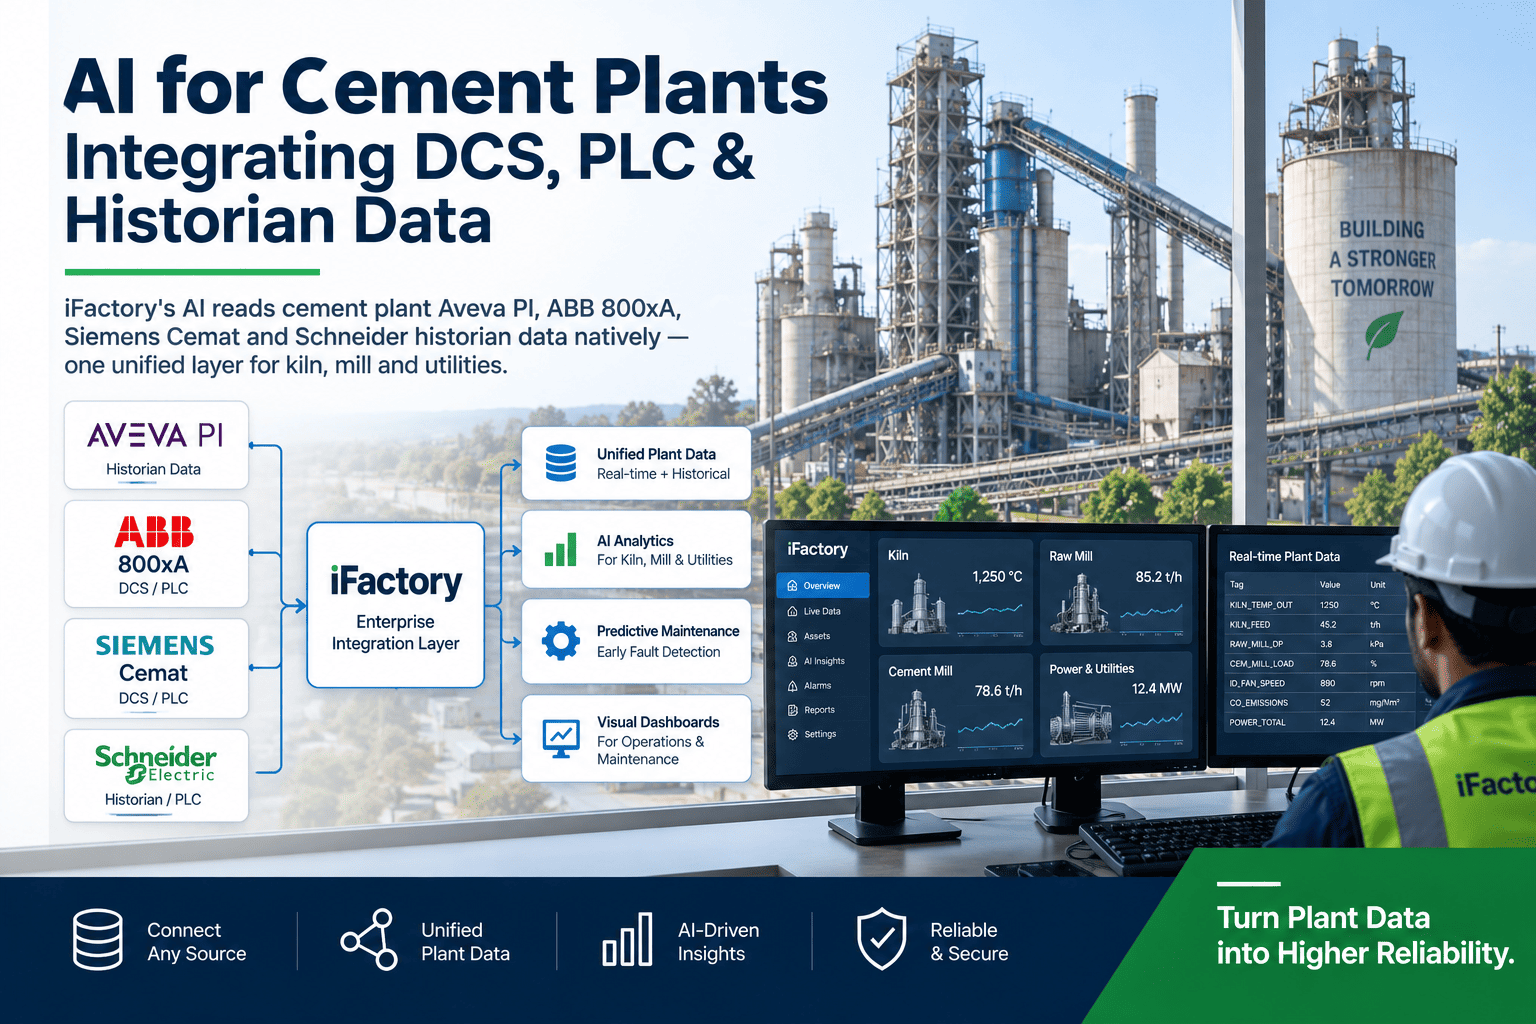
iFactory connects to Aveva PI, ABB 800xA, Siemens Cemat and Schneider systems through their own interfaces, contextualises raw tags into an asset model, and time-aligns process, lab and event data into one layer the models and your engineers both read. Read-only by default.
800xA / Cemat
Aveva PI
PLC islands
Lab / XRF
CCR events
OPC UA · PI Web API · Modbus TCP · SQL
Contextualised, time-aligned layer
kiln line → preheater stage → cyclone → fan
Native
protocol connectors
Weeks
to a usable tag map
The Problem Is Context, Not Collection
Collecting tags is the easy part; every historian on the market does it. What no cement plant has by default is the layer that says K1_C4_OUTLET_TEMP belongs to stage four of line one's preheater, sits upstream of the ID fan whose vibration lives in a separate PLC, and should be read together with the free lime result the lab posts ninety minutes later against a sample taken at a time nobody recorded precisely.
Without that context, a model either gets hand-fed a curated tag list by a process engineer — which works for one use case and doesn't generalise — or it learns spurious relationships from data that was never aligned in the first place. Both outcomes are common, and both look like an AI accuracy problem when they are a data-engineering problem. The plants that get value quickly are the ones that build the contextual layer once and then attach model after model to it.
Where the Data Actually Lives Today
Four stores, four different retention policies, four different notions of what a timestamp means.
DCS historian
The 800xA or Cemat local history holds excellent resolution for a short window — often weeks rather than years — and is sized for operator trending, not for training. By the time a failure is worth investigating, the data that preceded it has rolled off.
Plant historian
PI or equivalent has the retention, but the tag names are commissioning-era shorthand with no asset structure behind them. Nobody can answer "give me everything on cooler grate 1" without a person who remembers, and that person is usually one retirement away.
Lab & quality
XRF and XRD results, free lime, blaine and residue sit in the lab system on a sample clock, not a process clock. The join between "this result" and "the kiln conditions that produced it" is made by hand, if at all — and that join is the whole basis of a quality model.
CCR logbook
The reason the kiln stopped — coating collapse, cyclone blockage, fan trip, raw mix excursion — is written by the operator in a book or a shift form. It is the highest-value label set in the plant and it is not machine-readable anywhere.
What the Integration Layer Actually Does
Four jobs. The first is the one vendors talk about; the other three are where projects are actually won or lost.
Native Connectors
OPC UA and OPC DA to the control layer, PI Web API and AF for the historian, Modbus TCP and Ethernet/IP for standalone PLC islands, SQL and file interfaces for lab and weighbridge data.
Reads: no middleware to buy
Contextualisation
Raw tags bound into an asset model — kiln line, preheater stage, cyclone, fan, cooler grate, mill, separator, baghouse — so every model and every engineer asks for equipment, not for tag strings.
Builds: reusable asset templates
Time Alignment
Second-resolution process data, hourly lab results and event-based stoppages resolved onto one timeline, including material transport lag between feed, kiln and cooler so causes line up with effects.
Resolves: sample vs process clock
Quality Handling
Frozen transmitters, out-of-range values, comms dropouts, analyser calibration windows and shutdown periods detected and flagged, so models don't learn from a thermocouple that stopped moving in March.
Flags: bad data, doesn't hide it
What Gets Written Back
The layer is read-first, but it returns value into the systems your engineers already use rather than trapping it in a separate tool.
Asset model
Historian / PI AF
The contextual structure published back into your own historian's asset framework, so the mapping work becomes a plant asset you keep — with or without iFactory.
Derived tags
Historian
Soft sensors written as new tags — free lime estimate, specific heat consumption, thermal substitution rate, mill specific power — trendable by the CCR in the screens they already have open.
Event frames
Historian / MES
Stoppages, coating and ring episodes, blockages and quality excursions written as structured events with start, end, equipment and cause — the label set the plant never had.
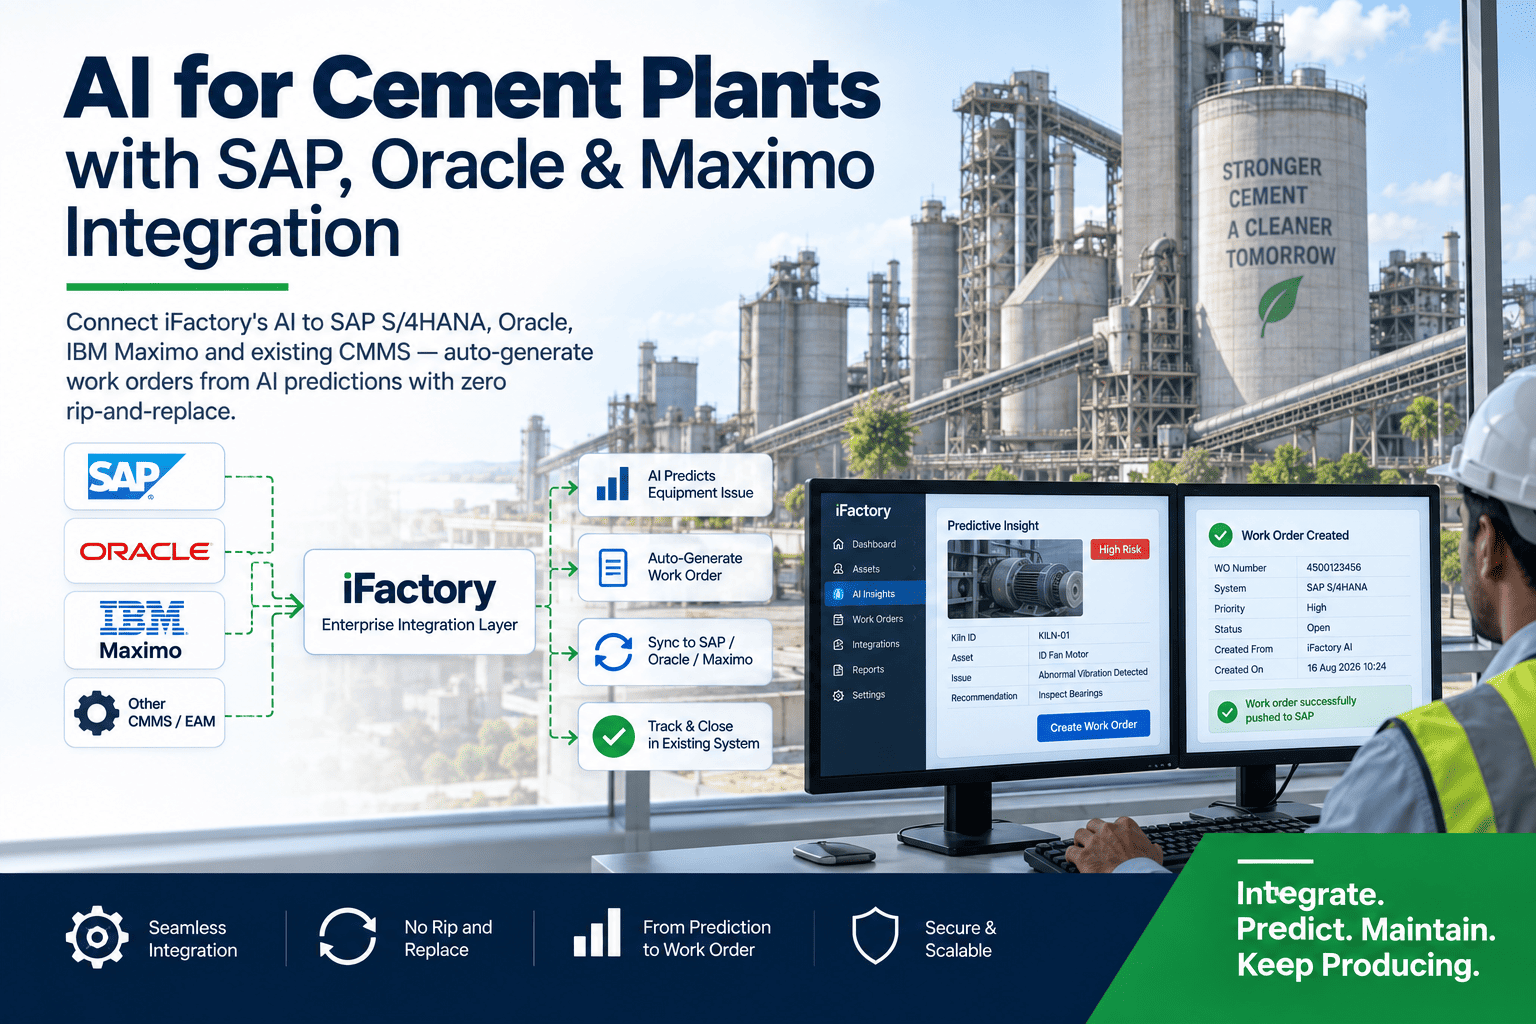
Condition trigger
CMMS / ERP
Where a derived condition crosses a threshold agreed with reliability, a notification or work order is raised in SAP, Maximo or Oracle against the mapped equipment.
Ask your process engineer how long it would take to produce twelve months of kiln data with the lab results correctly joined to the process conditions that produced them. If the answer involves a month of Excel, the data layer is the project — not the model. Book a data readiness review and we'll inventory one line's tags with you.
12-Week Integration Shape on One Line
One kiln line first, then a second area on the same templates. The sequencing is deliberate — contextualisation before models, because models built on an uncontextualised extract have to be rebuilt later anyway.
Weeks 1–2
Inventory & Connect
Read-only connection to the historian and DCS. Full tag inventory with scan rate, retention, last-change time and quality profile — which immediately shows which instruments are dead, frozen or duplicated.
Weeks 3–4
Contextualise One Line
Tags bound to an asset template covering the kiln line from raw meal feed through preheater, kiln, cooler and dedusting. Lab results joined to process conditions with transport lag applied and validated by your process engineer.
Weeks 5–8
Derived Tags Live
Soft sensors and event detection running against the live layer and written back as tags and event frames. The CCR sees them in their existing trend screens; accuracy tracked daily against lab results.
Weeks 9–12
Second Area & Handover
The same templates applied to the raw mill or cement mill to prove reuse rather than bespoke work. Asset templates and the tag map handed to your team, with training on adding a new asset without us.
Who Owns the KPI
A data layer touches four functions, and if only the digital team measures it, the automation team will quite reasonably treat it as a risk rather than an asset.
Automation / DCS
Added load on the control network
Owns control-system integrity. Reads come from the historian and a dedicated OPC server rather than from controllers, with subscription rates agreed and measured — not assumed to be harmless.
Process Engineer
Tag coverage and data completeness
Owns whether the layer represents the process. The measure is what proportion of the defined asset model has live, good-quality data behind it — and which instruments need fixing to close the gap.
Quality / Lab
Lab-to-process join accuracy
Owns the join that quality models depend on. Sample timestamps, transport lag and homogenisation have to be handled explicitly, and the lab is the only function that can confirm the result is right.
Digital / IT Lead
Time to add a new asset or use case
Owns the reuse argument. If the second kiln line takes as long as the first, the layer failed; if it takes days because the templates carry over, every later use case gets cheaper.
FAQ
Will reading all these tags load our control network?
The default architecture avoids touching controllers at all. Historical data comes from the historian, which is designed to be queried; live data comes through an existing or dedicated OPC UA server at a subscription rate agreed with your automation engineer, typically well below what the operator stations already consume. Where a standalone PLC island has no historian in front of it, we put a lightweight collector next to it rather than polling it from elsewhere on the network. Load is measured during the first two weeks and reported, and the connection is read-only unless write-back to the historian is explicitly enabled later — writes go to new derived tags, never to existing process tags or control values.
Our tag names are undocumented shorthand. How long does mapping really take?
For one kiln line, usually two to three weeks of elapsed time with a few hours a week from a process engineer. The work is not manual from a blank sheet: tag naming in cement is more consistent than it feels from inside one plant, so the first pass is proposed automatically from name patterns, engineering units, value ranges and correlation structure, and your engineer corrects it rather than authors it. The honest caveat is that the first line is the expensive one — the second line on the same plant typically maps in days because the asset templates and the naming conventions carry over. Where tags genuinely cannot be identified, they stay unmapped and visible in the gap list rather than being guessed into the model.
We don't have PI — we only have the DCS's own historian. Does this still work?
Yes, with one consequence worth planning for. The connectors work directly against 800xA, Cemat, Schneider and comparable systems, and OPC UA covers most of what a DCS-native historian exposes. The consequence is retention: DCS-resident history is commonly sized in weeks or a few months, which is enough to run live models and build the contextual layer, but thin for training anything that needs to see a full season of raw material and fuel variation. In that case iFactory's own store becomes the long-term history from the day it is connected, and the first models that need a year of data come later than the ones that don't. We'll tell you which use cases are available immediately and which need the history to accumulate, rather than promising all of them at week one.
Four months of plumbing is not a modelling strategy.
Start With a Tag Inventory of One Kiln Line
Bring your historian, your DCS and one process engineer. We'll produce the tag inventory, show which instruments are frozen or dead, and map one preheater branch into an asset model live — so you can see what the contextual layer actually looks like before committing to anything.
Lab join
with lag applied