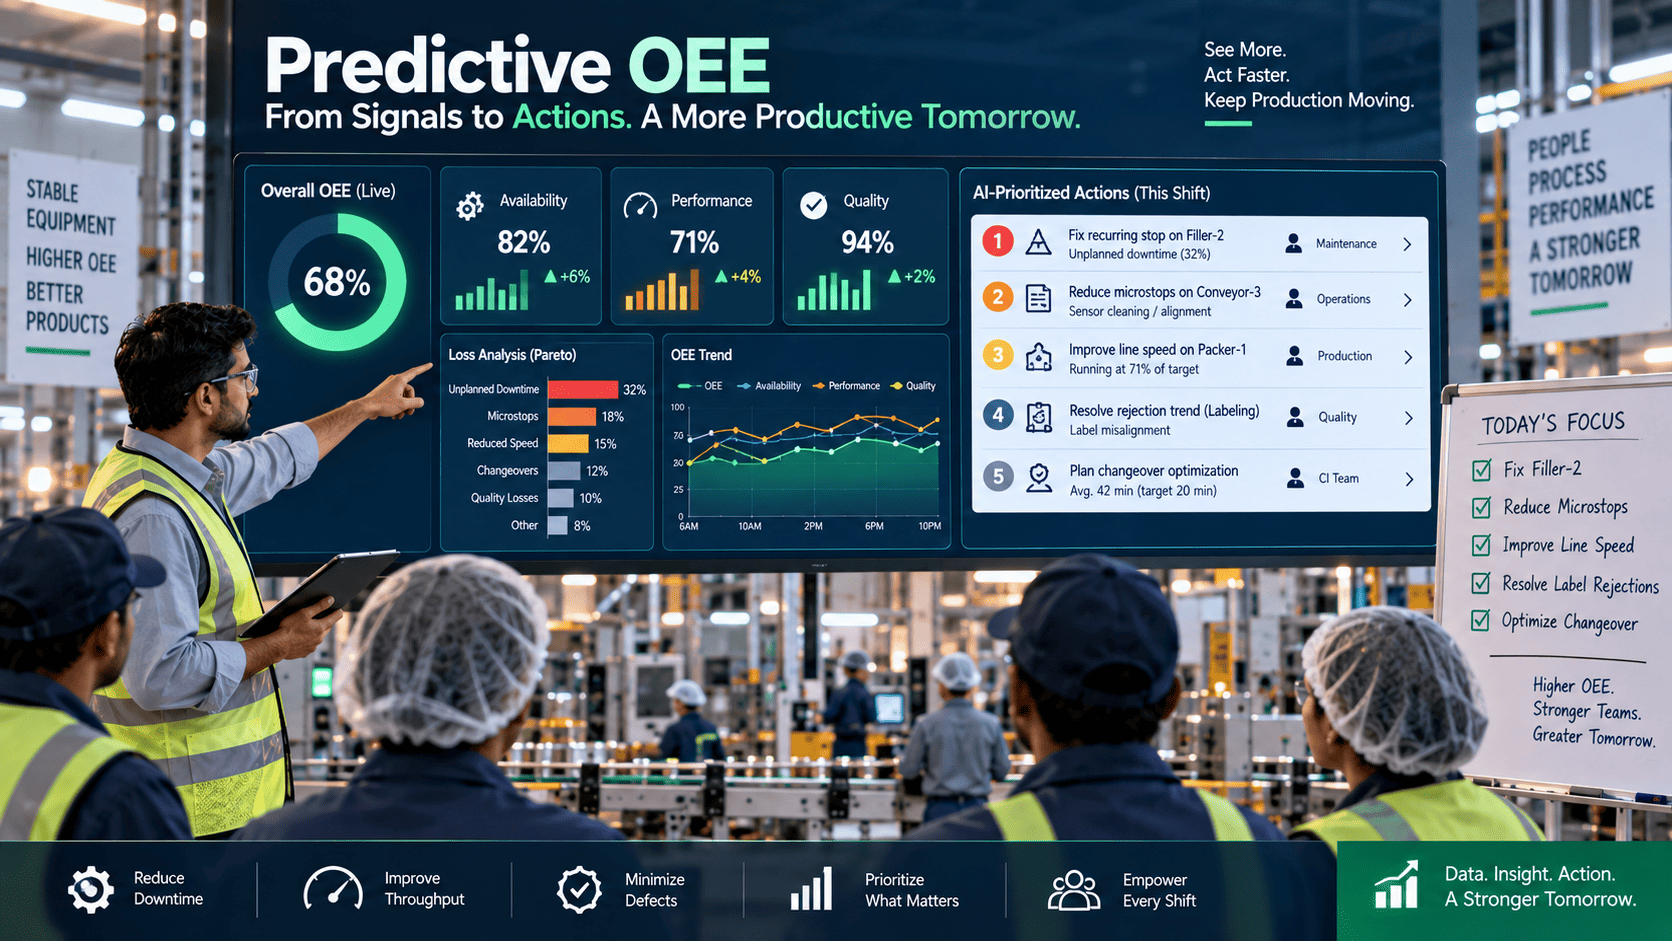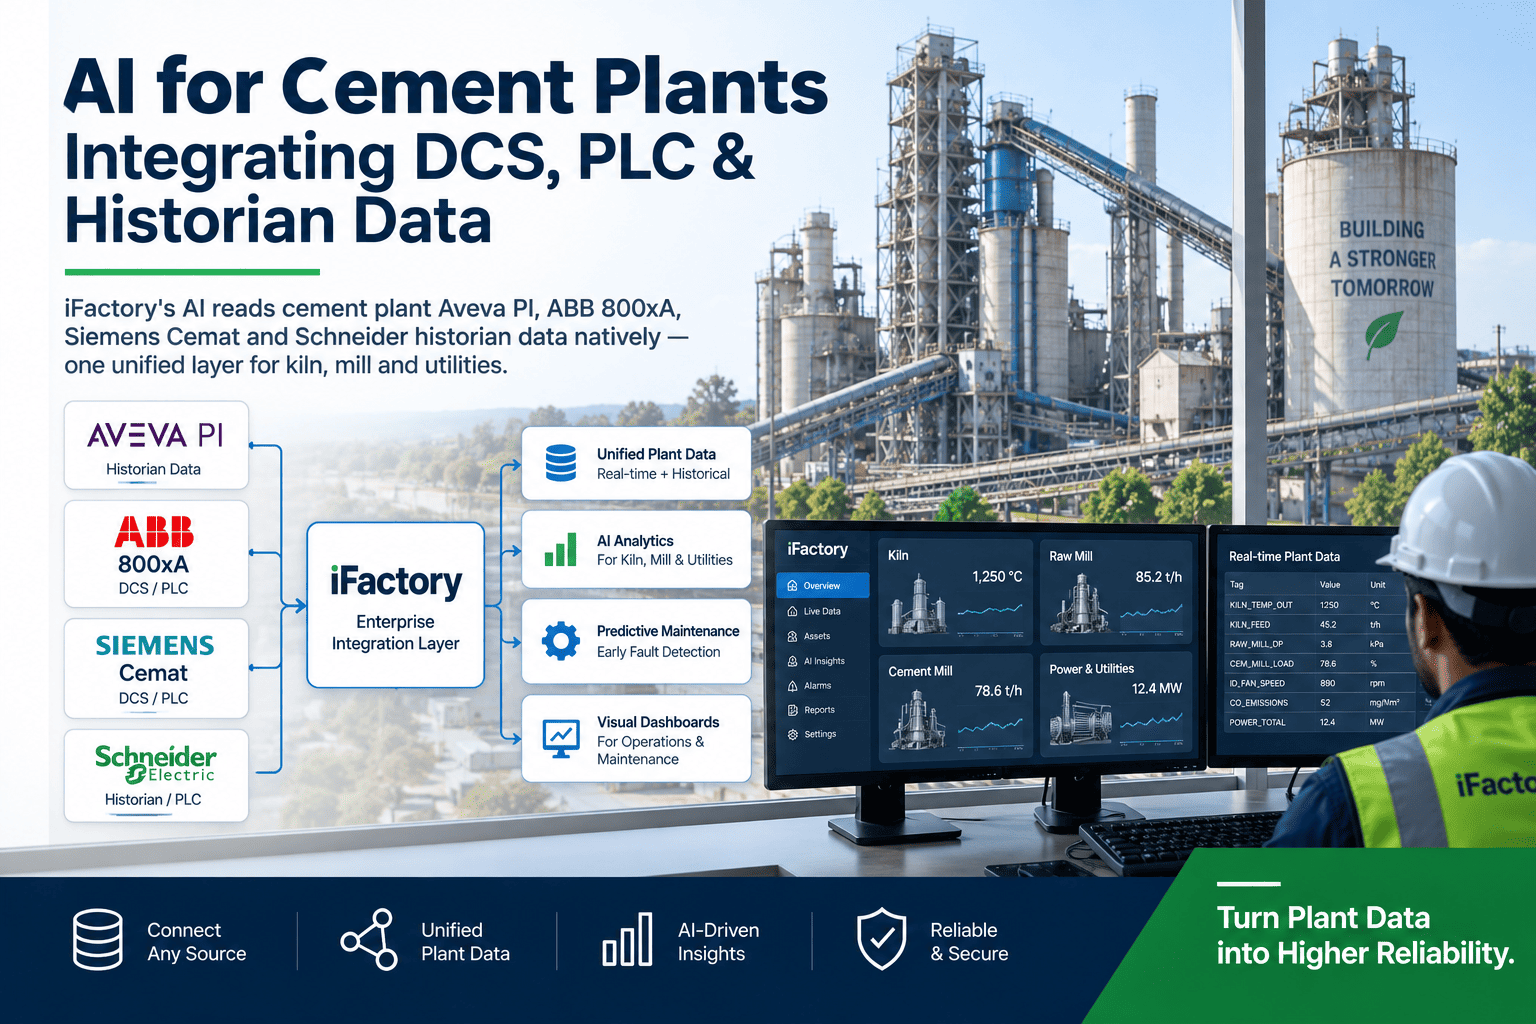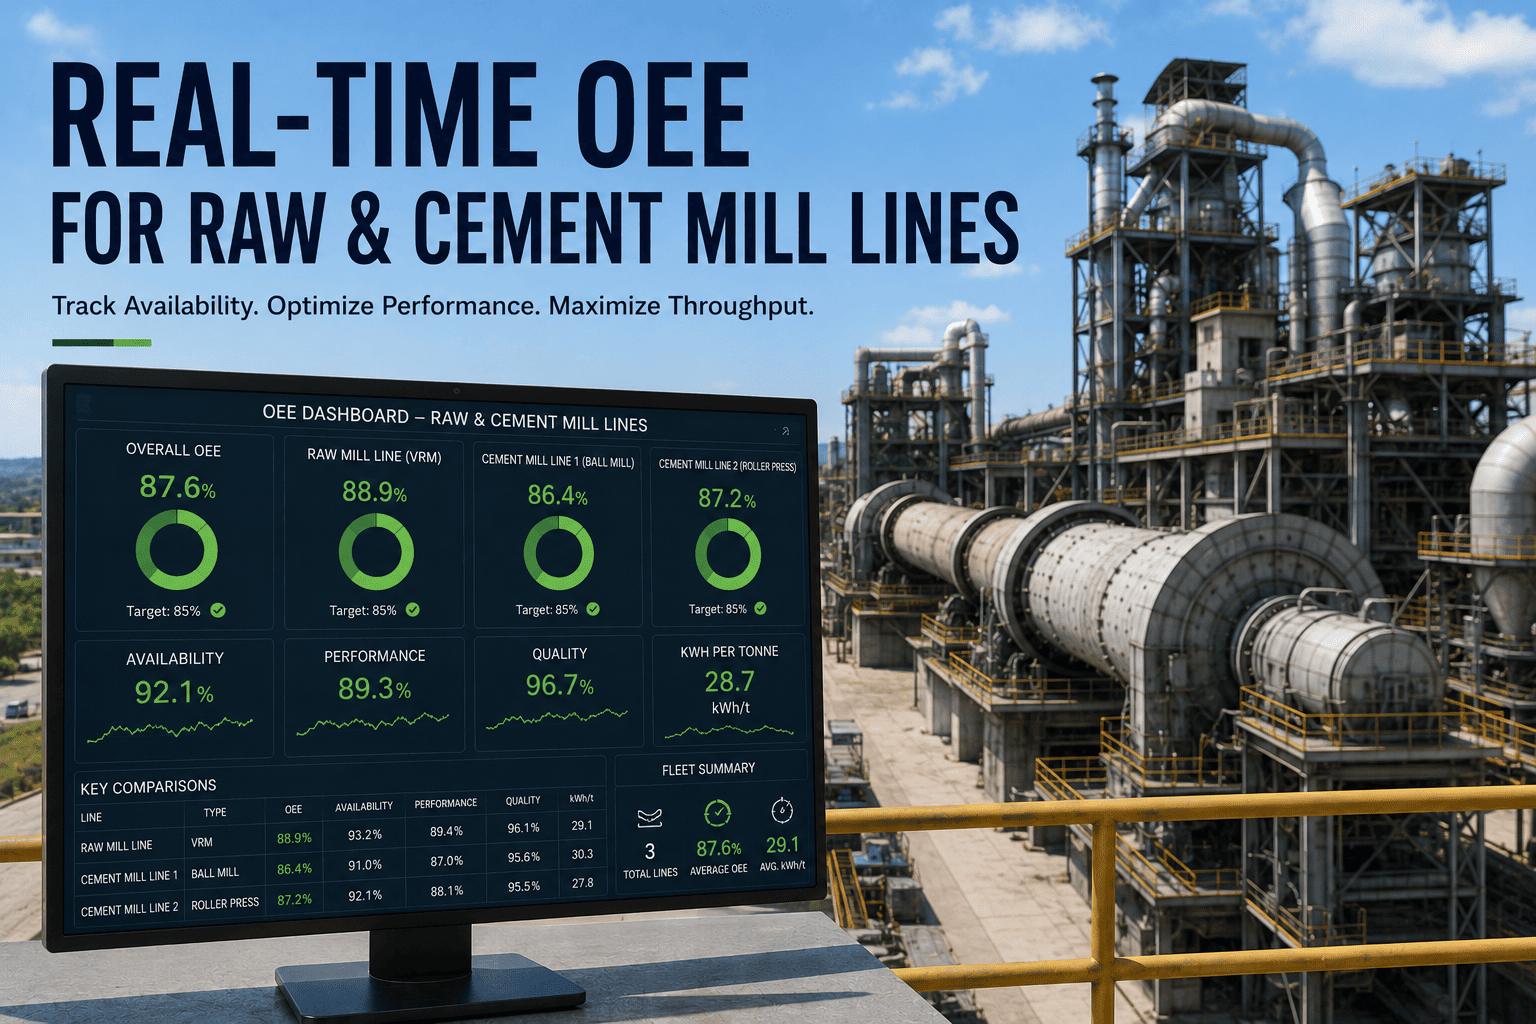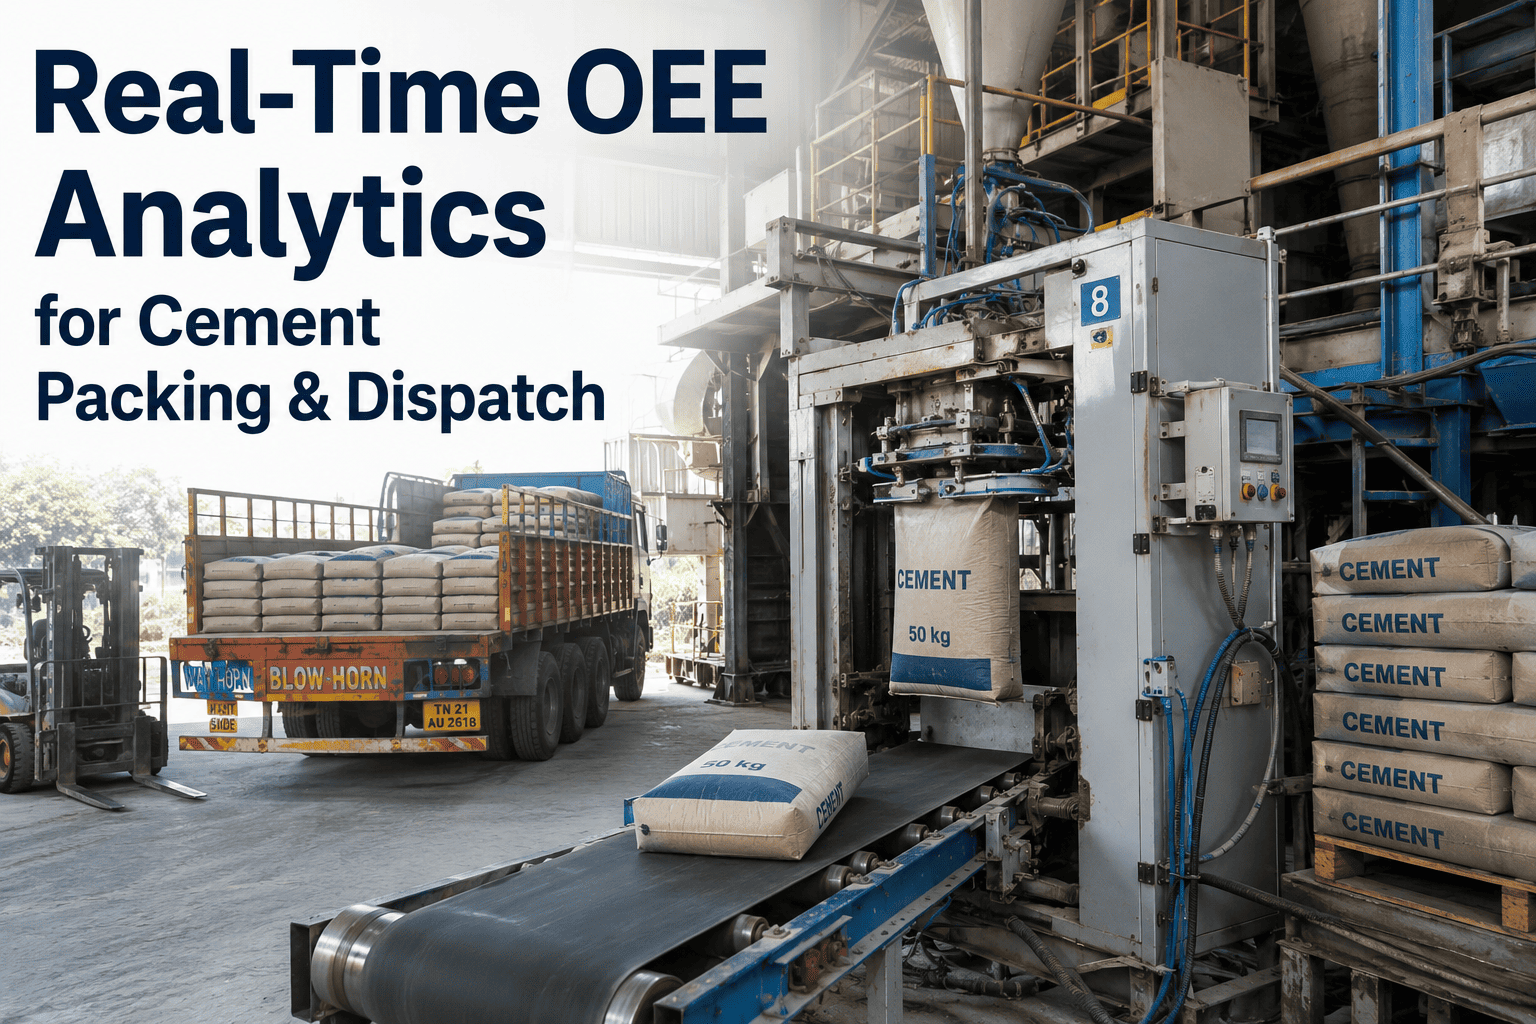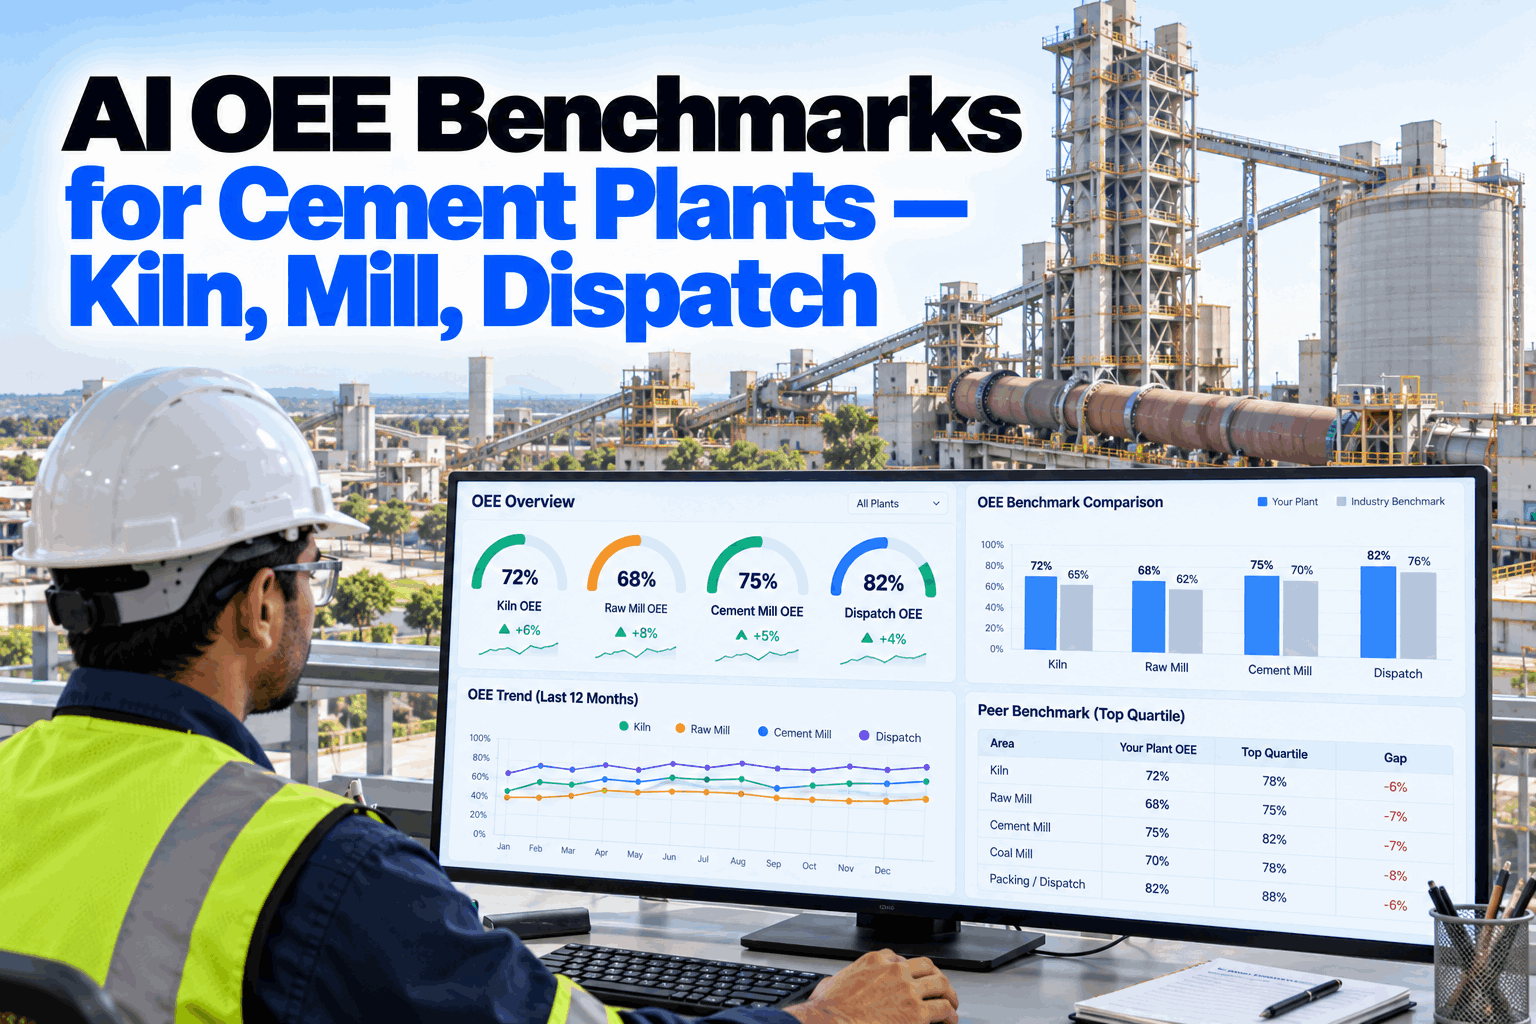
Two cement plants can both report a kiln OEE of 84% and be running very differently. One measures availability against calendar hours, the other against planned hours. One compares rate with nameplate, the other with its best month. Benchmarks built on mixed definitions rank plants wrongly and send improvement money to the wrong place. This guide shows how to benchmark OEE fairly across kiln lines, raw mills, cement mills, coal mills and packing and dispatch, which losses matter most for each, and how AI explains a gap. Start with a benchmark review.
AI OEE Benchmarks for Cement Plants: Kiln, Mill and Dispatch
Compare OEE for each kiln, mill and packer against your other lines and against peer groups built on the same definitions, then see which loss explains each gap.
- Common OEE definitions per asset class
- Fair comparison by process, size and product
- Each gap split into availability, rate and quality
Why Raw OEE Comparisons Mislead
A benchmark is only as fair as the definitions behind it.
OEE multiplies availability, performance and quality. Each of the three can be measured in several reasonable ways, and cement plants rarely use the same ones. Some count planned shutdowns as lost time, others leave them out. Some measure kiln rate against nameplate capacity, others against the best rate the kiln has proven. Some count stops caused by low market demand as equipment losses. Put numbers built these ways side by side and the ranking can say more about the formulas than about the plants. Our OEE specialists can review how your plants calculate OEE today.
Mixed-definition benchmarks
- Different time bases for availability
- Nameplate at one plant, best rate at another
- Market stops counted as breakdowns
- Mill rates compared across products
Like-for-like benchmarks
- One time base, stated on the report
- One agreed rate basis per asset
- Market stops tracked separately
- Mill rates compared by product
OEE Definitions by Asset Class
Each part of a cement plant loses value in a different way.
A kiln line, a cement mill and a packing plant do not lose output the same way, so each needs its own clear definition of availability, performance and quality. The grid below shows common choices. What matters most is that every plant in a comparison uses the same ones, and that the definition is printed next to the number. Agree your definitions in a working session.
Same Kiln, Two Definitions
The formula alone can move OEE by several points.
Take one kiln over a year. It has 8,760 calendar hours, a 600-hour planned shutdown and 7,600 running hours. While running it makes an average of 4,600 tonnes of clinker a day. Its nameplate is 5,000 tonnes a day and its best proven rate is 4,800. Clinker quality is 98%. Measured one way, OEE is about 84%. Measured another, about 81.5%. Nothing about the kiln changed. These figures are illustrative. Run your own numbers with our analytics team.
Definition B shows lower availability and higher performance than definition A. Benchmarking each of the three parts separately, on the same basis, tells you far more than the single OEE figure does.
Normalizing for a Fair Comparison
Compare plants that face the same conditions, or adjust for the ones they do not.
Even with common definitions, some differences between plants are outside the control of the plant team. A fair benchmark either groups plants that share them or reports them separately. The four below cause the most confusion in cement benchmarking. Set your normalization rules with our benchmarking team.
Product mix
Finer or blended grades grind slower. Compare mill rates by product.
Rate basis
Nameplate, design or best proven. Pick one and state it.
Demand stops
Stops for low sales or full silos kept apart from equipment losses.
Process and size
Kilns grouped by process type, capacity and fuel mix.
Benchmark Every Kiln, Mill and Packer Like for Like
OEE built on one set of definitions across your plants, compared with peer groups that share your process and product mix, with AI explaining every gap.
Benchmarking Kiln Lines
For most kilns, availability is where the money is.
Every hour a kiln is down costs clinker that cannot be made up later, plus fuel to heat up again and stress on the refractory. That makes availability, often reported as run factor, the headline measure for kiln lines. But a single run factor figure hides what matters: how many stops there were, how long they lasted and what caused them. Benchmarking those parts separately shows whether a kiln has a few long failures or many short ones, which call for very different fixes. Discuss your kiln benchmarks with our kiln specialists.
Run factor
Running hours against planned hours.
Unplanned stops
Number per month, by cause.
Clinker rate
Against the agreed rate basis.
Clinker in spec
Free lime and chemistry within limits.
Benchmarking Raw, Cement and Coal Mills
For mills, rate and energy tell the story together.
Mills are often limited by rate rather than by stops. A cement mill grinding a fine or blended grade will run slower than the same mill on a coarser grade, so rate benchmarks only make sense within one product. Specific power, in kilowatt-hours per tonne, belongs next to OEE for every mill, because a mill can raise its rate by grinding coarser and lose on quality and energy instead. Set up mill benchmarks in a short session.
Rate and stops
Compare by mill type and raw material hardness.
Rate by product
Each grade benchmarked on its own, with kWh per tonne.
Stops and fineness
Rate tied to fuel type and moisture.
Benchmarking Packing and Dispatch
The last step decides whether customers get their cement on time.
Packing plants lose output in short stops, bag changes, jams and waiting for trucks. Packer OEE should count bags against rated speed and treat broken or out-of-weight bags as quality losses. Dispatch adds measures OEE does not cover, such as truck turnaround time and loading rate for bulk tankers. Waiting for trucks is a logistics loss rather than an equipment loss, and should be tracked as such so the packer is not blamed for it. Review your dispatch measures with our operations team.
Bags per hour
Against rated speed for each packer.
Bag weight and breakage
Out-of-weight and broken bags counted as losses.
Truck turnaround
Gate in to gate out, tracked apart from OEE.
Asking AI Why an Asset Trails Its Peers
A gap is a starting point. The cause is what you act on.
A benchmark shows that an asset is behind. AI looks through the loss history behind the number, by product, shift, stop reason and rate, and shows which loss explains most of the gap. It compares your asset with its own best periods as well as with peers, because your own best proven performance is often the most convincing target for the team. Ask our analytics team how gaps are explained.
Cement OEE Benchmarking Checklist
Eight checks before trusting a benchmark.
Use this checklist before comparing OEE across lines or plants. Tick items already in place. Get help with the gaps from our benchmarking team.
Benchmarking Mistakes to Avoid
A wrong benchmark is worse than none, because people act on it.
These are the patterns that most often make cement benchmarks misleading. A short benchmark review can find them.
What works
- Definitions printed beside every figure
- Availability, rate and quality shown apart
- Peers grouped by process and product
- Own best performance as a second target
What fails
- One OEE number per plant, no breakdown
- Nameplate at some plants, best rate at others
- Low demand counted as poor availability
- Mill rates compared across grades
How iFactory Benchmarks Cement OEE
OEE Analytics and Benchmarking, on your own network.
iFactory's OEE Analytics calculates OEE for every kiln, mill and packer on one set of definitions, and Benchmarking compares each asset with your other lines and with peer groups matched on process, size and product mix. It runs on an on-prem AI server inside your plant. Fit questions go to our solutions team.
OEE by asset
Kilns, mills and packers on one basis.
Stated definitions
Shown beside every figure.
Peer groups
Matched on process, size and product.
Product split
Mill rates compared by grade.
Gap drivers
Each gap split into its losses.
Own best
Best proven periods as targets.
Targets and improvement priorities remain decisions for your team. Figures on this page are worked examples.
Turnkey AI: Delivered, Connected and Live in 6–12 Weeks
You do not build this. It arrives ready.
iFactory ships as a pre-configured NVIDIA AI server with the software pre-loaded, racked and ready. Rack it, plug in power and Ethernet, and the AI is live on your network. Our team handles cabling, network setup, PLC, SCADA, DCS and CMMS integration, DCS, historian and ERP links, operator training and 24×7 remote monitoring. Data stays on your network. For a scope matched to your plant, request a turnkey quote.
Ship, network and data
Server installed. DCS, historian, lab and dispatch data connected. OEE definitions agreed.
Model training and pilot
OEE for each asset, product splits and peer groups set up for one plant.
Go-live and training
Benchmarks live. Plant and process teams trained. 24×7 monitoring begins.
Frequently Asked Questions
How is OEE calculated for a cement kiln?
Availability times performance times quality. Availability is running hours over planned hours, performance is clinker rate over an agreed rate and quality is clinker within specification.
Why do cement OEE benchmarks disagree?
Mostly because of definitions. Different time bases, rate bases and treatment of market stops can move OEE by several points with no change in the plant.
Should rate be measured against nameplate?
It can be, or against best proven rate. Either works if every plant in the comparison uses the same basis and states it.
How should mills be compared?
By product. Finer and blended grades grind slower, so compare rates within each grade and show kWh per tonne alongside OEE.
Do stops for low demand count against OEE?
For benchmarking, they are best tracked separately so equipment performance is not confused with market conditions.
How are peer groups chosen?
By process type, capacity, fuel and product mix, so each asset is compared with others facing similar conditions.
What does AI add to benchmarking?
It explains gaps, showing which loss, product, shift or stop reason accounts for the difference, and compares assets with their own best periods.
Is our data shared with other plants?
The server runs on your own network. Any comparison with other sites is set up by agreement and uses anonymous groups.
How do we start?
Start with one plant. A 6-week pilot agrees definitions, connects data and builds the first benchmarks. To plan it, contact our team.
Know Which Asset Really Trails, and Why
In thirty minutes we review how your plants calculate OEE and show one asset benchmarked like for like with its gap explained. You keep the analysis either way.
- 1Your current OEE or run factor reports
- 2How each plant defines OEE
- 3Kiln stop logs for the last year
- 4Mill rates by cement grade
- 5One asset you think trails its peers