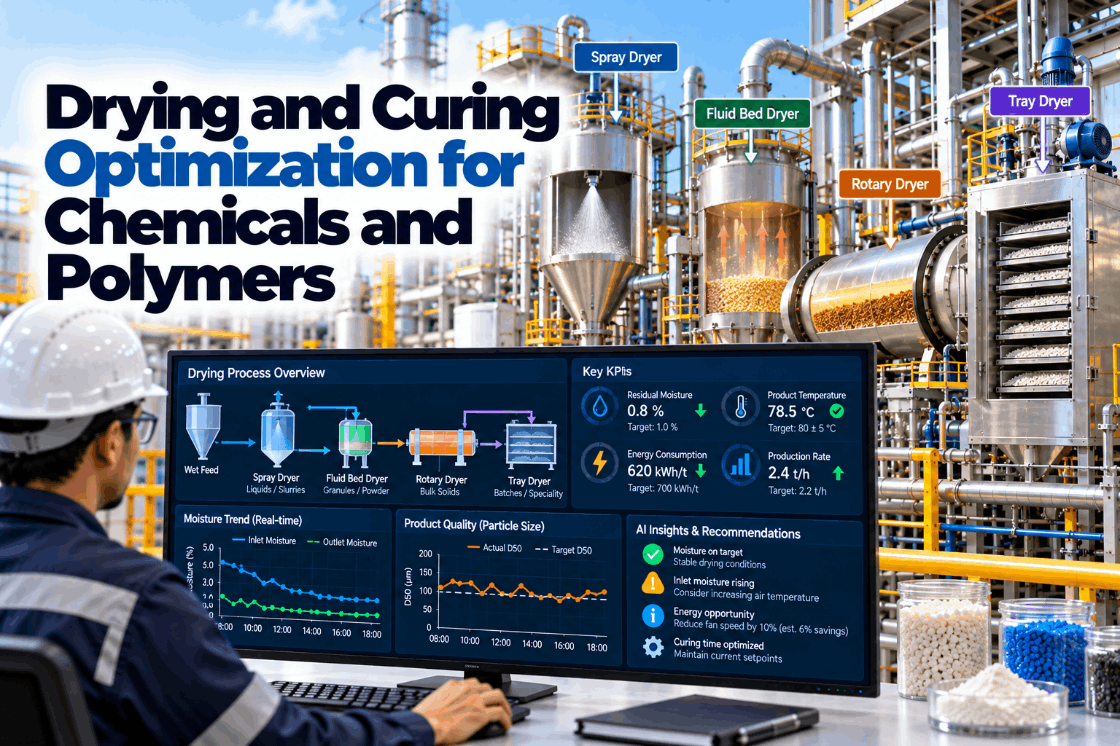
Drying is one of the most energy-hungry steps in chemical and polymer production, and one of the easiest to run inefficiently. Spray dryers, fluid beds, rotary dryers, tray and vacuum dryers all have to remove water or solvent to a residual moisture target without damaging the product, and most of them run with conservative settings that over-dry to stay safe. Curing ovens for coatings face the same trade-off between full cure and wasted heat. The result is energy spent on heat lost through exhaust air, product that varies in moisture and particle size, and quality problems that only show up downstream. This guide covers dryer types, where drying energy goes, the control variables that matter, residual moisture prediction, polymer drying and curing, and how continuous optimization holds moisture, particle properties and energy together. To see your dryer data analyzed, book a short walkthrough.
Drying and Curing Optimization for Chemicals and Polymers: Moisture, Particles and Energy Together
Spray, fluid bed, rotary, tray and vacuum dryers run to a predicted residual moisture instead of a safety margin, with energy per kilogram of water tracked for every dryer and every product.
Why Dryers Waste Energy and Still Miss Moisture Targets
Drying removes water or solvent by evaporation, and evaporation takes a lot of heat. Ian Kemp’s chapter on the energy analysis of dryers, in the Wiley series Modern Drying Technology, estimates that drying accounts for 10–20% of total industrial energy use in most developed countries. The same chapter notes that a typical convective dryer, even when well designed and operated, can be less than 50% efficient, and that the evaporation load is frequently less than half of the fuel energy supplied.
The rest leaves as hot exhaust air, heats the product beyond what is needed or escapes through walls. Much of that waste is operational: outlet temperatures set high to make sure product is dry, feed solids lower than they could be, and no feedback from residual moisture to dryer settings until a lab result comes back hours later.
Quality problems follow the same pattern. Over-dried product may become dusty or brittle, under-dried product cakes in storage or fails specification, and particle size drifts as feed properties change. Most of these effects are predictable from data the dryer already produces.
Prediction lets the plant dry to target instead of to a margin. We can review your dryer data on a call.
Dryer Types and Their Characteristics
Each dryer type suits different products and has its own levers.
| Dryer | How it works | Typical products | Main levers |
|---|---|---|---|
| Spray dryer | Atomized liquid dried in hot gas in seconds | Powders from solutions and slurries | Outlet temperature, feed solids, atomization |
| Fluid bed dryer | Particles suspended in rising hot gas | Granules, crystals, polymers | Gas temperature and flow, bed depth, residence time |
| Rotary dryer | Material tumbled through a rotating drum with hot gas | Bulk chemicals, minerals, fertilizers | Gas temperature, drum speed, feed rate |
| Tray and vacuum tray | Batch drying on trays, often under vacuum | Heat-sensitive and small-batch products | Shelf temperature, vacuum, cycle time |
| Vacuum and agitated dryers | Contact heating under vacuum, often with agitation | Solvent-wet cakes, pharmaceuticals, fine chemicals | Jacket temperature, vacuum, agitation |
| Freeze dryer | Sublimation of frozen solvent under deep vacuum | Very heat-sensitive products | Shelf temperature, chamber pressure, cycle stages |
Kemp distinguishes convective dryers, which heat the product with hot gas, from contact dryers, which heat it through a surface. Contact dryers avoid heating large volumes of air, and Kemp gives a likely maximum practicable efficiency of about 70% for them, against less than 50% for typical convective dryers.
The right levers depend on dryer type and product. Our engineers can map them for each of your dryers.
Where Drying Energy Goes
A simple energy balance shows how much of the heat supplied does useful work.
Illustrative. A Dutch RVO dossier cites about 65% for a typical spray dryer at 200 °C inlet and 85 °C outlet, so this example dryer has room to improve.
The Netherlands Enterprise Agency (RVO) dossier on spray dryer energy gives useful benchmarks. Spray drying can use up to 6,000 kJ per kilogram of water, against about 2,600 kJ for a single-stage evaporator and 430 kJ for a six-stage evaporator. That is why concentrating feed by evaporation before spray drying saves so much energy.
Kemp’s worked examples show how wide the range is in practice: around 30–40% efficiency for vacuum tray ovens and 50–60% for vacuum band dryers. Measuring energy per kilogram of water on each dryer turns these benchmarks into a daily performance number.
Most plants can calculate energy per kilogram of water from existing meters. See it in a demo.
The Control Variables That Matter Most
For spray dryers in particular, a few variables explain most of the energy and quality outcome.
The main control variable for spray dryers and a proxy for residual moisture. Powder and Bulk Solids describes it as the variable operators hold constant.
Higher inlet temperature evaporates more water per kilogram of air, but must stay well below the product’s minimum ignition temperature.
Every point of extra solids means less water to evaporate. RVO cites roughly a third less energy when feed rises from 30% to 40% solids.
Set spray fineness and therefore particle size and residence time.
Moist inlet air carries less drying capacity; dehumidifiers or cooling coils are used in some plants.
Recovering heat from exhaust air to preheat inlet air raises overall efficiency.
Powder and Bulk Solids describes two common control strategies. Holding feed fixed and adjusting inlet temperature keeps operation stable but responds slowly; holding inlet temperature fixed and adjusting feed rate responds faster but can oscillate. A model of the dryer can combine the strengths of both by predicting the effect of a change before it is made.
Outlet temperature setpoint is where savings and risk meet. The RVO dossier estimates that lowering outlet temperature from 90 to 80 °C at the same inlet saves about 9% of energy, but only if residual moisture stays in specification, which is exactly what a moisture prediction model checks.
Predicted moisture makes lower outlet setpoints safe to try. Ask our team how the model is built.
Predicting Residual Moisture and Particle Size
Residual moisture is usually measured in the lab, hours after the product left the dryer. A soft sensor predicts it continuously from process data.
Inlet and outlet temperatures, air flow and humidity.
Solids content, temperature and viscosity from lab and in-line data.
Atomizer speed or nozzle pressure, bed differential pressure, drum speed.
Predicted every minute and checked against lab results.
Estimated from atomization and feed properties, checked against sieve or laser results.
Calculated continuously for each dryer and product.
A prediction is only useful if it is trustworthy. Each lab result is used to check and, where needed, recalibrate the model, and operators see the prediction alongside its confidence. When the model and lab disagree, that disagreement is itself a useful signal, often pointing to an instrument problem.
Particle properties matter as much as moisture for many powders. Bulk density, flowability and dust content depend on particle size and moisture together, so predicting both helps downstream packaging and handling as well as the dryer itself.
Most dryers have enough instrumentation for a first soft sensor. We build one in every rollout.
Polymer Drying and Curing Ovens
Polymer drying and coating cure have their own requirements.
Both polymer drying and curing have the same trap as other dryers: settings chosen to be safe are rarely revisited. Monitoring dew point, residence time and throughput together shows when a dryer is giving more drying than needed, or not enough because throughput has risen.
Curing ovens benefit from the same approach used in drying. When line speed or part mass changes, a model of time at temperature shows whether the oven profile still meets the cure window, without waiting for a failed adhesion or solvent rub test.
Our specialists can review your polymer dryers and curing ovens together.
Safety Margins Versus Predicted Endpoints
The difference between running on margins and running on predictions shows in energy and consistency.
- Outlet temperature set high to be safe
- Moisture known hours later from the lab
- Feed solids accepted as they come
- Energy seen only on monthly bills
- Over-dried product accepted as normal
- Changes tried rarely
- Outlet setpoint matched to predicted moisture
- Moisture predicted every minute
- Feed solids pushed up where possible
- Energy per kg water tracked daily
- Moisture held near target, not below it
- Changes tested safely in advisory mode
Safety is not reduced. Ignition temperature limits, deposit monitoring and interlocks remain in the plant’s certified systems. Predictions help operators move toward targets with evidence instead of guesswork.
See how predictions and recommendations look on the operator screen in a session.
Dryer Optimization Checklist
Use this checklist to prepare dryers for continuous optimization.
Most plants can start with existing instruments and lab data. Begin with a dryer review.
What Dryer Optimization Is Worth
Value comes from energy and quality together.
The RVO figures show the size of the levers: about 9% from a 10 °C lower outlet temperature and roughly a third from raising feed solids from 30% to 40%. Not every dryer can take those steps, but most have room on at least one lever once moisture is predicted reliably.
A review of a month of dryer and lab data usually shows the first opportunities. Book one with our advisors.
How iFactory Delivers Dryer Process Optimization
Residual moisture predicted every minute.
Outlet temperature and feed rate for current conditions.
Energy effect of feed concentration shown.
MJ per kg water by dryer and product.
Time at temperature checked against the cure window.
Signals of build-up and fire risk flagged.
It runs on premises beside your DCS and historian. Share a month of dryer data and lab results and we will show your energy per kilogram of water in a working session.
See How Much Heat Your Dryers Really Need
Share a month of dryer and lab data. We calculate energy per kilogram of water, build a moisture prediction and show the setpoints that hold quality at lower energy.
Outlet temperature is running 4 °C above its band while feed solids are 2 points lower than usual. Predicted residual moisture is still in spec, but energy per kilogram of water is up 7%.
An Outlet Setpoint Lowered With Evidence
This exchange shows how a drying operations engineer might use iFactory.
iFactory ships as a pre-configured NVIDIA AI server, racked and ready with the drying and curing optimization models loaded. Rack it, plug in power and Ethernet, and the AI is live on your network. Our scope covers data connections across dryers, ovens, evaporators and utilities, DCS, PLC/SCADA, historian, LIMS and CMMS integration, cabling and network setup, operator and engineer training, and 24×7 remote monitoring. Recommendations run in advisory mode first, and nothing writes to your control system without your management of change approval.
Server installed, DCS and historian links live, historical process, lab and maintenance data loaded.
Models calibrated on your own unit data, then run in advisory mode on one unit with your process engineers reviewing every recommendation.
Rollout to the agreed units under your management of change, operator and engineer training, and 24×7 remote monitoring in place.
Software, server and integration come as one package. For pricing on your site, contact our sales team.
Frequently Asked Questions
Kemp’s chapter in Modern Drying Technology estimates 10–20% of total industrial energy in most developed countries, with typical convective dryers less than 50% efficient.
Outlet air temperature, which acts as a proxy for residual moisture. It is held by adjusting either inlet temperature or feed rate.
By lowering outlet temperature where moisture allows, raising feed solids through upstream evaporation and recovering exhaust heat. RVO cites about 9% from a 10 °C lower outlet and roughly a third from raising solids from 30% to 40%.
Moisture causes hydrolysis during melting, lowering intrinsic viscosity and causing defects. Industry sources cite targets around 50 ppm or below, with some specifications under 30 ppm.
Yes. A soft sensor using air temperatures, flows, humidity and feed properties predicts moisture continuously and is checked against every lab result.
A first dryer can typically be optimized within a 6–12 week rollout, starting in advisory mode. Plan it with our engineers.
Dry to Target, Not to a Safety Margin
iFactory predicts residual moisture, recommends outlet and feed settings and tracks energy per kilogram of water, so dryers use less heat and product stays in specification.
Illustrative. The latent heat of water near 100 °C is about 2.26 MJ/kg, so the gap above it shows heat lost to exhaust and walls.