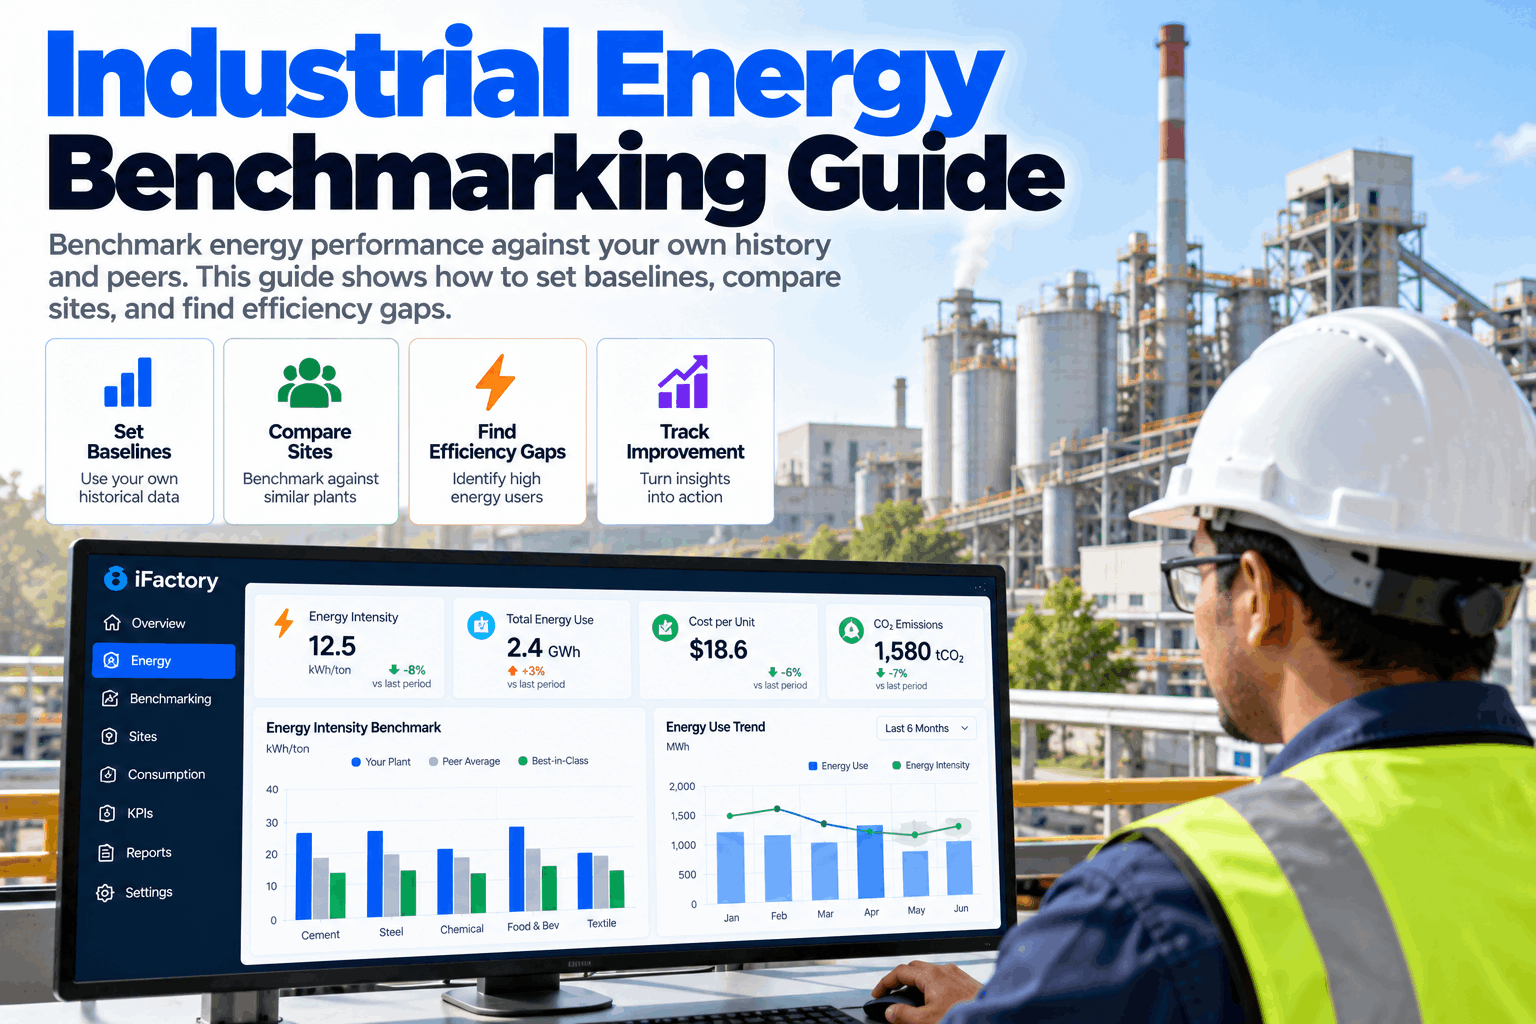
"We used 4.2 GWh last month" tells you almost nothing. Was that a good month or a bad one? It depends on how much was produced, how hot the weather was, how many shifts ran and what the best comparable site achieves. Energy benchmarking answers that question. It turns raw consumption into a fair comparison against your own history, against your other sites and against peers, so efficiency gaps become visible and worth chasing. This guide shows how to set baselines, compare sites fairly and find the gaps. To apply it to your own meters, book an benchmarking walkthrough.
Industrial Energy Benchmarking Guide
A practical guide to benchmarking energy performance against your own history and your peers: how to set a baseline that holds up, compare sites fairly and turn the gap into a ranked list of actions.
- How to normalise energy use so comparisons are fair
- Which benchmark to use: own history, other sites or peers
- How to turn a gap into ranked, costed actions
Three systems explain more than four fifths of the gap. The dashed line marks where the cumulative share passes 80%. A benchmark is only useful if it points at systems like these, not just at a total.
What Energy Benchmarking Really Is
Benchmarking compares like with like, and says how large the gap is.
Total energy use rises and falls with production, product mix, weather and operating hours, so comparing raw totals between months or sites is misleading. Benchmarking fixes this by turning consumption into a performance indicator, such as kWh per tonne, per unit or per square metre, and by adjusting for the factors that drive use. The result is a fair measure of how well energy is used, not just how much. Our energy analytics team can show how this looks on your own meter data.
Meter the right things
Main meters, plus sub-meters on the biggest systems.
Remove the noise
Adjust for output, mix, weather and operating hours.
Find the gap
Against your own baseline, other sites and peers.
Cost the gap
Rank causes by energy and money, then fix them.
A site that looks worse than its peers may run an older process, a different product or colder weather. Use the benchmark to ask where the difference comes from, and let the sub-meter data answer.
Three Kinds of Benchmark
Each type answers a different question.
Most organisations need all three, in a sensible order. Start with your own history, because it is the fairest comparison and needs no outside data. Add site-to-site comparison next, and use external peers last, as a rough guide. To choose the right mix for your sites, book a benchmark planning call.
Your best demonstrated performance is a benchmark nobody can argue with. If the same plant used 12% less energy per unit last spring at the same output, the question is simply what changed.
Set a Baseline That Holds Up
A baseline is only fair if it adjusts for what drives energy use.
A baseline is an expected energy use for given conditions, built from a period of normal operation. It is usually modelled against the factors that drive consumption, so it can say what energy a site should have used this month, not just what it used last year. This is also the approach used for energy baselines and performance indicators under ISO 50001.
When a new line, a major retrofit or a change of product mix alters the process, set a new baseline and note the date. Otherwise the benchmark will reward or punish the site for something that has nothing to do with efficiency.
What an Energy Gap Is Worth
A gap in kWh per unit can look small on a chart. Multiplied by a year of output and the unit price of energy, it becomes a number worth acting on.
From Benchmark to Action
A gap only matters once it is traced to a system and a cause.
The benchmark tells you which site and which period to look at. Sub-meters and equipment data tell you which system. Together they produce a short list of actions with a value on each, which is what a budget holder needs to say yes.
Meter
Main and sub-meters on the big systems.
Normalise
Adjust for output, mix, weather and hours.
Compare
Against baseline, sites and best week.
Rank
Gaps ordered by kWh and cost.
Act
Fixes assigned with owners and dates.
Verify
Savings checked against the baseline.
Common Benchmarking Mistakes
Most bad benchmarks come from unfair comparisons.
A benchmark that is easy to produce is often easy to misread. A few simple checks keep the comparison honest and keep the team's trust in the numbers.
Good practice
- Compare normalised energy intensity
- Use the same boundary and meters for every site
- Benchmark by product family or process
Common mistakes
- Comparing total kWh between sites of different size
- Mixing electricity, gas and steam without a rule
- Using an old baseline after a process change
State which meters, fuels and processes count in each benchmark, and keep that statement with the result. Two sites can differ by ten percent simply because one counts its boiler and the other does not.
How iFactory Enterprise Energy Dashboard Works
Meter data in, fair comparisons and ranked gaps out.
iFactory's Enterprise Energy Dashboard collects data from your meters, sub-meters and production systems. It builds normalised baselines, compares lines, plants and sites on energy intensity, shows the gap to your best week and ranks the causes by energy and cost. It runs on an on-prem server inside your network, with one view across all sites. Questions on fit go to our support desk.
All meters
Electricity, gas, steam and water with production data.
Fair baselines
Adjusted for output, mix, weather and hours.
Sites and systems
Plants, lines and equipment on one scale.
Ranked gaps
Causes sized in kWh and cost, with owners.
Savings depend on your sites, metering and how quickly gaps are acted on. We measure energy intensity and savings on your own data during the pilot, rather than promising a general figure.
Turnkey AI: Delivered, Connected and Live in 6–12 Weeks
You do not build this. It arrives ready.
iFactory ships as a pre-configured NVIDIA AI server with the software pre-loaded. Rack it, plug in power and Ethernet, and the AI is live on your network. Our team handles cabling, network setup, meter, PLC and SCADA integration, team training and 24×7 remote monitoring. Data stays on your own network. For a scope matched to your sites, request a turnkey quote.
Ship, network and data
Server installed. Meters, sub-meters and production data connected for the pilot sites.
Baselines and benchmarks
Normalised baselines built. Site and system comparisons checked with your teams.
Go-live and training
Dashboards and alerts live. Teams trained. 24×7 remote monitoring begins.
Frequently Asked Questions
What is industrial energy benchmarking?
It is the comparison of energy performance, usually as energy per unit of output, against your own past, your other sites or external peers, after adjusting for factors that change energy use.
What is the difference between a baseline and a benchmark?
A baseline is your own expected energy use under given conditions. A benchmark is a reference point to compare against, which can be your baseline, another site or a peer range.
Which energy performance indicator should we use?
Pick the one that matches your output, such as kWh per tonne, per unit or per square metre, and report it alongside total energy, cost and carbon.
How do we compare sites that make different products?
Benchmark by product family or process step, or weight output by energy content. Where that is not possible, compare each site with its own baseline first.
How many meters do we need?
Start with main meters and add sub-meters on the largest systems, such as compressed air, process heat and chilled water. Gaps are found at system level, not at the main meter.
How do we start?
With two or three sites or lines that make similar products and already have some metering. A 6-week pilot connects the data, builds baselines and shows the first benchmark. To plan it, contact our team.
Know Where Your Energy Gap Really Is
In thirty minutes we look at your meters, your sites and how you compare them today. You keep the notes whether or not you go further with iFactory.
- 1A year of monthly energy bills or meter data
- 2Production output by month and product
- 3A list of your sites and main processes
- 4Your current sub-meter coverage
- 5The sites you suspect use too much energy