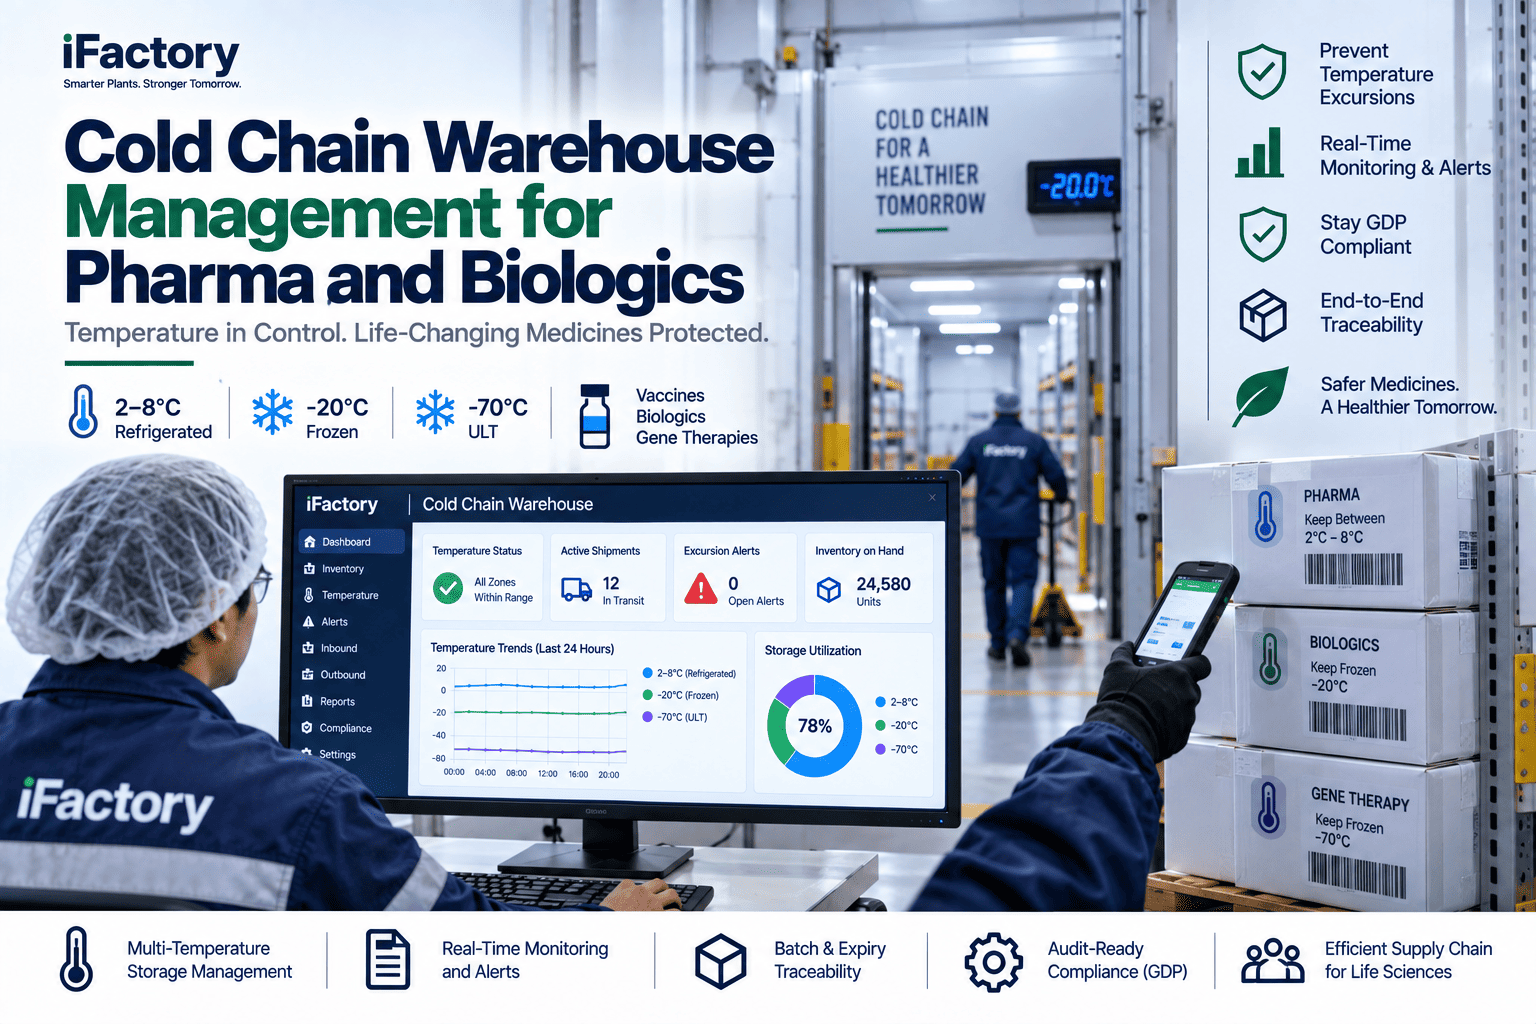
Cold chain in a pharma warehouse is where the cost of a mistake compresses into hours. A single temperature excursion in a 2–8°C cold room averages $100,000 to $500,000 in product losses before adding investigation labour, GDP non-conformance documentation, and any downstream regulatory reporting. Biologics now account for 46% of US drug spending and 38% of pharma warehousing volume moves cold chain. Meanwhile the WHO GDP framework applies as a parallel layer across roughly 78 countries — same continuous monitoring, same retention, same retrieval window. Every ULT freezer, refrigerator, and cool-storage zone in your facility is a compliance perimeter measured in degrees, not dollars.
iFactory / Pharma cold chain warehouse management
Every Vial in Range — Every Excursion Investigated, Every Record Ready
Continuous temperature monitoring across ULT, frozen, refrigerated, cool, and CRT zones, with mean-kinetic-temperature calculation, tamper-evident 21 CFR Part 11 records, and excursion-to-CAPA workflow built in.
< −80°C
Cell & gene therapies · mRNA vaccines
−25 to −10°C
Biologics · plasma-derived products
2 to 8°C
Insulin · vaccines · injectables
8 to 15°C
Some APIs · specialty products
15 to 25°C
Tablets · capsules · solid dosage
$100K–$500K
cost of a single excursion
46%
of US drug spend is biologics
Annual
temperature mapping per GDP
The Problem on the Floor
A pharma cold chain warehouse holds five distinct temperature environments — ULT below −80°C for cell/gene therapies and mRNA vaccines; frozen −25 to −10°C for biologics and plasma; refrigerated 2–8°C for insulin, vaccines, and injectables; cool 8–15°C for some APIs; and controlled room temperature 15–25°C for solid dose. Each has its own qualification, its own alarm limits, its own mapping requirement, and its own excursion response. In a paper-and-chart-recorder world, an excursion is discovered when someone finally reads the chart — hours or days later — by which time the affected stock has already been shipped or dispensed. The regulator does not care that the freezer recovered; the regulator asks who authorised the release and where the CAPA is.
What Escapes Into the System of Record Today
Cold chain data is either continuous and tamper-evident or it isn’t a compliance record. Most warehouses hold it in ways that would not survive a serious inspection.
Paper batch log
Twice-daily manual temperature reads on paper logs. If the reader forgets, the log gets back-filled. An excursion between two manual reads leaves no digital footprint at all.
Spreadsheet
Data-logger downloads quarterly at PQ requalification. Between downloads the freezer is invisible — no live alerts, no acknowledgment record, no way to trigger stock hold in real time.
Chart recorder / data logger
Chart recorder paper rolled up in a cabinet. When an inspector asks for the last 90 days of one refrigerator’s temperature history, someone spends a day flattening rolls and photocopying them.
Nowhere at all
Excursion investigations — the WHY and the CAPA — often live in a Word document on one person’s laptop. Not linked to the batch, not visible in the QMS, not searchable when the pattern of excursions matters.
What the WMS Actually Does
A cold-chain WMS layer holds three things at once: the continuous sensor feed, the calculated MKT that tells you whether cumulative thermal stress has degraded the product, and the workflow that ties every excursion to a batch hold and a documented CAPA.
Continuous Monitoring
Calibrated sensors in every zone reading every 1–5 minutes. Alarms on both absolute limits and rate-of-change. Live acknowledgment recorded with user ID.
Discipline: continuous
MKT Calculation
Mean kinetic temperature computed per storage zone per batch — the single number that tells you whether cumulative excursions have degraded stability profile.
Discipline: cumulative stress
Excursion Response
An out-of-range event triggers immediate batch-status change to conditional quarantine, notification chain fires, investigation workflow opens, and CAPA is created linked to the batch.
Discipline: closed loop
Temperature Mapping
Annual and post-modification mapping of every qualified zone — sensor placement, mapping study execution, hot/cold spot documentation, all in the same record system.
Discipline: annual + on-change
What Gets Written to the System of Record
The value of the cold chain WMS is not the sensor feed — sensors are cheap. It is the record that ties the sensor reading to the batch that was in that zone, the excursion that resulted, the release decision that followed, and the CAPA that closed the loop.
Zone Temperature Log
21 CFR Part 11
Continuous timestamped reads per zone per sensor, immutable and exportable for any date range on demand.
Batch MKT Record
Cold Chain WMS
Mean kinetic temperature per batch per storage episode, calculated per USP <1079> methodology, attached to the batch’s master record.
Excursion CAPA
QMS
Every excursion produces an investigation record with root cause, batch impact assessment, disposition decision, and effectiveness verification.
Mapping Study
Validation System
Annual and event-triggered temperature-mapping studies stored per zone with sensor placement, deviation data, and re-qualification approval.
Try this at your next stand-up: ask when the last excursion happened, which batch it affected, and where the CAPA record lives. If the answer requires three phone calls, the audit trail is not audit-ready. Book a demo — we’ll walk one live cold-chain scenario end to end.
12-Week Pilot Shape on One Warehouse
One warehouse, one temperature zone, twelve weeks. Usually the highest-value or highest-risk zone — the 2–8°C vaccine store or a ULT freezer bank. The pilot proves the sensor-to-CAPA loop closes in real time, not the marketing claim.
Weeks 1–2
Zone Selection & Sensor Placement
Choose the pilot zone. Install calibrated sensors per validated mapping placement. Baseline current excursion frequency from historical data-logger downloads.
Weeks 3–4
Continuous Feed Live
Live temperature feed writing to the WMS. Alarm thresholds set from qualification data. Notification chain configured with QA and stores-head acknowledgement paths.
Weeks 5–8
Excursion Workflow
Excursion-to-batch-hold workflow switched on. Investigation and CAPA linked. MKT calculation active per batch. Team walks through the first live event together.
Weeks 9–12
Mock Inspection
QA runs a mock inspection query: 90 days of zone temperature, all excursions with dispositions, MKT per batch shipped. Retrieval time measured against target.
Who Owns the KPI
Cold chain crosses stores, engineering, QA, and site leadership. Every function needs a KPI or the discipline reverts to “whoever noticed the alarm.”
Stores Head
Excursion acknowledgment time (target <15 min)
Owns the first-response — when an alarm fires, how fast does a named user acknowledge and initiate protocol? A rising number means the notification chain is failing.
Engineering / Facilities
Mean time between excursions per zone
Owns the reliability of the storage equipment itself — a drifting MTBF number on one freezer points at compressor, door seal, or defrost cycle issues that need PdM.
QA / Compliance
Excursion-CAPA closure within target date %
Owns the investigation loop — every excursion produces a closed, effective CAPA within the target window. Open CAPAs are the number regulators actually look for.
Site Director
Product loss $ per quarter from excursions
Owns the P&L consequence — the number that reaches the operations review and drives the investment case for continuous monitoring.
FAQ
How is this different from just installing wireless temperature sensors?
Sensors give you data. What matters is whether the data becomes a compliance record. A wireless sensor with a mobile-app alert is a good start; a WMS-integrated cold-chain layer takes the sensor feed and does three things a stand-alone system does not: (1) it triggers a batch status change to conditional quarantine automatically when an excursion affects specific stock, (2) it calculates MKT per batch across the storage episode so cumulative thermal stress is measurable, and (3) it produces the 21 CFR Part 11 tamper-evident record that survives an FDA or MHRA inspection. Sensors are one piece; the compliance loop is the deliverable.
What is mean kinetic temperature and why does it matter?
MKT is a single calculated temperature that expresses the cumulative thermal stress a product has experienced, weighted by the Arrhenius equation to account for the fact that degradation accelerates non-linearly with temperature. A batch that spent six hours at 15°C is not the same as a batch that spent six hours at 8°C, and MKT captures that difference in one number. USP <1079> and ICH stability guidelines use MKT as the reference for whether excursions have compromised registered stability. Without MKT, you can only argue “the alarm didn’t trip” — with MKT, you can argue that the product remained inside its registered stability envelope.
Book a demo to see MKT calculation running against a real batch history.
Can this handle ULT freezers below −80°C for cell/gene therapy and mRNA?
Yes — the sensor selection and calibration protocol change but the record layer is identical. ULT storage has its own particular failure modes (compressor cascade issues, LN2 supply, door-open events during sample retrieval) and the alarm thresholds and rate-of-change limits are configured for those specifics. Cell and gene therapy warehouses often add per-container serial-number tracking on top, so any excursion trace links to the specific vials affected. That serial-level linkage is where cell/gene compliance goes beyond conventional biologics cold chain.
Stop discovering excursions when someone reads the chart.
See One Cold Chain Zone Running End-to-End
Bring one temperature zone — refrigerated, frozen, or ULT — and one recent excursion event. We’ll show the sensor-to-CAPA workflow, the MKT calculation, and the audit export live.