Cataloging thousands of PLC tags into a structured, named operations model and routing them to the correct statistical process control charts is one of the most technically demanding integration tasks an industrial data architect faces. At scale — 2,800 or more live tags across a multi-cell production environment — the work is not just time-consuming. Without a structured methodology, it generates fragile, undocumented mappings that become a maintenance liability every time equipment is added, a controller is replaced, or a new product family is introduced. iFactory AI addresses this challenge with a purpose-built tag catalog that organizes 2,884 live tags into 27 named operations with explicit read, write, and configuration classifications — and binds each operation directly to its corresponding SPC control chart. To see how this workflow maps to your specific plant architecture, Book a Demo with iFactory's industrial data integration team.
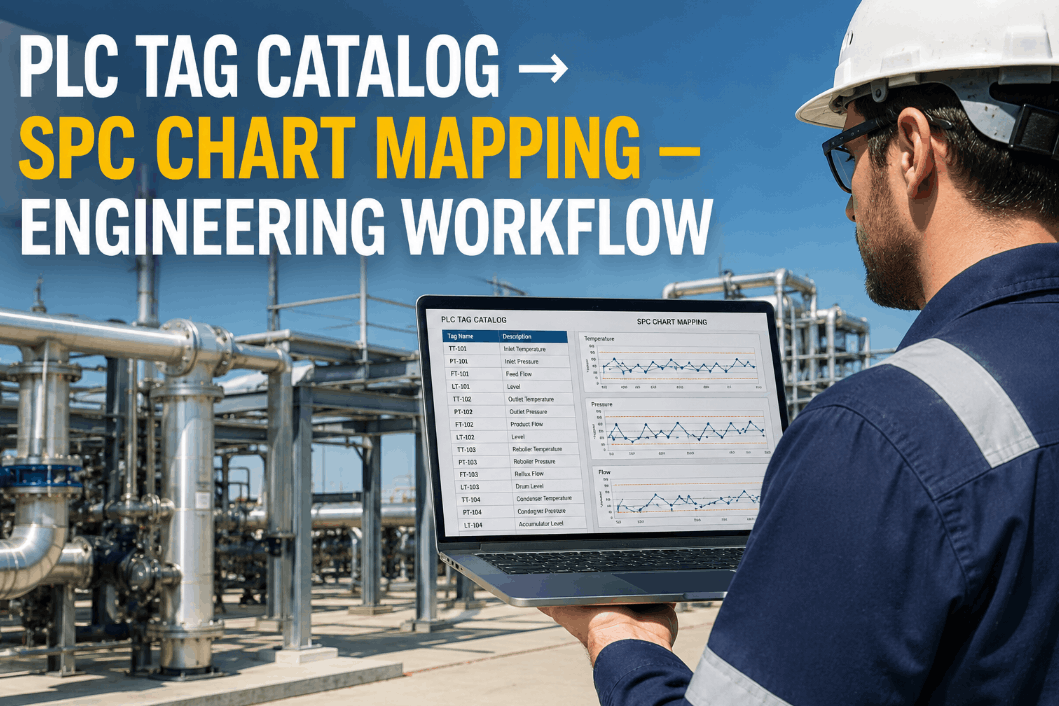
PLC Tag Catalog → SPC Chart Mapping — Engineering Workflow
iFactory AI organizes 2,884 live PLC tags into 27 named operations with read/write/config classification and direct chart-binding — turning raw tag sprawl into a governed, auditable industrial data model.
Why PLC Tag Governance Fails at Scale — and What It Costs
Most manufacturing plants accumulate PLC tags the way they accumulate spare parts: without a governing philosophy, in response to immediate operational needs, and without consistent naming conventions or ownership documentation. A greenfield installation might start with a clean tag structure, but after a few years of production line modifications, equipment upgrades, and controller replacements, the tag database becomes a mixture of legacy naming conventions, undocumented custom tags, duplicate signal paths, and orphaned references that nobody wants to touch.
For the industrial data architect responsible for routing that data to SPC charts, the chaos has direct consequences. Manually mapping 2,800 tags to control charts without a structured catalog produces mappings that are correct when built and wrong three months later when the underlying tag structure changes. The SPC charts continue to display data — but the data no longer corresponds to the process variable it was supposed to represent. Quality decisions get made on stale or misrouted signals, and nobody notices until a product escapes or an audit flags the inconsistency.
The Tag Catalog to SPC Chart Mapping Workflow — Six Stages
iFactory's tag catalog implementation follows a structured six-stage engineering workflow that transforms raw PLC tag exports into a governed, chart-bound data model. Each stage is designed to produce a deliverable that the next stage depends on — ensuring that the final SPC chart bindings are traceable back to original tag definitions without manual re-entry or assumption.
Tag Export and Inventory Baseline
Export the complete tag database from each PLC platform — Allen-Bradley, Siemens, Mitsubishi, or other — including tag name, data type, address, description, and engineering unit metadata. iFactory ingests these exports directly via OPC UA browse, native EtherNet/IP enumeration, or structured tag list upload. The output is a raw inventory baseline that captures every tag in the system regardless of whether it is currently in use.
Tag Classification — Read, Write, Config
Each tag is classified into one of three functional categories: Read tags are process measurement signals flowing from the controller to the analytics layer (temperatures, pressures, speeds, counts). Write tags are process actuation signals used for setpoint commands and parameter pushes. Config tags are engineering parameters — PID tuning values, recipe parameters, alarm thresholds — that require change management governance. This classification drives both the SPC chart type assigned to each tag and the access control model applied to write and config tags.
Named Operations Grouping — 27-Operation Model
Classified tags are grouped into named operations that correspond to logical production process steps — not to physical controller addresses. A named operation is a process unit with a defined quality boundary: "Roll Stand 3 Entry Pinch," "Heat Treatment Zone 2," "Trim Station East." Each named operation receives a unique namespace identifier within iFactory's data model, ensuring that tags from different controllers that belong to the same logical operation are grouped together for analysis — regardless of their physical addressing.
SPC Chart Type Selection Per Tag
Within each named operation, read-classified tags are evaluated for SPC chart type assignment based on their statistical properties and quality significance. Continuous measurement tags with normal distribution characteristics are assigned X-bar R or X-bar S charts. Attribute tags — pass/fail signals, count data, defect rates — are assigned p-charts, np-charts, or c-charts. Tags with known non-normal distributions are assigned individuals (I-MR) charts with adjusted control limit calculation methods. iFactory's chart-binding engine records the chart type, subgroup size, and control limit methodology for each tag as a governed configuration record.
Chart Baseline and Control Limit Establishment
Each bound SPC chart is initialized with a baseline dataset drawn from a defined period of stable production — typically 20 to 30 subgroups from a validated production run. iFactory calculates initial control limits (UCL/LCL) from the baseline and records the baseline period, sample count, calculated mean, and sigma value as part of the chart's configuration record. When production conditions change significantly — new material grade, equipment overhaul, process recipe change — the baseline can be formally recalculated with a documented change reason, maintaining the traceability of the control limit history.
Live Routing Activation and Namespace Governance
With chart bindings validated and baselines established, iFactory activates live tag routing to SPC charts across all 27 named operations simultaneously. The tag catalog becomes the master reference for all downstream data consumers — dashboard displays, AI anomaly detection models, quality reporting exports, and CMMS integrations — ensuring consistent data definitions across every consuming system. New tags added to the system are ingested through the same classification and binding workflow, preventing ungoverned tag accumulation.
What the iFactory Tag Catalog Captures for Each Tag
The tag catalog is more than a list of PLC addresses. Each catalog entry is a governed data object that captures the full context needed for correct SPC routing, access control enforcement, and system-wide data consistency. The table below shows the fields maintained per tag in iFactory's catalog model across a 2,884-tag deployment.
| Catalog Field | Content / Format | Used By | Governance Level |
|---|---|---|---|
| Tag Name | Normalized ISA-88 / ISA-95 compliant namespace | All consumers | Locked — change requires review |
| Controller Source | PLC identity, slot, rack, program name | Routing engine, audit | Auto-populated from OPC UA browse |
| Engineering Unit | °C, bar, mm/s, kN, etc. | SPC chart display, AI models | Editable — version tracked |
| Classification | Read / Write / Config | Access control, chart type | Assigned at catalog build |
| Named Operation | One of 27 defined operation namespaces | Chart binding, dashboards | Editable — reassignment logged |
| Bound Chart Type | X-bar R, I-MR, p-chart, c-chart, etc. | SPC engine | Change requires baseline recalc |
| Control Limits | UCL, CL, LCL with baseline reference | SPC engine, alert rules | Versioned — history retained |
| Quality Significance | Critical / Major / Informational | Alert prioritization, AI models | Assigned by data architect |
Designing the 27-Operation Namespace: Principles and Pitfalls
The most consequential architectural decision in a large-scale tag catalog implementation is the namespace design — how production processes are named, bounded, and organized into the 27 (or more) named operations that the catalog will use to group tags. Get this right and every downstream data consumer benefits from consistent, meaningful context. Get it wrong and the catalog becomes a liability that requires constant manual correction as the plant evolves.
What iFactory's Tag Catalog Enables Beyond SPC Routing
A well-governed tag catalog is a platform asset, not just an SPC configuration. Once 2,884 tags are classified, named, and bound to charts, the same catalog structure powers every other data-consuming capability in iFactory — making the catalog investment multiply in value across the platform.
Expert Review: What Industrial Data Architects Get Wrong in Large-Scale Tag Catalog Projects
Frequently Asked Questions
Tag Catalog Governance Is the Foundation of Reliable SPC — and Every AI Application That Follows
The 2,884-tag catalog and 27-operation namespace that iFactory builds for a production facility is not a one-time integration deliverable — it is the foundational data infrastructure layer on which every subsequent analytics capability depends. SPC chart accuracy, AI model reliability, MES data contextualization, and compliance reporting traceability all trace back to the quality of the tag catalog at the base. An ungoverned tag database produces unreliable analytics regardless of how sophisticated the AI layer above it becomes.
iFactory's approach — enforced classification at ingestion, named operations aligned to quality boundaries, chart-binding as a catalog property rather than a separate configuration — addresses the structural weaknesses that cause large-scale tag catalog projects to fail at industrial facilities. The result is a data foundation that remains accurate and maintainable as the production environment evolves. To assess how iFactory's catalog workflow would organize your specific tag environment, Book a Demo with iFactory's industrial data team.