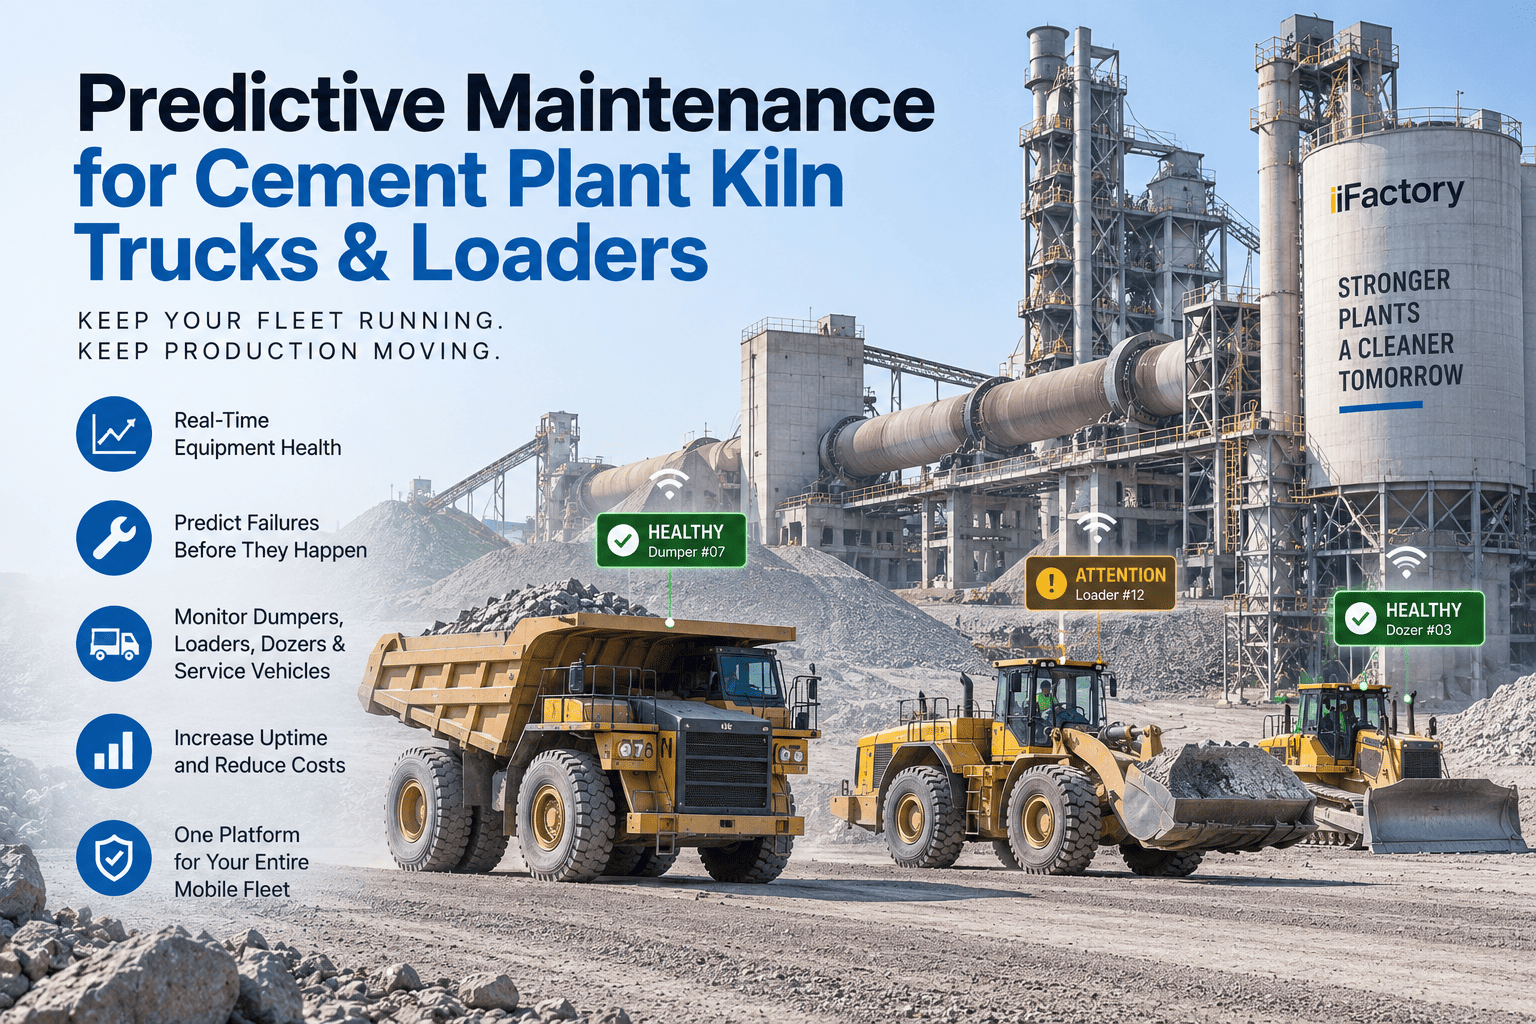
A 90-tonne dumper that breaks down on the quarry haul road at 02:00 doesn't cost the price of a repair — it costs every tonne of limestone that doesn't move until the machine is back on its wheels. In a cement plant where kiln feed continuity is everything, a grounded loader or a seized wheel motor in a dump truck is a production event before it is a maintenance event. The problem with most fleet maintenance in cement operations is not that the equipment isn't inspected — it's that inspections happen on a calendar, not on a condition. A wheel motor that is running hot since Tuesday is not visible on a Friday PM checklist. An AI that watches oil temperature, hydraulic pressure, tyre load distribution, and drivetrain vibration continuously is. iFactory Predictive Maintenance runs exactly that across your entire heavy mobile equipment fleet — quarry and plant, every asset, live.
iFactory Predictive Maintenance — Cement & Quarry Fleet
AI Fleet Health Monitoring for Cement Plant Dumpers, Loaders & Dozers
Engine, drivetrain, hydraulics, tyres, and payload — every health signal from every machine on one platform, with failure predictions days before the breakdown that stops kiln feed.
3–7 days
average early warning lead time before a drivetrain failure
25–35%
reduction in unplanned breakdowns within 12 months of deployment
Every asset
dumpers, loaders, dozers, graders, service vehicles — one view
Live
health score per machine — not a monthly utilisation report
Why Calendar-Based PM Fails on a Cement Fleet
Scheduled preventive maintenance was designed for average equipment in average conditions. Cement quarry and plant environments are not average — haul road gradients, payload variability, dust ingestion, and continuous shift operation push machines into conditions that a 250-hour service interval was never calibrated for. These are the five failure modes that calendar PM consistently misses.
01
Condition ignored between intervals
A wheel motor running 15°C above baseline since Monday is not visible on a Friday PM check. The failure happens on Wednesday night, six weeks before the next scheduled service.
02
Haul road variability not accounted for
A dumper running steeper gradients with maximum payload ages its drivetrain and brakes at twice the rate of one running on flat roads at 80% payload. Same calendar interval, different remaining life.
03
Tyre degradation invisible until failure
Tyre pressure and temperature monitored only at shift start. Mid-shift overloading, rim impact, and heat build-up on long descents are invisible until a tyre is flat on the haul road at 03:00.
04
Hydraulic drift goes undetected
A loader's hydraulic system losing pressure gradually over two weeks shows no single-shift symptom severe enough to flag. The operator adapts — until the system fails completely at the face.
05
No fleet-wide pattern visibility
When three dumpers from the same model year all develop the same gearbox symptom in the same quarter, no one sees it — because each machine's service record lives with a different maintenance supervisor.
The Live Fleet Health Dashboard — What Every Machine Should Show
Fleet-wide predictive maintenance means every machine reporting its health signals against its own baseline, continuously, on one screen — with degradation ranked by the production risk it carries. This is what a cement quarry and plant fleet dashboard looks like across a mixed HME fleet.
DT-07 — Dumper
90t Haul Truck — Quarry
Healthy
Engine temp92°Cwithin baseline
Tyre pressureAll OKFL 680 / FR 682 kPa
Payload cycles38shift target: 42
Health score94/100no alerts
LD-03 — Loader
Cat 994 — Primary Face
Watch
Hydraulic pressure261 bar−14 bar vs baseline
Cycle time drift+8%vs 30-day average
Engine temp104°Cwithin range
Health score71/100monitor closely
DZ-01 — Dozer
Komatsu D475 — Dump Spread
Healthy
Track tensionNormalboth sides in range
Final drive temp87°Cwithin baseline
Fuel burn rate62 L/hr−3% vs baseline
Health score88/100no alerts
DT-12 — Dumper
90t Haul Truck — Quarry
Failure risk
Wheel motor L-rear138°C+31°C vs baseline
Vibration signatureBearingfault pattern detected
EngineNormalno alert
Health score38/100pull to workshop
Every Machine on the Cement Fleet — One Monitoring Platform
Cement operations run one of the most diverse heavy equipment fleets in any extractive industry — from 90-tonne dumpers on the quarry bench to small service vehicles maintaining haul roads. iFactory PdM monitors every asset class on a single platform, with health models specific to each machine's operating profile and failure modes.
Rigid Dumpers / Haul Trucks
45t – 100t payload class
Wheel motor temperature & bearing vibration
Tyre pressure, temperature & load distribution
Retarding system brake temperature
Payload per cycle vs. rated capacity
Fuel burn per tonne-km (haul efficiency)
Front-End Loaders
Large wheel loader, face loading
Hydraulic system pressure & cycle time
Torque converter temperature & slip
Bucket payload vs. rated pass match
Tyre wear index by axle position
Articulation joint stress & cycle count
Bulldozers / Dozers
Bench preparation & dump spreading
Final drive oil temperature per side
Track tension & undercarriage wear rate
Blade pitch pressure & response lag
Fuel burn vs. work output (grade efficiency)
Engine load factor & rimpull utilisation
Motor Graders
Haul road maintenance
Circle drive motor current & temperature
Blade side-shift hydraulic pressure
Tandem drive differential lock status
Pass count per road section (maintenance quality)
Engine hours vs. road condition correlation
Water Carts & Service Vehicles
Dust suppression & fuel delivery
Spray pump pressure & flow rate
Water tank fill/discharge cycle efficiency
Route adherence & coverage tracking
Engine health & drivetrain monitoring
Dust suppression coverage vs. haul road condition
Drill Rigs
Blast hole drilling — quarry bench
Compressor pressure & temperature
Rod string rotation torque & RPM
Feed force & penetration rate per hole
Bit wear estimation from penetration drift
Mast vertical alignment & crowd cylinder pressure
The Failure Modes That Stop Kiln Feed — Caught Before They Happen
Not every fault mode carries the same production consequence. A grader off the road for a shift affects haul road surface quality. A dumper fleet losing 25% of its units to unplanned breakdowns affects kiln feed continuity directly. iFactory PdM ranks failure predictions by their production impact — not just by signal severity.
High production impact
"This failure stops limestone reaching the kiln."
Wheel motor bearing failure — dumper grounded on haul road
Torque converter seizure — loader out of action at primary face
Hydraulic pump failure — loader bucket non-functional
Tyre blowout on descent — machine stranded, haul road blocked
Retarder failure on gradient — full machine withdrawal, safety stop
Lower impact — still costly
"This failure costs repair time and efficiency, not throughput."
Grader circle drive wear — road surface quality degrades over days
Dozer final drive oil temperature creep — reduced output, no stop
Water cart pump pressure drop — suppression coverage reduced
Drill rig feed pressure drift — penetration rate and bit life reduced
Service truck engine load creep — fuel consumption increase only
How iFactory PdM Works — From Sensor to Maintenance Order
The value of predictive maintenance on a cement fleet is not the health score — it's the time between the signal and the planned intervention that replaces an unplanned breakdown. Every step in this loop is where AI-driven PdM recovers production time that calendar PM loses.
01
IoT Sensor Ingest
Engine ECU, wheel motor thermistors, tyre TPMS, hydraulic pressure transducers, and vibration sensors — all streaming via on-board telematics to the iFactory platform in real time.
02
Baseline & Normalise
Each machine's health signals normalised for load, ambient temperature, haul gradient, and payload. Drift detection runs against the machine's own baseline — not a fleet average or OEM spec sheet.
03
Fault Pattern Detection
AI model identifies fault signatures — bearing frequency patterns in vibration, temperature divergence from load-normalised baseline, hydraulic response time degradation — before they cross a hard alarm threshold.
04
Alert & Prioritise
Alerts ranked by production impact and estimated time-to-failure. Fleet manager sees "DT-12 wheel motor — 72-hour failure window, pull at shift change" — not just "high temperature on machine 12."
05
Planned Intervention
Maintenance order raised with fault attribution, parts list pre-populated, and repair window scheduled around shift pattern and haul plan. Unplanned breakdown becomes planned workshop visit.
Health Parameters Monitored — Per Machine Class
AI predictive maintenance is only as good as the signals it watches. These are the parameters iFactory monitors per equipment class — drawn from OEM telematics, on-board sensors, and in some cases retrofitted IoT devices where OEM data is not available.
Powertrain
Engine coolant temperature
Engine oil pressure & temperature
Transmission oil temperature
Torque converter slip & temp
Fuel burn rate vs load factor
Drivetrain & Wheels
Wheel motor temperature (all corners)
Bearing vibration signature (FFT)
Tyre pressure per wheel position
Tyre temperature per wheel position
Retarder temperature on gradient
Hydraulics
System pressure vs duty cycle
Return filter differential pressure
Hydraulic oil temperature
Cylinder response time drift
Pump flow vs pressure curve
Payload & Production
Payload per cycle (tonnes)
Cycle time (load to dump)
Passes per hour vs target
Fuel per tonne-km
Machine utilisation vs availability
Want to see what failure signatures are already in your fleet's OEM telematics data? Book a demo — bring three months of machine data and we'll show you what PdM would have caught.
What Fleet-Wide Predictive Maintenance Delivers
The return on predictive maintenance in a cement fleet is measured in the same currency as production: tonnes moved, kiln hours protected, and repair cost avoided. These are the outcomes cement and quarry operations see after moving from calendar PM to condition-based maintenance across their HME fleet.
25–35%
Fewer unplanned breakdowns
within 12 months of full fleet deployment
3–7 days
Failure warning lead time
enough to schedule parts, crew, and workshop slot in advance
15–20%
Tyre cost reduction
from pressure & temperature monitoring and load management
One view
Entire fleet
quarry and plant, every asset class, one live dashboard
Curious what predictive signals are already present in your fleet data? Talk to our mining and cement team — we'll benchmark your fleet health against operations we've seen.
Frequently Asked Questions
Does this require replacing our existing OEM telematics systems?
No. iFactory PdM ingests data from existing OEM telematics — Caterpillar Product Link, Komatsu KOMTRAX, Hitachi ConSite, Liebherr LiDAT, and others — via API or direct data export. Where OEM telemetry doesn't cover a specific sensor (such as individual wheel motor thermistors or bearing vibration on older machines), we can add lightweight IoT retrofit sensors that feed the same platform. You don't need a hardware replacement programme to start — you need to unlock the data your machines are already generating.
How does the AI know what "normal" looks like for each machine?
The baseline for each machine is built from its own operating history — typically 60 to 90 days of historical data from its telemetry system. The model normalises for load, ambient temperature, haul gradient, and payload, so it compares "this machine doing this kind of work in these conditions" rather than a fleet average or OEM design spec. A dumper that runs hotter under load at altitude has a different baseline than one running at sea level — and the drift detection reflects that.
Which failure modes does the AI predict most reliably?
The highest-confidence predictions in cement and quarry HME are wheel motor bearing failures (vibration + temperature divergence, typically 5–10 days' warning), hydraulic pump degradation (pressure-flow curve drift, 3–7 days), tyre failure risk (pressure and temperature trending, 1–3 days on heat events), and torque converter deterioration (slip and temperature patterns, 7–14 days). Engine failures are harder to predict with high confidence from ECU data alone — we typically use oil condition data combined with temperature trends where available.
Can the system handle a mixed-brand fleet?
Yes — this is one of the core reasons cement operations use iFactory rather than a single OEM's fleet management platform. A cement quarry typically runs Caterpillar dumpers, Komatsu dozers, Hitachi loaders, and Atlas Copco drills. Each OEM's telematics covers only its own machines and uses its own data format. iFactory normalises data across all OEM formats into a single health model per machine, so your fleet manager sees one dashboard regardless of the brand mix.
Can we pilot on a subset of machines before full fleet deployment?
Yes — and we recommend it. A typical pilot runs on 5 to 10 machines for 90 days: the machines with the highest breakdown history, the highest production consequence when they fail, or the largest portion of fleet operating hours. We connect to the existing telematics, build the baselines, and run the predictive models — showing every alert that fires during the pilot period and what the outcome was. Book a demo and bring your fleet list; we'll identify the best pilot candidates together.
Stop managing breakdowns. Start scheduling repairs.
See Live Fleet Health Monitoring on Your Cement Operation
Bring your fleet list and three months of machine data. We'll connect to your existing OEM telematics, build machine-specific health baselines, and show every predictive signal that is already present in your data — with estimated failure lead times and production impact ranked per asset.