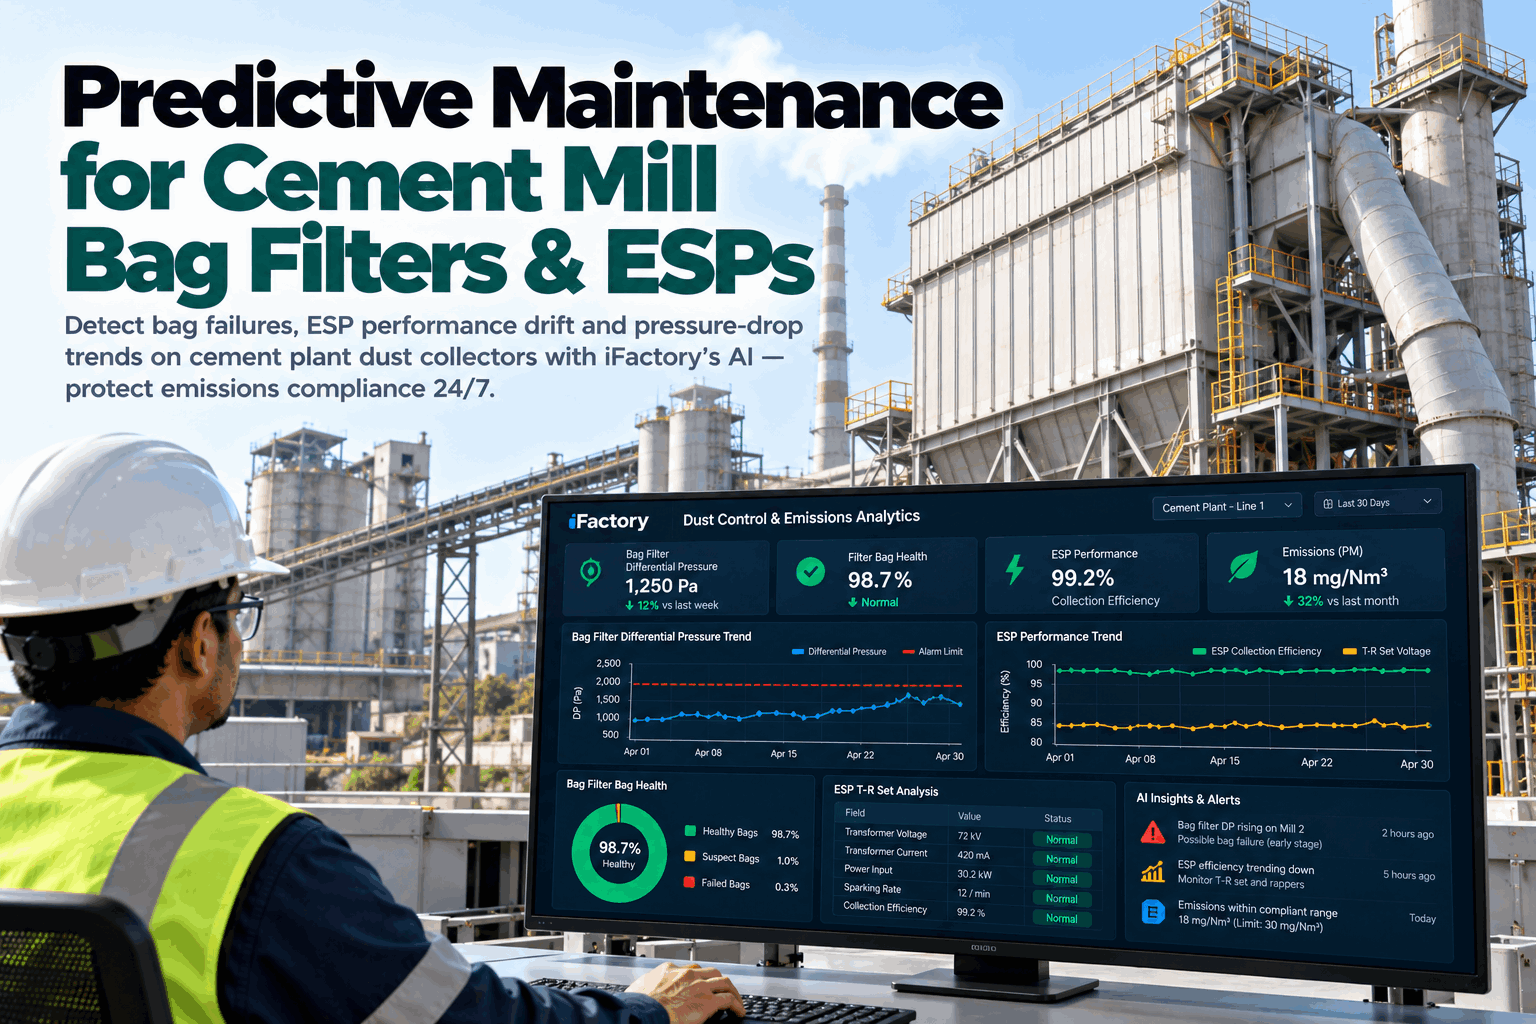
A cement plant's dust collectors rarely fail all at once. A bag tears, a pulse valve sticks, an ESP field starts sparking more, and the stack reading creeps up until it becomes a compliance problem. iFactory's Predictive Maintenance and Emissions Analytics watch bag filters and ESPs together, and flag the drift while there is still time to plan. To see it on your own collectors, book a dust control review.
Predictive Maintenance for Cement Mill Bag Filters and ESPs
Catch torn bags, blinding, failed pulse valves and ESP performance drift early, keep stack dust inside its limit, and plan repairs before an alarm forces a stop.
- How bag filters and ESPs fail, and the signal each failure gives
- How to read differential pressure, high and low
- Keeping emissions compliant, hour by hour
The marker is mill 2 today, at 118 mm WG. Your own design, dust and fabric set the real bands. A US filter supplier puts new bags near 1 inch of water, about 25 mm, and blinding near 5 to 6 inches.
Bag Filters and ESPs: How Each One Fails
Different machines, different failures, and each gives its own early signal.
Cement plants use bag filters on mills, coolers, packers and many kilns, and ESPs on older kilns and coolers. Both are reliable when looked after, and both usually fail slowly, in ways the plant's own data can already show. Our support team can map these signals to your collectors.
When stack dust rises, the cause could be a torn bag, a stuck valve, a hot gas spell, or an ESP field that has lost power. The plant's own data usually points clearly to which one it is. Reading them together saves hours of searching while the emissions clock is running.
Mills
Raw mill and cement mill bag filters. Heavy dust load, abrasive product, and the most bags on site.
Kiln and cooler
Main kiln bag house or ESP, and the cooler vent. Hot, variable gas, and the stacks regulators watch most.
Transfer and packing
Dozens of small filters at belts, silos and packers. Easy to forget, and often the source of visible dust.
Reading Differential Pressure the Right Way
Too high wastes fan power and starves the process. Too low often means a hole.
Differential pressure across the bags is the bag filter's main health number. Most plants only ever watch for it rising. Fewer watch for it falling, which can mean torn or missing bags letting dust straight through. The trend over days and weeks matters far more than any single reading on a gauge. To set up trend-based alerts, book a trend session.
Rising, slowly
- Normal ageing of the bags
- Cleaning losing ground over months
- Plan the rebag, order bags early
Rising, quickly
- Moisture or condensation on the bags
- Failed pulse valves or low cleaning air
- Check cleaning and gas temperature today
Falling suddenly
- Torn, missing or poorly seated bags
- Dust may be going straight to the stack
- Check leak detector and stack dust now
Swinging widely
- Cleaning set on a timer, not on demand
- Over-cleaning wears bags and strips the cake
- Review cleaning settings
Pulse cleaning needs dry air at the right pressure. Low header pressure leaves rows uncleaned, and water in the air wets the bags and helps them blind. Watching header pressure and each valve's firing catches both before the differential pressure trend shows it.
Over-cleaning is a common, hidden cost. The same supplier notes that bag wear comes largely from pulsing itself, so cleaning on demand rather than on a timer usually lengthens bag life.
A Planned Rebag Against a Rushed One
A forecast of when a compartment will blind turns an emergency order into a planned one. On bags alone, the difference is real money.
ESP Health From the Data It Already Gives
Every T-R set reports voltage, current and sparks. Together they tell the story.
An ESP's transformer-rectifier sets already log secondary voltage, secondary current and spark rate for each field. Compared with each field's own baseline, those three numbers show most ESP problems long before stack dust rises, and usually before anyone on the walk-round would notice. Ask our ESP specialists what your T-R controllers record today.
Voltage and current curve
Each field compared with its own healthy curve. A shift is the earliest sign of change.
Spark rate
Rising sparks with falling power point to build-up, rapping or resistivity trouble.
Back corona
Current up and voltage down together, typical of high-resistivity cement kiln dust.
Rapping
Rapper timing and effect, checked against each field's sparking after a rap.
Hoppers
High hopper level can short a field. Level and heater data flagged together.
Field trips
Each trip logged with what came before it, so repeat faults stand out.
Dust resistivity depends on temperature, moisture and gas chemistry. In a cement plant those move with kiln conditions and raw mix. The platform reads them alongside T-R data, so a field that weakens because of gas conditions is not mistaken for a mechanical fault.
When one field loses power, the fields behind it carry more dust and often spark more too. Looking at each field alone can send maintenance to the wrong place. The platform reads the whole ESP together and points to the field where the trouble started.
Emissions Compliance, Every Hour
The rules expect fast answers when dust rises. The data should already have them.
Limits and procedures differ by country and permit, but the pattern is the same: keep stack dust under the limit, detect leaks quickly, and show what was done, and when, after every alarm. Under the US cement rule, for example, a plant must start finding the cause of a leak alarm within 8 hours and fix it within 24. To align alerts with your permit, book a compliance session.
What the platform does
- Warns of drift before stack dust nears the limit
- Points to the likely cause when an alarm fires
- Logs each alarm, its cause and the fix, with times
- Keeps the history for audits and permit reviews
What stays with your plant
- Certified stack monitoring and its calibration
- Reporting to your regulator
- The decision to stop a mill or kiln
- Your permit and its conditions
The platform supports compliance. It does not replace certified emissions monitoring or the plant's own legal duties.
Where It Runs and Who Sees What
One view of every collector, on a server inside your plant.
Dust collector data is spread across the DCS, leak detectors, T-R controllers, stack monitors and compressed air systems. The platform reads them together, collector by collector, and runs on an NVIDIA server inside your network, so no plant data ever leaves the site. Our integration team can confirm what your systems already provide.
Data it reads
- Differential pressure, inlet temperature and fan data from the DCS
- Bag leak detectors on each stack or compartment
- Pulse valve signals and cleaning air pressure
- T-R set voltage, current and spark rate
- Stack dust and opacity monitors
What it gives back
- Health of every collector on one screen
- Forecast rebag dates by compartment
- Pulse valves and fields needing attention
- Work requests for your maintenance system
- An alarm and response log for compliance
When a mill or kiln stops, warm moist gas left in the collector can condense on cooling bags. The same supplier recommends purging with clean air for a few minutes at shutdown. The platform flags stops where temperature fell through the dew point with gas still in the housing.
One set of data, three views
- Control room. Live collector health and the cause behind any alarm.
- Maintenance. Valves, bags and fields to fix, ranked by risk.
- Environment manager. Stack dust trend and the compliance log.
The platform advises. Your team decides and acts.
Turnkey AI: Delivered, Connected and Live in 6–12 Weeks
You do not build this. It arrives ready.
iFactory ships as a pre-configured NVIDIA AI server, racked and ready, with the software pre-loaded. Rack it, plug in power and Ethernet, and the AI is live on your network.
Our team handles cabling, network setup, PLC and SCADA integration, operator training and 24×7 remote monitoring. The server sits inside your own network, so process and emissions data stay on site. For a scope matched to your plant, request a turnkey quote.
Ship, network and data
Server installed. DCS, leak detectors, T-R controllers and stack monitors connected for the first collectors.
Model training and pilot
Normal behaviour learned for each compartment and field. First alerts checked on site by your team.
Go-live and training
All collectors added. Control room, maintenance and environment staff trained. 24×7 remote monitoring begins.
Frequently Asked Questions
Can AI find a torn bag?
It can usually find the compartment, and often the row. A torn bag shows as a leak detector spike right after its row is pulsed. Combined with pulse valve data, that narrows the search from hundreds of bags to a few. Maintenance then goes straight to the right row, instead of checking a whole compartment by hand.
Why watch for differential pressure falling?
Because a sudden fall can mean torn or missing bags letting dust bypass the fabric. Most plants alarm only on high pressure, so a falling reading can go unnoticed for days. A fall alongside a rising leak detector reading is a strong sign of a hole.
What does it watch on an ESP?
Secondary voltage, secondary current and spark rate for each field, compared with that field's healthy pattern, plus rapping, hopper level and gas conditions. Together they point to back corona, rapping faults, build-up or electrical failures, and to which field needs attention first.
Can it predict when to rebag?
Yes, from the trend in differential pressure and how well cleaning recovers it. The forecast gives a rebag window by compartment, early enough to order bags at normal lead times rather than rush prices, and to fit the work into a planned mill stop.
Does it replace our stack monitor?
No. Certified stack monitoring stays as it is. The platform reads it alongside collector data, warns earlier, and helps explain changes. Reporting to the regulator remains the plant's responsibility. What changes is that the team usually knows why dust rose before anyone asks.
Do we need new sensors?
Often not. Differential pressure, temperature, leak detector and T-R data are usually already available. Pulse valve monitoring or extra pressure points may be added where they would pinpoint faults faster, usually on the largest mill and kiln collectors first.
How long does it take to go live?
Six to twelve weeks from delivery. We need a place for the server, read access to the DCS, leak detectors, T-R controllers and stack monitors, and a year of history if you have it. To check your set-up first, contact our team.
Bring Three Months of Collector Data
In thirty minutes we look at one bag filter or ESP: its pressure, leak and electrical trends, and where they point. You keep the findings whether or not you go further with iFactory.
- 1Differential pressure and inlet temperature trends
- 2Bag leak detector readings and alarms
- 3T-R set voltage, current and spark data
- 4Your last two rebag dates and bag type
- 5Your permit's dust limit and alarm rules