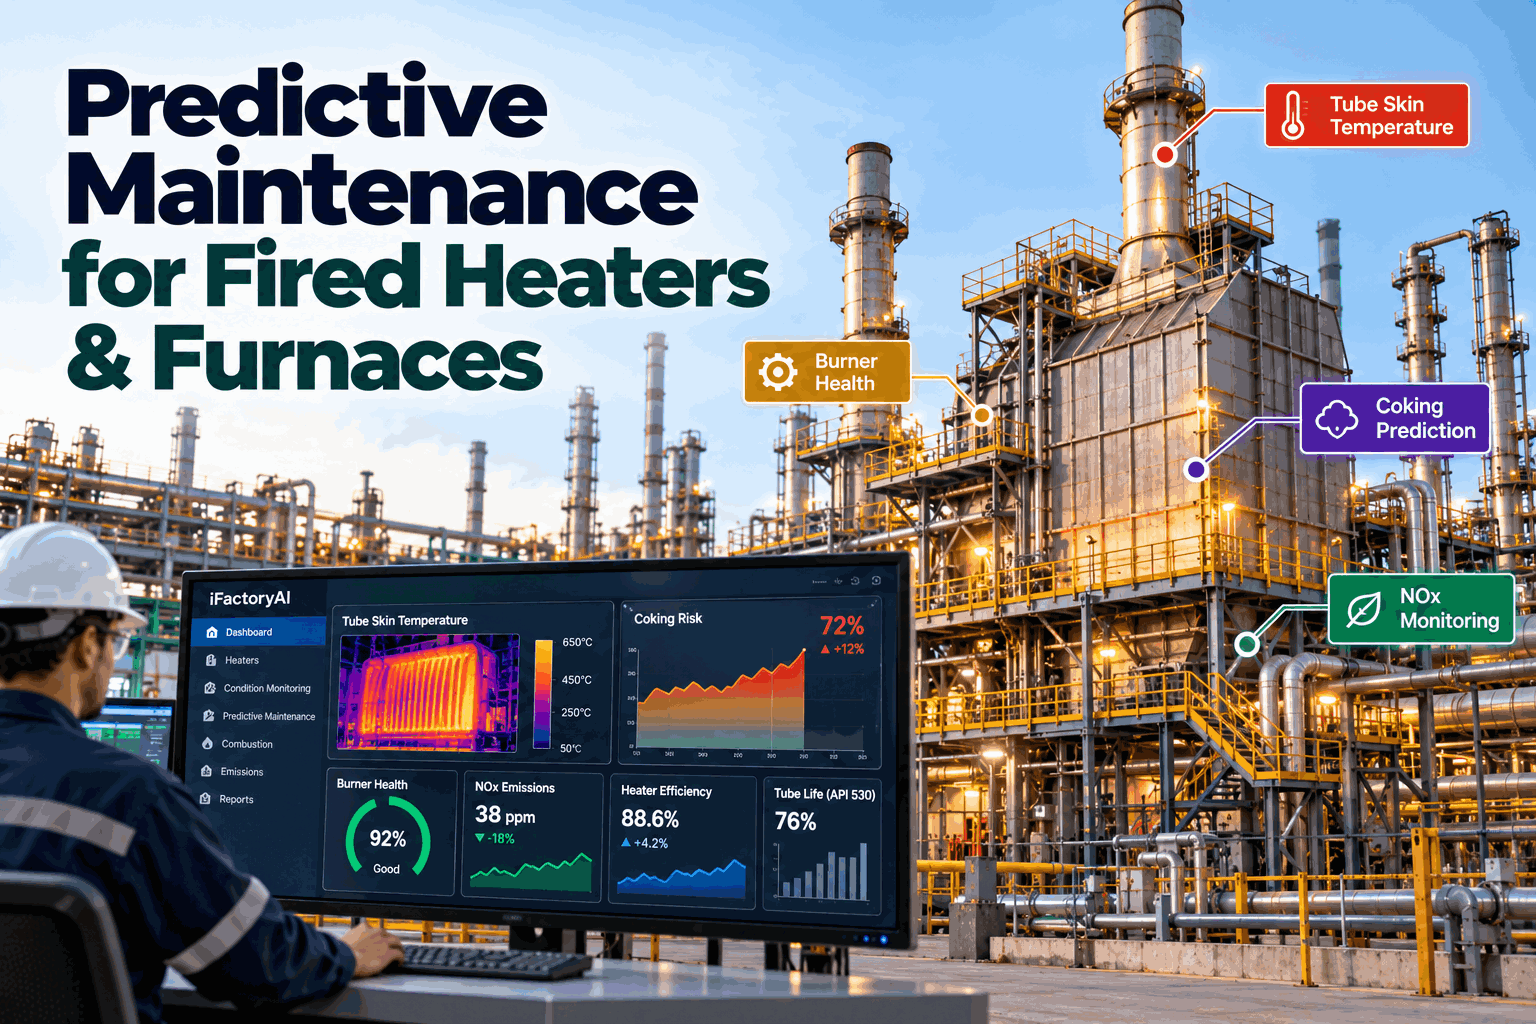
Ask a refinery how its fired heaters are doing and you will usually hear about the last inspection and the planned decoke date. That view hides almost everything that matters between shutdowns. One pass runs hotter than the others as coke builds inside the tubes, a burner drifts and puts a flame against a tube, excess oxygen creeps up and wastes fuel, and tube skin temperatures spend more hours near the limit than anyone realised. Continuous analytics on skin temperature, pass balance, burner health and combustion shows these developing, so teams act on a trend instead of a trip. See it in a fired heater demo.
Predictive Maintenance for Fired Heaters and Furnaces
Live tube skin temperature, coking, burner and combustion analytics for every heater. AI separates coking from operating changes, projects run length and supports tube life tracking in line with API 530 methods.
- How skin temperature trends reveal coking, with a worked example
- Burner health, flame impingement and combustion losses
- Tube life tracking that supports API 530 assessments
Why Periodic Checks Miss Heater Problems
Heaters change slowly between inspections, then fail quickly.
Coking, tube creep and burner drift all build up over weeks. Operator rounds and occasional pyrometer readings catch snapshots, not trends, and a single reading cannot say whether a hotter tube is coking or simply running at higher throughput. By the time the problem is obvious, the choices are an early shutdown, a derate or a tube failure. Our refinery reliability specialists can review how you monitor heaters today.
Spot readings
Snapshots miss slow trends.
Mixed causes
Coking and load changes look alike.
Tube life by estimate
Hours at temperature rarely tracked.
Found at decoke
Damage seen only when the heater is opened.
Projecting Run Length: A Worked Example
A trend, adjusted for operating conditions, gives a date.
Take one pass of a crude heater. The maximum skin temperature has been rising at steady feed rate and firing, and the design limit is 650 °C. Dividing the remaining margin by the rate of rise gives the weeks left before the limit. All figures are illustrative. Run the numbers for your heaters in a working session.
Skin temperature rises when throughput or firing rises, even with clean tubes. Adjusting for feed rate, feed temperature, firing and fuel quality separates a true coking trend from an operating change, so the projected date means something.
The Heater Problems Inside Each Signal
Every signal points to a specific problem.
Reliability teams already know these failure modes. Tracking them continuously, with a trend and a date, turns a gut feel into a work plan. Map your instruments and limits with our implementation team.
Skin thermocouples drift, fail and read unevenly across passes. Flagging readings that disagree with their neighbours, or with the physics of the heater, keeps a bad sensor from being mistaken for a tube problem or hiding a real one.
Coking Detection and Decoke Planning
Decoke when the data says so, not only when the calendar does.
Coking shows up as a pattern: skin temperature climbing in one pass, pass pressure drop rising, and outlet temperatures drifting apart. Seen together and normalized, those signals show how fast coke is building and which passes need attention. That lets teams plan decoke timing and feed or firing changes in advance. Review your coking data with our reliability team.
Temperature rise
Hotter tubes at the same firing and feed.
Pass pressure drop
More resistance as coke narrows the tube.
Pass imbalance
One pass running hotter than its peers.
Feed effects
Heavier or fouling feeds raising coking rate.
See Every Heater's Condition While It Is Running
Skin temperatures, coking trends, burner health and combustion for every heater, with run length projected and the biggest risk named.
Burner Health and Flame Impingement
One poor burner can overheat a tube.
Burners fail slowly. Tips foul, air registers stick, fuel pressure drifts and a flame leans toward a tube. The result is a hot spot that average readings hide, and that shortens tube life. Comparing burners with each other, and hot spot patterns on skin readings with firing patterns, points maintenance to the burner that needs cleaning or adjustment. Plan burner monitoring with our combustion team.
Fouled burner tips
Fuel pressure rising for the same duty.
Register faults
Air supply not matching firing.
Impingement risk
Hot spots lining up with a burner.
Burners off
Firing shifted onto neighbours.
Tube Life and API 530 Support
Better data for the people who make the assessment.
Tube life depends on how long tubes spend at temperature and pressure. Continuous skin temperature history, hours above thresholds and operating records give engineers a much fuller basis for remaining life work than occasional readings do. The data supports calculations in line with API 530 methods. The assessment itself remains with your inspection and materials engineers. Talk through the data you would need with our specialists.
What the system tracks
- Skin temperature history per tube and pass
- Hours above set temperature thresholds
- Operating conditions around each excursion
- Trends since the last inspection
What stays with your engineers
- Remaining life and fitness-for-service decisions
- Material properties and design data
- Inspection findings and acceptance criteria
- Run, derate and shutdown decisions
Efficiency and NOx: Combustion Beyond Tube Protection
The same data also shows where fuel is wasted.
Excess air carries heat up the stack, while too little air raises CO and risks unstable flames. Tracking oxygen, stack temperature and draft against firing shows the best operating window for each heater and where it drifts out. NOx follows the same signals, so one view supports both fuel savings and emission control. Review combustion data with our optimization team.
Is excess air too high?
Flue gas O2 against firing rate and burner count.
Is heat leaving the stack?
Stack temperature trends from fouled convection sections.
Why is NOx drifting?
Emissions against O2, firing pattern and fuel.
From Signal to Work Order
A trend only helps if someone acts on it.
When a heater trend crosses a set point, the system links the evidence to the equipment and raises it for planning, so the work arrives with context instead of a bare alarm. Plan the flow with our CMMS integration team.
Signal
Skin, flow, firing and flue gas read live.
Normalize
Operating changes separated from fouling.
Project
Weeks to limit calculated per pass.
Alert
Owner notified with the evidence.
Plan
Work order or decoke timing set.
AI That Names the Biggest Risk
Not just a trend, but what it means.
The AI watches every heater through the shift and highlights the one most likely to cost run length, fuel or tube life. It compares with the same heater at earlier points in its run and with similar heaters, and points to likely causes such as coking, a burner imbalance or excess air. Ask our AI team how it works on your data.
Heater Monitoring Mistakes to Avoid
Heater data is easy to collect and easy to misread.
These are common problems when refineries start analyzing heater data. A short readiness review can avoid them.
What works
- Trends normalized for feed and firing
- Skin readings checked for bad sensors
- Burners compared with each other
- Alerts that carry evidence and an owner
What fails
- Raw skin temperature alarms only
- Averages hiding the hottest tube
- Tube life guessed from calendar time
- Decoke dates fixed regardless of data
How iFactory Runs Fired Heater Analytics
Heater reliability and combustion, on your own network.
iFactory reads skin temperatures, pass flows and pressures, burner signals, flue gas analyzers and firing data, normalizes them, projects run length, flags burner and combustion issues and raises work with its evidence. It runs on an on-prem AI server inside your refinery, using data from your DCS and historian. Fit questions go to our solutions team.
Coking trends
Normalized skin and pressure drop.
Run length projection
Weeks to limit for each pass.
Burner and flame alerts
Imbalance and hot spot warnings.
Combustion AI
Excess air, stack loss and NOx.
Tube life data
Hours at temperature for API 530 work.
On-prem
Process data stays in the refinery.
The figures on this page are worked examples. Your own heater behavior depends on your feeds, tube metallurgy, burners and practices, and we measure it on your data during the pilot. Tube life and fitness-for-service decisions remain with your qualified engineers.
Turnkey AI: Delivered, Connected and Live in 6–12 Weeks
You do not build this. It arrives ready.
iFactory ships as a pre-configured NVIDIA AI server with the software pre-loaded, racked and ready. Rack it, plug in power and Ethernet, and the AI is live on your network. Our team handles cabling, network setup, PLC, SCADA, DCS and CMMS integration, historian links, operator training and 24×7 remote monitoring. Data stays on your network. For a scope matched to your refinery, request a turnkey quote.
Ship, network and data
Server installed. Skin temperatures, flows, pressures and analyzers connected.
Model training and pilot
Heater models and limits set up. Live analytics run on one or two heaters.
Go-live and training
Analytics live across heaters with work order links. Teams trained. 24×7 monitoring begins.
Frequently Asked Questions
How does AI detect coking in a fired heater?
By watching skin temperature, pass pressure drop and pass balance together, adjusted for feed rate and firing, so a coking trend is separated from an operating change.
Can it predict when a heater will reach its limit?
It projects the weeks to a set limit from the normalized trend, and updates the date as new data arrives. It is a planning aid, not a guarantee.
Does it replace API 530 calculations?
No. It supplies continuous temperature history and operating data that support calculations in line with API 530 methods. The assessment stays with your engineers.
What if our skin thermocouples are unreliable?
The system flags readings that disagree with neighbouring sensors or heater physics, so bad sensors are fixed rather than trusted.
Can it help with burner problems?
Yes. It compares burners with each other and with hot spot patterns on skin readings, and flags drift in fuel pressure, air and flame signals.
Does it track NOx and efficiency?
Yes. Flue gas oxygen, stack temperature, draft and NOx are tracked against firing, showing the best operating window for each heater.
Where does the data come from?
From your DCS and historian, plus analyzers and burner signals already in the plant. Extra sensors are only added where a heater is not measured.
Where is the data stored?
On the on-prem server inside your refinery, shown on dashboards for reliability, operations and management.
How do we start?
Start with one or two heaters. A 6-week pilot connects data, sets limits and runs live analytics. To plan it, contact our team.
Find Your Heaters' Biggest Risks Before the Next Shutdown
In thirty minutes we look at your current heater monitoring and data, and show what live analytics would reveal. You keep the notes either way.
- 1Your fired heater list and services
- 2Skin temperature and run history
- 3Design limits and last inspection findings
- 4Decoke dates and run lengths
- 5The heater that worries your team most