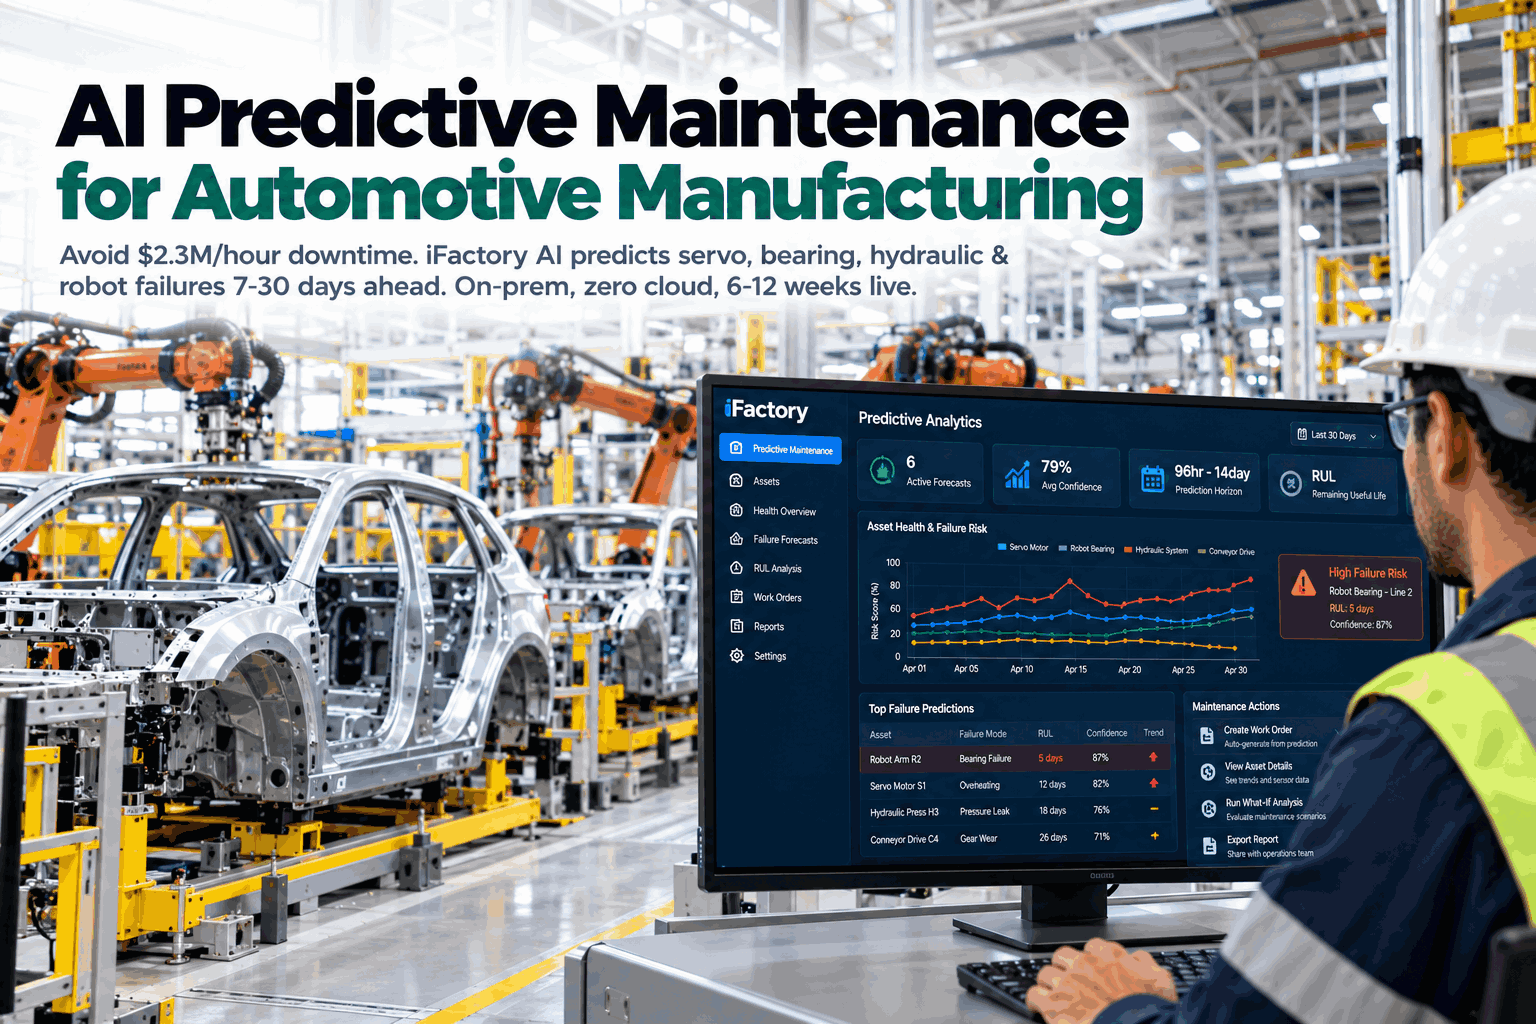
In a car plant, one failed robot reducer or press pump can stop a whole line, and the cost runs by the minute. Most of those failures give warning first, in current, vibration, pressure or temperature. iFactory's Predictive Analytics reads those signals, forecasts which assets will fail and roughly when, and turns each forecast into a planned repair. To see it on your own lines, book a PdM demo.
AI Predictive Maintenance for Automotive Manufacturing
Forecast servo, bearing, hydraulic and robot failures days ahead, with a confidence score and remaining useful life for each, and fix them in planned stops instead of during production.
- What fails in an automotive plant, and how it warns
- How to read a forecast, its confidence and its remaining life
- On-premise, on the equipment you already have
Axis 4 torque and temperature start to move from their normal pattern.
The change holds. Failure forecast in about 11 days, confidence 81%.
Reducer and fitters booked. Spare confirmed in stores.
Changed in the weekend stop. No vehicles lost.
The forecast date, during a full production shift.
The value of prediction is the gap between "first seen" and "would have failed". The wider it is, the more of each repair can be planned.
The $2.3 million figure is for a large automotive plant as a whole, from survey data covering 2019 to 2023. A single line or a smaller supplier plant will cost less per hour, but the pattern is the same: unplanned stops cost far more than planned ones.
What Fails in an Automotive Plant, and How It Warns
Most costly failures announce themselves. The question is whether anyone is listening.
Robots, presses, conveyors and paint shop fans tend to fail in a handful of familiar ways, and each has its own early signal. Many of those signals are already recorded by the robot controller, drive or PLC. Others need a vibration or temperature sensor in the right place. Our support team can map these to your equipment.
Three kinds of data, one forecast
Controller data
What robots, drives and PLCs already log: torque, current, temperature and cycle times. Often enough for robots and servos.
Added sensors
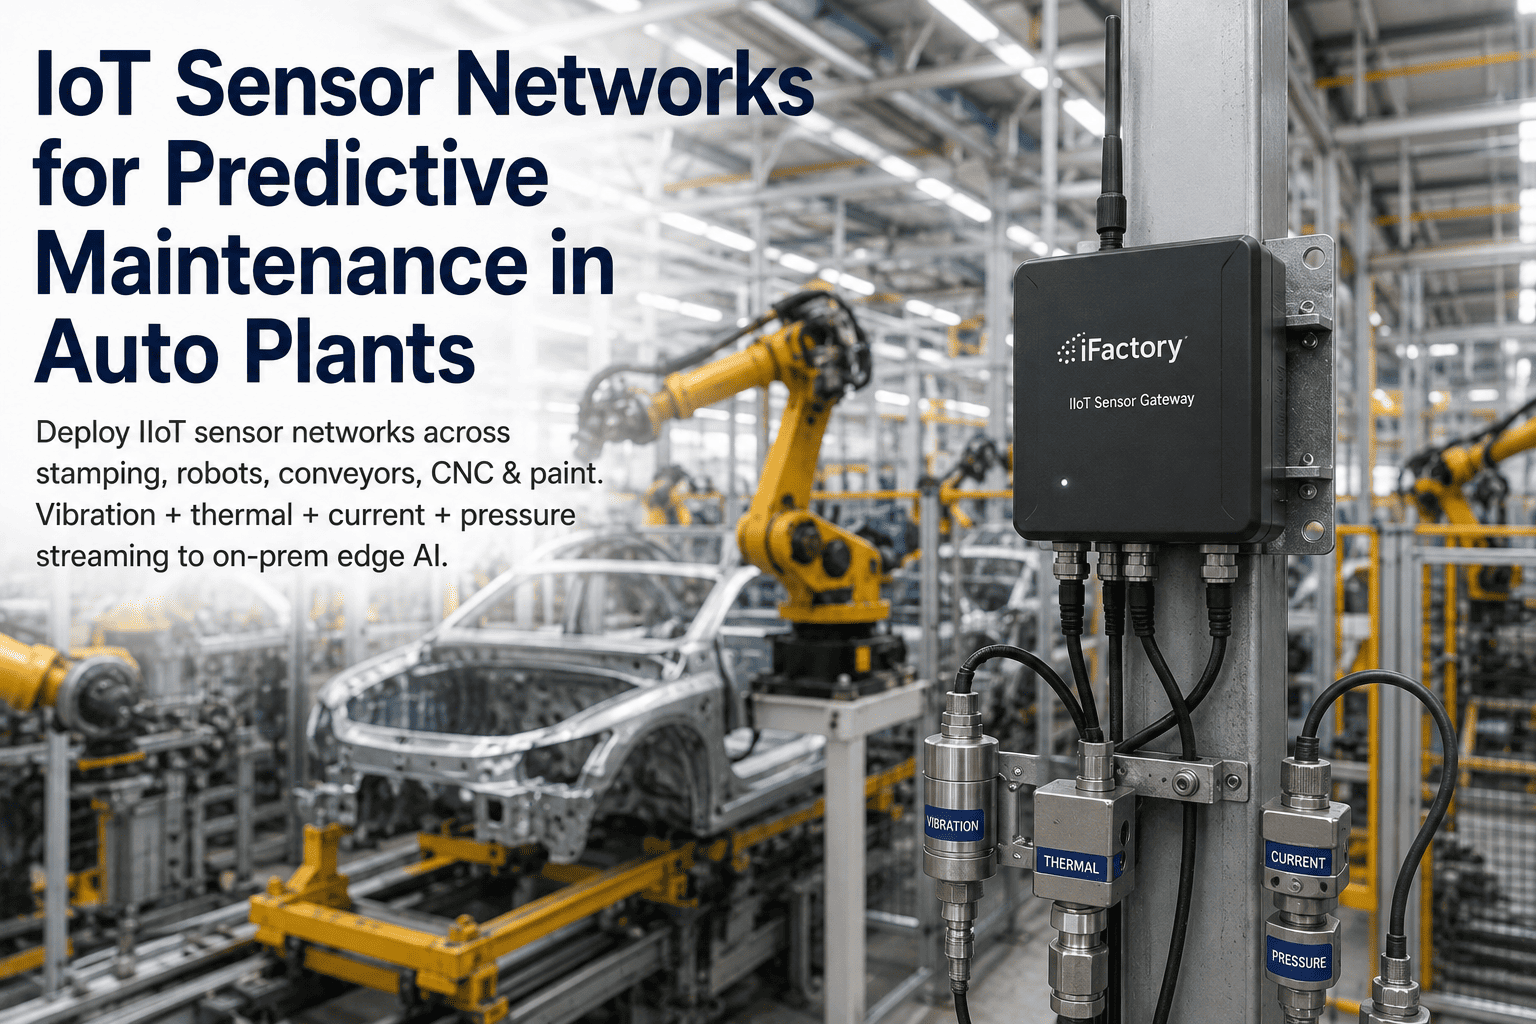
Vibration and temperature where nothing else sees the fault, mostly bearings in fans, spindles and gearboxes.
Maintenance history
What failed before, when and why. It teaches the model what a real failure looked like on your equipment.
A sudden fracture or a part falling into a machine gives no warning that any model can read. Predictive maintenance covers wear-out failures, which build over days or weeks. Planned inspection and good design still cover the rest. An honest PdM programme says which is which.
Forecasts, Confidence and Remaining Useful Life
Three numbers on every forecast: which asset, how long it has left, and how sure the model is.
A forecast is only useful if a planner can act on it. Each one names the asset and the likely failure, gives a remaining useful life in days, and shows a confidence score. The forecast window runs from about four days to two weeks, depending on how fast that failure develops. To see forecasts built from your own data, book a forecast review.
Remaining useful life
The model's best estimate, in days, of how long the asset will keep running at its current rate of wear.
Confidence
How sure the model is, from how closely this pattern matches past failures. Higher means fewer false alarms.
Evidence
The signals behind the forecast, shown as trends, so an engineer can check the reasoning.
How planners use the three
- Plenty of time, high confidence. Book the repair in the next planned stop.
- Plenty of time, lower confidence. Watch, and check it on the next walk-round.
- Little time, high confidence. Act now, and line up cover for the line.
- Little time, lower confidence. Inspect today to confirm or clear it.
What confidence does not mean
- 79% is a likelihood, not a promise
- A low score is a reason to look, not to ignore
- Confidence rises as the model sees more of your failures
- Every forecast shows its evidence, so people can judge it
Each asset starts with a model of its own normal behaviour, learned over the first weeks. Forecasts then come from how far and how fast it moves away from that normal, compared with failures seen before. Every confirmed repair, and every false alarm, is fed back, so the forecasts get sharper the longer it runs.
What One Planned Repair Protects
The same reducer change costs very different amounts depending on when it happens. Here it is in vehicles, not dollars.
On-Premise, Brownfield, No Rip-and-Replace
Your robots, drives and PLCs already know a lot. Start there.
Most automotive plants run a mix of robot brands, press controls and drives from different years. The platform reads what they already record, adds sensors only where a key signal is missing, and runs on an NVIDIA server inside your network. No production data goes to the cloud, and nothing in the robot or PLC programmes is changed. Ask our integration engineers what your equipment already provides.
Data it reads first
- Robot controller data: torque, current, temperature by axis
- Drive and servo data: current, speed, following error
- PLC signals: cycle times, pressures, alarms
- Maintenance history from your CMMS
Added only where needed
- Vibration sensors on fans, spindles and gearboxes
- Temperature sensors on key bearings and motors
- Pressure sensors on older hydraulic presses
- Chosen for the assets whose failure costs most
Production rates, robot programmes and failure history are commercially sensitive, and many plants do not allow line data to leave the site. Running the models on a local server keeps that data inside your network, and keeps forecasts working even if the outside connection is lost. It also means forecasts run at plant speed, close to the equipment they watch.
From Forecast to Work Order
A forecast prevents nothing until a fitter has the part and a slot.
The hardest part of predictive maintenance is not the model. It is turning each forecast into planned work, with the right part, people and time. The platform links forecasts to your maintenance system so that happens the same way every time. To map this to your current process, book a workflow session.
Forecast
Asset, likely failure, remaining life and confidence, with the evidence.
Confirm
An engineer reviews the trend, or checks the asset on the floor.
Work order
Raised in your CMMS with the forecast attached.
Parts check
Spare located, or ordered in time for the planned slot.
Planned stop
Repair booked into the next stop before the forecast date.
Learn
What the fitters found goes back to the model, so the next forecast is sharper.
A PdM programme should count three things every month: forecasts that proved right, alerts that turned out to be nothing, and failures it missed. All three are shown on the platform. They are how a plant decides whether to trust the forecasts, and where to add data.
Where to Start, Shop by Shop
Start with the assets whose failure stops the most vehicles.
A first pilot works best on a small set of critical assets with known failure history and good data. Each shop has its own obvious first candidates. Our PdM specialists can help you pick the first ten. Ten well-chosen assets, followed closely, prove more than a hundred watched loosely.
Press shop
Main hydraulic pumps, transfer servos and press drive bearings. Few assets, very high cost when one stops.
Body shop
Robot reducers on high-duty axes, weld guns and conveyor drives. Many similar robots, so models learn fast.
Paint shop
Supply and exhaust fans, circulation pumps and oven burners. Failures hurt quality as well as uptime.
Assembly
Conveyor drives, lift platforms and torque tools. A single stop holds up the whole paced line.
Once the first assets have forecasts the planners trust, widen in steps: the same asset type across the plant first, because the models carry over, then the next shop. Tier 1 suppliers often start with their press and moulding lines, OEMs with body shop robots.
One set of forecasts, three views
- Maintenance planner. Forecasts ranked by date and confidence, ready to schedule.
- Reliability engineer. The evidence behind each forecast, and model accuracy.
- Plant manager. Failures avoided and vehicles protected, month by month.
The platform forecasts. Your team decides and does the work.
Turnkey AI: Delivered, Connected and Live in 6–12 Weeks
You do not build this. It arrives ready.
iFactory ships as a pre-configured NVIDIA AI server, racked and ready, with the software pre-loaded. Rack it, plug in power and Ethernet, and the AI is live on your network.
Our team handles cabling, network setup, PLC and SCADA integration, operator training and 24×7 remote monitoring. The server sits inside your own network, so line and maintenance data stay on site. For a scope matched to your plant, request a turnkey quote.
Ship, network and data
Server installed. Robot controllers, drives and PLCs connected for the pilot assets. Maintenance history loaded.
Model training and pilot
Normal behaviour learned for each asset. First forecasts checked on the floor by your engineers.
Go-live and training
Forecasts linked to your CMMS. Planners and engineers trained. 24×7 remote monitoring begins.
Frequently Asked Questions
How far ahead can failures be predicted?
It depends on the failure. Forecasts typically run from about four days to two weeks ahead. Slow wear on bearings and reducers gives the longest warning. Fast faults give less, and sudden breakages give none. The forecast always shows its own window, so planners know how much time they have to work with.
What does the confidence score mean?
It shows how closely the current pattern matches failures the model has learned from. A high score means the forecast is likely to be right. A lower one is a reason to inspect and confirm. Scores improve as the model sees more of your own failures.
Do we need new sensors?
Often not to start. Robot controllers, drives and PLCs already record torque, current, temperature and cycle times. Vibration or temperature sensors are added only where an important signal is missing, usually on fans, spindles and gearboxes.
Does it work with mixed robot brands and older equipment?
That is the usual case in a brownfield plant. The platform reads each controller and drive through its own interface, and older equipment can be covered with added sensors. Every asset ends up in one list of forecasts, ranked the same way, whichever brand or year it is.
Does it connect to our CMMS?
Yes. Forecasts can raise work orders in your maintenance system with the evidence attached, so planners work in the tools they already use. What the fitters find is fed back to improve the model, so a confirmed fault and a false alarm both teach it something.
Does any data go to the cloud?
No. The models run on a server inside your network, and line data stays on site. The platform keeps forecasting even if the outside connection is lost.
How long does it take to go live?
Six to twelve weeks from delivery for a first set of assets. We need a place for the server, access to robot controllers, drives and PLCs, and your maintenance history. To check your set-up first, contact our team.
Bring Your Last Ten Breakdowns
In thirty minutes we look at your recent unplanned stops, which of them gave warning signs, and which data would have caught them. You keep the review whether or not you go further with iFactory.
- 1Your last ten unplanned breakdowns
- 2The assets you fear most, by shop
- 3Robot, drive and PLC makes and ages
- 4An export from your maintenance system
- 5Your planned stop calendar