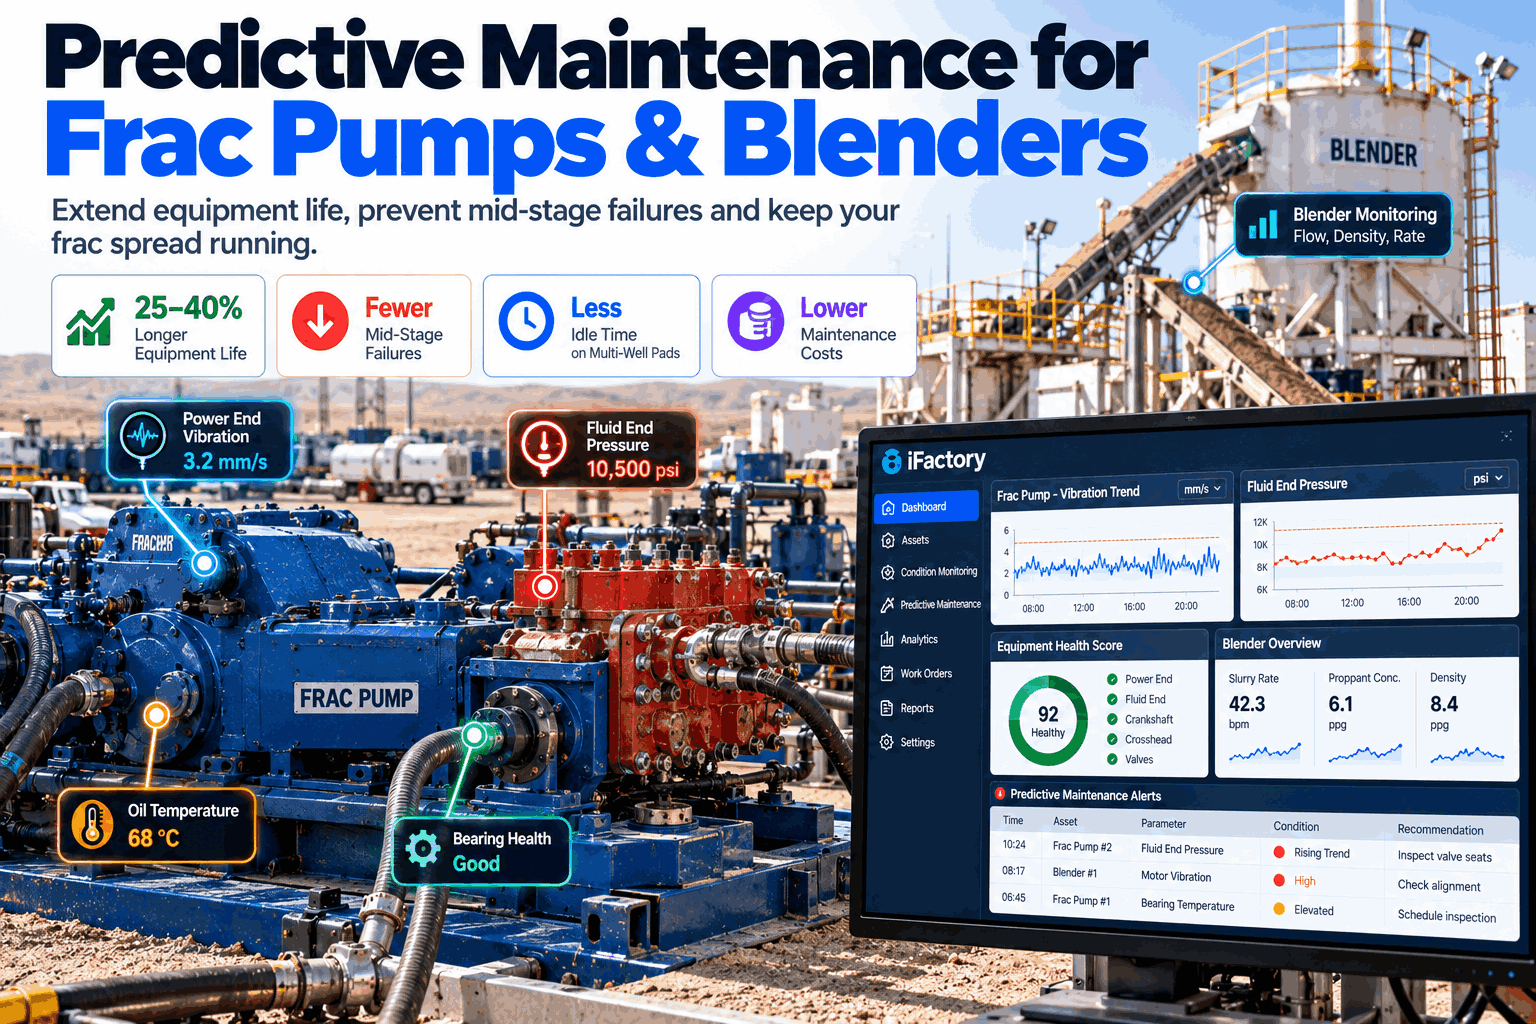
A frac pump does not fail politely. It fails on stage 18 of 42, with the pad fully rigged up, the crew on the clock and the sand already in the blender. Most fluid-end and power-end failures leave a trail in vibration and pressure data long before that moment. Predictive maintenance reads that trail and tells the crew which unit to swap between stages, not during one. To see it on your own fleet data, book a reliability walkthrough.
Predictive Maintenance for Frac Pumps and Blenders
Vibration and pressure signals from every pump, blender and iron manifold feed one AI engine. It tracks wear, counts load cycles and flags the unit most likely to fail, so repairs move to planned windows between stages.
- How vibration and pressure signals predict power-end and fluid-end wear
- How to rank failures by downtime and by cost
- How leads turn into swaps between stages, not mid-stage
Three failure types make up four fifths of the lost hours. The dashed line marks where the cumulative share passes 80%. Hours are only one view, as the cost section below shows.
From Run-to-Failure to Predicted Wear
A frac fleet runs at its limits. Wear is the cost of doing business, so the goal is to see it early.
Frac pumps run at high pressure and high rate for hours, with heavy abrasive slurry in the fluid end. Fixed-hour change-outs are safe but wasteful, because a unit that has had an easy job is changed as early as one that has had a hard job. Run-to-failure is the opposite, and it costs the most when it happens mid-stage. Condition-based decisions sit in between. Our reliability team can show what your current data already supports.
Power end
Bearings, gears and crosshead tracked by vibration.
Fluid end
Pressure cycles and peaks counted toward fatigue life.
Valves and seals
Pressure ripple and pulsation show leaking valves early.
Swap windows
Units ranked for the next gap between stages.
A vibration reading means little without the rate, pressure, proppant and stage it came from. Store the job context with every signal, so a hard stage is not mistaken for a failing pump.
What the Signals Tell You
Each signal points to a different part of the pump.
No single sensor explains a failure. Vibration says what is happening in the power end. Discharge pressure says what is happening in the fluid end. Together with rate, temperature and lube data, they separate a normal hard stage from a wearing component. To plan sensor coverage for your fleet, book a sensor planning call.
Compare a pump with its own past stages at the same rate and pressure, and with its neighbours on the same pad. A change against its own baseline is a stronger lead than a fixed alarm limit.
What One Mid-Stage Failure Costs
An unplanned failure costs more than the part. The crew waits, the stage is delayed and the rest of the fleet runs while one unit is down.
Blenders, Manifolds and the Rest of the Spread
One weak link can stop the whole fleet.
Blenders, chemical units and iron are not as busy as pumps, but they stop the job just as fast. A blender that starves the pumps causes suction trouble across the fleet, and a worn manifold union is a safety event waiting to happen. The same engine watches the supporting equipment with the same baseline method.
Blender and chemical units
- Discharge and tub pump vibration trends
- Flow and pressure against the rate setpoint
- Early warning of suction starvation
Iron and manifolds
- Pressure pulsation along the treating line
- Pressure cycle count per component
- Inspection due dates raised from real use
Each lead should end with a recorded outcome: part replaced, no fault found, or still open. Over time that record shows which signal patterns really lead to failures, and the engine gets sharper for your own fleet.
Between Stages, Not During Them
A prediction only helps if it reaches the crew in time.
Frac jobs run on tight windows, so a lead has to arrive as a clear instruction: which unit, which part, and when. The engine links to the maintenance system and parts stock, so the swap is ready when the gap comes.
Sense
Vibration and pressure streamed from every unit.
Baseline
Each pump compared with its own history.
Predict
Wear and remaining life estimated.
Rank
Units ordered by risk and by cost.
Plan
Swap and parts set for the next gap.
Verify
Signals checked after the repair.
How iFactory Predictive Maintenance Engine Works
Raw signals in, planned swaps out.
iFactory's Predictive Maintenance Engine collects vibration, pressure and job data from pumps, blenders and iron. It sets a baseline for each unit, tracks wear and cycle counts, ranks units by risk and cost, and sends planned work to your crew and maintenance system. Questions on fit go to our support desk.
Every signal
From pump sensors, blender controls and the data van.
Wear and cycles
Baselines per unit, by job and by stage.
Clear leads
Each lead shown with its evidence.
Work orders
Swaps and parts planned before the next gap.
Life gains depend on your pump models, job mix, fluids and how quickly leads are acted on. We measure them on your own data during the pilot, rather than promising a general figure.
Turnkey AI: Delivered, Connected and Live in 6–12 Weeks
You do not build this. It arrives ready.
iFactory ships as a pre-configured NVIDIA AI server with the software pre-loaded. Rack it, plug in power and Ethernet, and the AI is live on your network. Our team handles cabling, network setup, PLC and data van integration, crew training and 24×7 remote monitoring. Data stays on your own network. For a scope matched to your fleet, request a turnkey quote.
Ship, network and data
Server installed. Pump signals, job data and the maintenance system connected for the pilot fleet.
Prediction pilot
Baselines built and leads checked with your field and maintenance teams.
Go-live and training
Alerts and work orders switched on. Crews trained. 24×7 remote monitoring begins.
Frequently Asked Questions
What is predictive maintenance for frac pumps?
It is the use of vibration, pressure and job data to estimate the wear state of each pump and part, so repairs are planned between stages instead of after a failure.
Which signals matter most?
Power-end vibration and discharge pressure give the strongest early signs. Suction pressure, lube data and pressure cycle counts add detail.
Can it work with our existing sensors and data van?
Usually, yes, if the signals can be streamed or exported with a time stamp. Extra sensors can be added on units that lack coverage.
How is fluid-end life tracked?
By counting pressure cycles and peaks for each fluid end, together with pumped hours and fluid type, rather than by calendar days alone.
Does it help on multi-well pads?
Yes. Pads run many stages back to back, so a swap planned between stages saves more idle time than the same failure in the middle of one.
How do we start?
With one fleet or pad that has a recurring failure worth solving. A 6-week pilot connects the signals, builds baselines and checks the leads with your team. To plan it, contact our team.
Fewer Mid-Stage Failures, More Pumped Hours
In thirty minutes we look at the signals you already collect, the failures that cost you most and how leads could reach your crews. You keep the notes whether or not you go further with iFactory.
- 1A few weeks of pump vibration and pressure data
- 2Your pump models and fluid-end types
- 3Recent failure and repair records
- 4Rough cost of a failure and of idle fleet time
- 5The reliability questions you cannot answer today