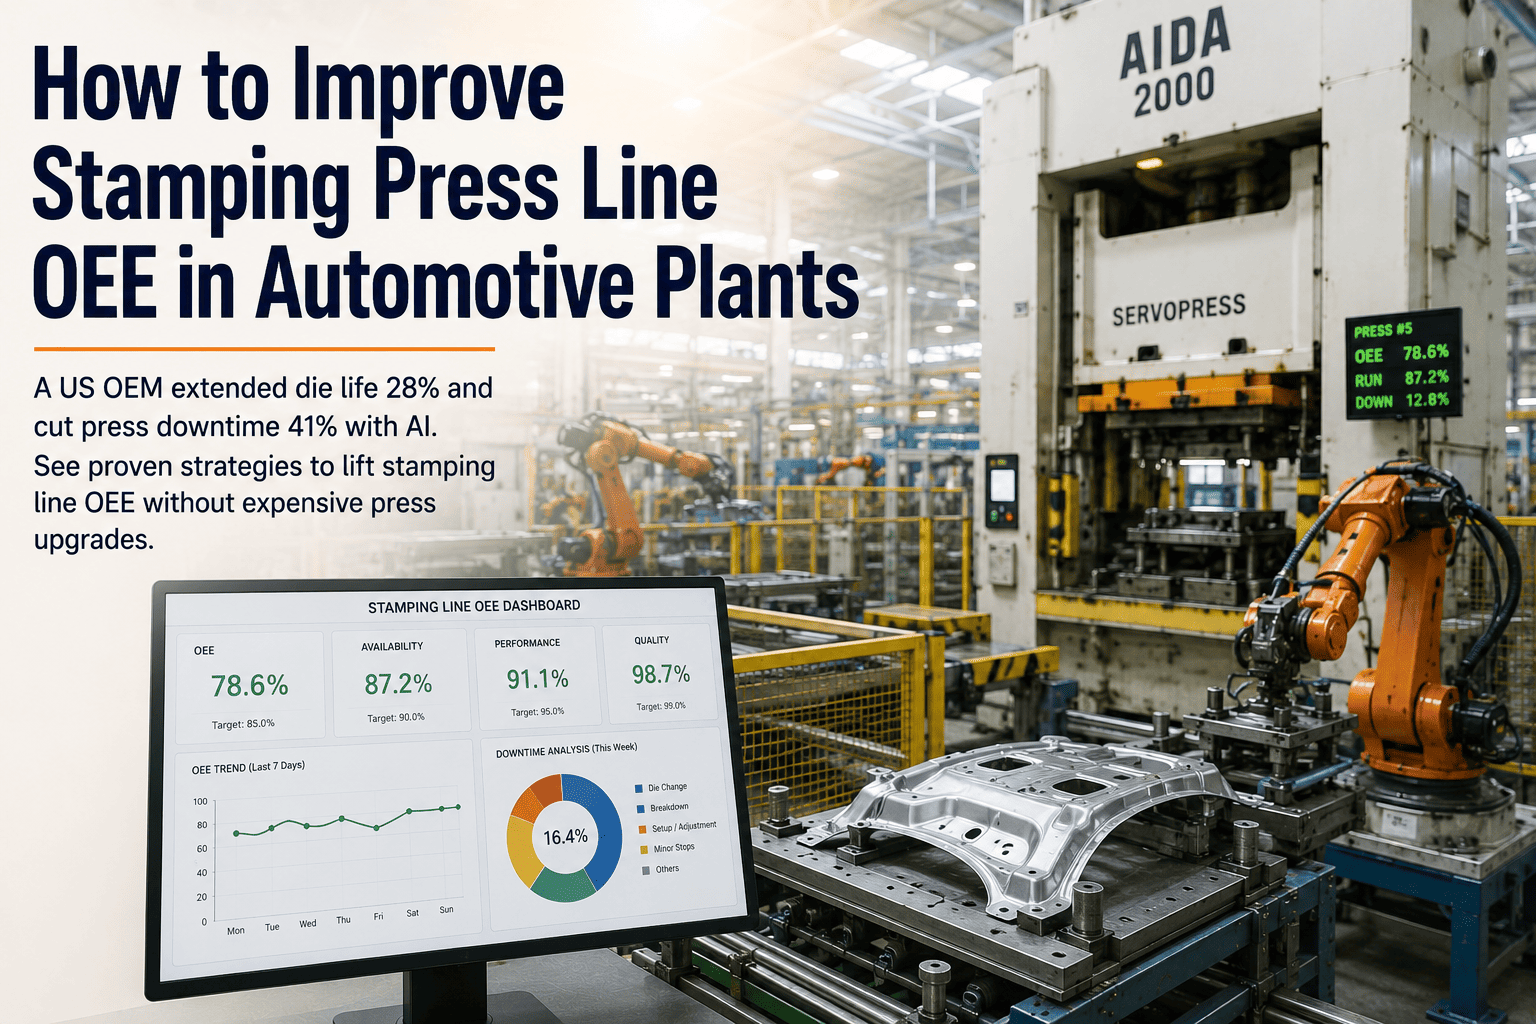
A stamping press line rarely loses its OEE in one dramatic failure. It bleeds it out in pieces — a die pulled for rework at 70 percent of its validated life, a changeover that runs 40 minutes longer than standard because the crane was busy, a run of door panels quietly drifting toward springback that a dimensional check won't catch until 80 bad strokes later. US Tier-1 stamping operations typically run at 60 to 75 percent OEE while best-in-class reach 78 to 82, and the gap is almost entirely reactive maintenance and unmanaged changeover — not press capacity. One US OEM extended die life 28 percent and cut press downtime 41 percent using AI on the presses it already owned, no new tonnage required. This guide breaks down where stamping OEE actually leaks and how to close it. To see it mapped on your line, book a demo.
Lift Stamping Line OEE Without Buying a Single New Press
The gap between typical and world-class stamping OEE is reactive maintenance and unmanaged changeover, not tonnage. See how availability, performance, and quality losses are found and closed on the presses you already run.
One US OEM's Results — No Press Upgrade Involved
OEE = Availability × Performance × Quality
Because the three factors multiply rather than add, a weak one drags the whole score down — and most stamping supervisors know which factor is hurting them but not that a single data layer can lift all three at once. Here is what each factor looks like on a press line, and the biggest loss hiding inside it.
Stop Losing the Press to Preventable Die and Changeover Losses
Availability is where automotive stamping bleeds the most, and both of its big losses are addressable without new equipment. Die stroke-count management is the single most critical condition-monitoring discipline in this vertical — a die failing at 70 percent of its validated service life is a preventable loss reactive maintenance simply misses.
- Dies run to failure instead of to stroke-count condition
- Tonnage overloads that damage tooling go unflagged
- Changeovers run 5–15% of available time, often longer
- Setup waits on cranes with no measured standard
- Die health tracked by stroke count and repair history
- Tonnage-signature monitoring flags overload instantly
- SMED measurement cuts changeover 30–50% over 6–12 months
- Predictive alerts cut unplanned downtime 30–60% on covered assets
Recover the Speed Losses Manual Reporting Never Sees
Performance losses are the quietest because they don't stop the line — they slow it. Automotive operations are especially hurt by short stops under five minutes that manual reporting simply misses, and automated capture typically reveals 10 to 20 percent more downtime than the logs ever showed, making the Pareto of micro-stops actionable for the first time.
- Micro-stops too brief to reach a manual downtime log
- Presses running below target strokes per minute
- Takt deviations invisible until the shift total lands short
- Downstream rework loops adding hidden minor stops
- Automatic micro-stop capture straight from the PLC
- Actual cycle time vs takt, per part and per shift
- A real micro-stop Pareto to attack the top causes first
- Faster fault attribution — this press, this die, this shift
Find the OEE hiding in your press line
iFactory connects to your presses' existing PLCs and tonnage signals, reveals the downtime manual logs miss, and shows which of the three factors to attack first.
Catch the Bad Stroke Before It's Made, Not After
Traditional SPC charts tell you that you made bad parts after they exist. A tonnage deviation that predicts springback in a door panel can take 50 to 100 strokes to surface in a dimensional check — by which point there is scrap to manage and a root cause to chase under pressure. Reading the press signals in real time flips that from reactive to predictive.
- Springback and splits found only at dimensional check
- 50–100 bad strokes made before SPC flags the trend
- Defects logged without press, die, and shift attribution
- Operators reading charts built for quality engineers
- Tonnage and position signatures forecast quality 5–10 strokes ahead
- The operator adjusts before the control limit is breached
- Every defect attributed to press, die, and shift automatically
- A familiar control-chart view, updating live at the press
Where Your Line Sits Against the Stamping Benchmark
OEE targets only mean something in context. These are the ranges that matter for automotive stamping, so a line can be judged against its real peer group rather than a generic 85 percent "world-class" figure that was never meant for a press shop.
| Band | Stamping OEE | What's usually driving it |
|---|---|---|
| Typical Tier-1 | 60–75% | Reactive maintenance and unmanaged die changeover |
| Best-in-class | 78–82% | Condition-based die management and measured SMED |
| Availability drag | Changeover 5–15% of time | Die swaps waiting on cranes and setup, no standard |
| Hidden performance loss | 10–20% more downtime | Micro-stops manual logs never captured |
| Quality detection gap | 50–100 strokes late | SPC flags after the scrap is already made |
From Press Signals to a Higher OEE Number
The improvement is not a rip-and-replace — it is a data layer on the presses already running, turned into action shift by shift.
Turn your press line into a measured OEE climb
iFactory reads the presses you already own, reveals the real losses, and gives operations a factor-by-factor path to best-in-class — no capital press project required.
Common Questions About Stamping Line OEE
Lift Every Factor of Your Stamping Line OEE
Availability, performance, and quality all leak in ways manual reporting never sees. iFactory reads your existing presses, predicts the losses before they land, and turns OEE improvement into a measured climb — without a capital press project.