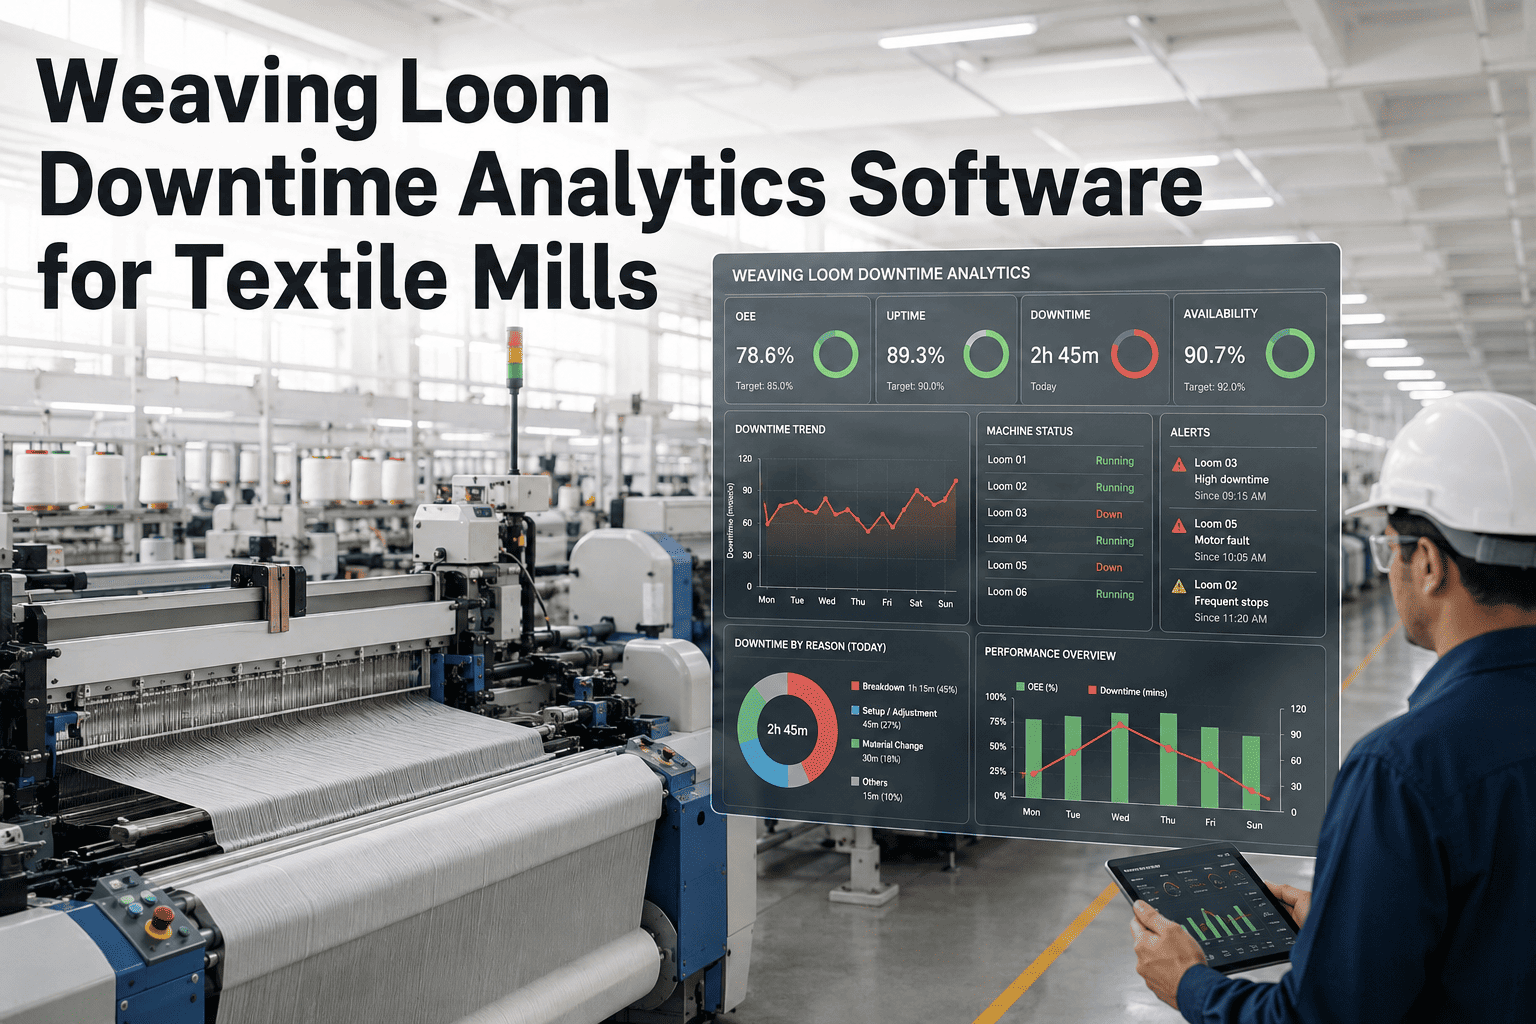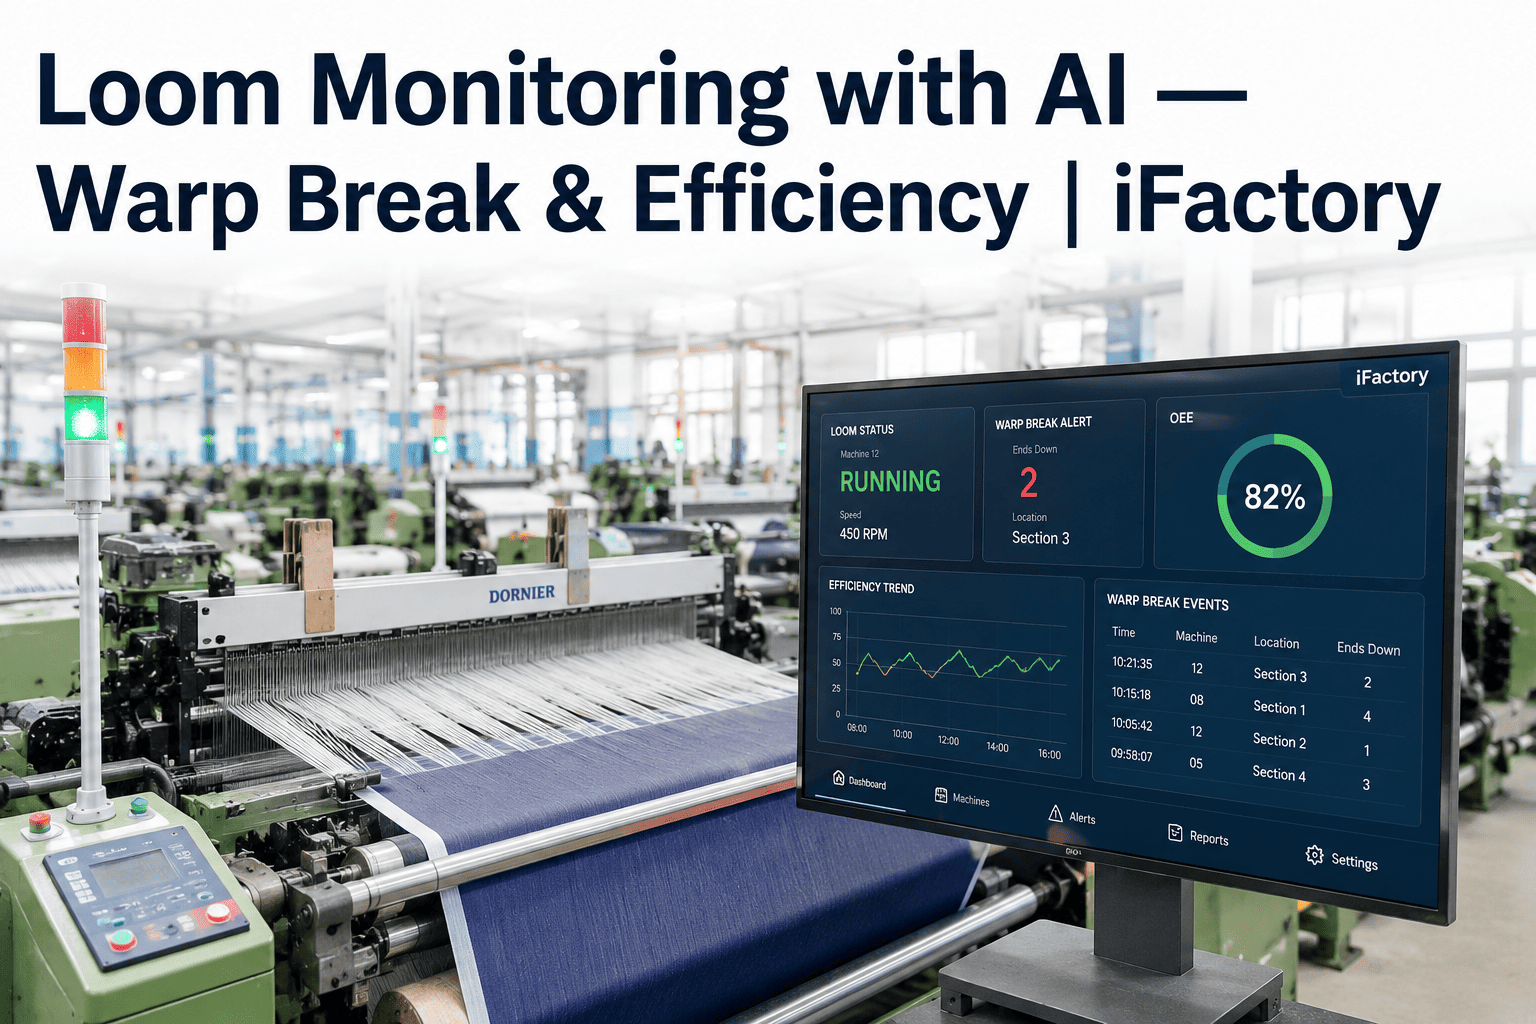
A rapier loom running at 800 picks per minute stops for a reason every few minutes, whether that reason gets logged accurately or not. Multiply that across a shed of 150 looms and the honest answer to "why was efficiency down last Tuesday" usually lives in a supervisor's memory rather than in any system. Warp breaks, weft faults, and unplanned stops quietly eat 15 to 30 percent of theoretical loom capacity in mills that still rely on manual stop-cause logging, and nobody notices the pattern until a customer order slips. AI-based loom monitoring closes that gap by watching every stop, every break, and every efficiency dip in real time, across every machine on the floor.
iFactory tracks warp breaks, weft faults, and efficiency loss across rapier, air-jet, and projectile looms in real time.
What's Actually Costing You Loom Efficiency
Efficiency loss on a weaving floor rarely comes from one dramatic failure. It comes from dozens of small, repeated stops that never get analyzed as a pattern because nobody has the time to cross-reference stop logs across 150 machines by hand. AI monitoring changes that by treating every stop as a data point rather than a shift-end statistic, surfacing the specific loom, shift, and root cause behind recurring efficiency loss.
The Four Stop Causes That Quietly Drain Loom Capacity
Not every loom stop matters equally. Some are unavoidable, but four categories account for most of the recoverable downtime on a typical weaving floor, and each one shows up differently in the sensor data.
Warp Breaks
Drop-wire and vision-based detection localizes exactly where along the weaving width a warp thread broke, correlating repeated breaks at the same position to beam tension or reed damage rather than random chance.
Weft Insertion Faults
Timing deviations in weft insertion on rapier and air-jet looms are flagged before they produce a visible fault in the woven fabric, catching the mechanical drift that causes them.
Pick Density Drift
Gradual pick density variation, often invisible to an operator glancing at the loom, is tracked continuously and flagged the moment it drifts outside the tolerance band for the current style.
Unplanned Mechanical Stops
Motor current signatures and RPM deviation reveal developing mechanical issues, from reed wear to shuttle timing problems, days before they cause a hard stop.
From Paper Logbooks to Real-Time Loom Intelligence
Most weaving mills already collect stop-cause data somewhere, usually on a machine terminal or a paper log a supervisor transcribes at shift end. The shift below is not about collecting more data, it is about turning data that already exists into decisions made the same shift instead of the following week. Book a demo to see this mapped against your own loom fleet.
Sensor & Vision Integration
Drop-wire sensors, motor current monitors, and line-scan cameras are connected to each loom without modifying the mechanical build, feeding a continuous data stream instead of an end-of-shift summary.
Automatic Stop-Cause Classification
Every stop is automatically classified by cause and location, replacing the manual entry that either doesn't happen or happens inconsistently across shifts and operators.
Pattern Detection Across the Shed
The system compares stop patterns across machines running the same style, surfacing which specific looms are underperforming and why, not just that the shed averaged 78% efficiency.
Predictive Maintenance Alerts
Motor current and vibration trends flag developing mechanical faults before they escalate into a hard stop, shifting maintenance from reactive repair to scheduled intervention.
See real-time efficiency, stop-cause classification, and predictive alerts running against your own weaving shed.
Manual Logging vs. AI-Based Loom Monitoring
The comparison below reflects the practical difference mills report after moving from manual stop-cause tracking to continuous AI monitoring across a full weaving shed.
| Capability | Manual Logging | AI-Based Monitoring |
|---|---|---|
| Stop-cause accuracy | Depends on operator memory and diligence | Automatically classified from sensor data |
| Detection speed | End of shift or next-day review | Real time, as the stop occurs |
| Cross-machine comparison | Manual spreadsheet reconciliation | Automatic, updated continuously |
| Mechanical fault warning | None until failure occurs | Days of advance warning from current signature drift |
| Fabric defect detection | Human inspector, 25–50% miss rate over a shift | 99.3% accuracy, every meter inspected |
Frequently Asked Questions
Does loom monitoring work across rapier, air-jet, and projectile looms in the same shed?
Yes. Each loom type has a distinct weft insertion mechanism and stop signature, so the sensor configuration and detection models are tuned per loom type rather than applying a single generic ruleset. A shed running a mix of rapier and air-jet looms gets consistent stop-cause classification across both, which is what makes cross-machine comparison meaningful in the first place.
How is this different from the loom's built-in stop-motion system?
A standard warp stop motion tells the loom to stop when a thread breaks, but it does not tell you why breaks cluster at a particular position, which shift sees the highest break rate, or whether a specific beam is the common thread across repeated stops. AI monitoring adds the analysis layer on top of the existing stop-motion hardware rather than replacing it.
Can this reduce fabric defects, not just downtime?
Yes, and often the fabric quality improvement matters as much as the efficiency gain. Line-scan cameras inspect fabric at full production speed and catch warp breaks, weft faults, and density variations that a fatigued human inspector typically misses after the first hour of a shift. Book a demo to see defect detection running against your own fabric.
What does installation involve, and does it require stopping production?
Sensors and cameras are added to existing looms during a planned changeover rather than an extended shutdown, since the monitoring layer does not require mechanical modification to the loom itself. Most mills roll out monitoring loom-by-loom or section-by-section, so the rest of the shed keeps running normally throughout the deployment.
How quickly do mills typically see a measurable efficiency improvement?
Most sheds see the first actionable pattern, such as a specific loom or shift with an outsized break rate, within the first few weeks of live data, simply because problems that were previously invisible become visible immediately. The deeper predictive maintenance gains, like catching a developing mechanical fault before it causes a stop, typically build over the following months as the system accumulates baseline data for each machine.
Get warp break, weft fault, and efficiency data for every loom on your floor, updated in real time.